Table of Contents

UNITED STATES

SECURITIES AND EXCHANGE COMMISSION

Washington, D.C. 20549

Form 10-K

(Mark One)

ANNUAL REPORT PURSUANT TO SECTION 13 OR 15(d) OF THE SECURITIES EXCHANGE ACT OF 1934

For the fiscal year ended December 31, 2020

OR

TRANSITION REPORT PURSUANT TO SECTION 13 OR 15(d) OF THE SECURITIES EXCHANGE ACT OF 1934

For the transition period from:             to             

Commission File Number: 001-33723

Main Street Capital Corporation

(Exact name of registrant as specified in its charter)

Maryland
(State or other jurisdiction of
incorporation or organization)

41-2230745
(I.R.S. Employer
Identification No.)

1300 Post Oak Boulevard, 8th Floor
Houston, TX
(Address of principal executive offices)

77056
(Zip Code)

(713) 350-6000

(Registrant’s telephone number including area code)

Securities registered pursuant to Section 12(b) of the Act:

Title of Each Class


Trading Symbol


Name of Each Exchange on Which
Registered

Common Stock, par value $0.01 per share

MAIN

New York Stock Exchange

Securities registered pursuant to Section 12(g) of the Act:

None

Indicate by check mark if the registrant is a well-known seasoned issuer, as defined in Rule 405 of the Securities Act.  Yes    No 

Indicate by check mark if the registrant is not required to file reports pursuant to Section 13 or Section 15(d) of the Act.  Yes    No 

Indicate by check mark whether the registrant (1) has filed all reports required to be filed by Section 13 or 15(d) of the Securities Exchange Act of 1934 during the preceding 12 months (or for such shorter period that the registrant was required to file such reports), and (2) has been subject to such filing requirements for the past 90 days. Yes  No 

Indicate by check mark whether the registrant has submitted electronically every Interactive Data File required to be submitted pursuant to Rule 405 of Regulation S-T during the preceding 12 months (or for such shorter period that the registrant was required to submit such files). Yes  No 

Indicate by check mark whether the registrant is a large accelerated filer, an accelerated filer, a non-accelerated filer, a smaller reporting company or an emerging growth company. See the definitions of “large accelerated filer,” “accelerated filer,” “smaller reporting company” and “emerging growth company” in Rule 12b-2 of the Exchange Act.

Large accelerated filer

Accelerated filer

Non-accelerated filer

Smaller reporting company
Emerging growth company

If an emerging growth company, indicate by check mark if the registrant has elected not to use the extended transition period for complying with any new or revised financial accounting standards provided pursuant to Section 13(a) of the Exchange Act. 

Indicate by check mark whether the registrant has filed a report on and attestation to its management’s assessment of the effectiveness of its internal control over financial reporting under Section 404(b) of the Sarbanes-Oxley Act (15 U.S.C. 7262(b)) by the registered public accounting firm that prepared or issued its audit report.

Indicate by check mark whether the registrant is a shell company (as defined in Rule 12b-2 of the Exchange Act). Yes  No 

The aggregate market value of the registrant’s common stock held by non-affiliates of the registrant as of June 30, 2020, was approximately $1,948.5 million based upon the last sale price for the registrant’s common stock on that date.

The number of shares outstanding of the issuer’s common stock as of February 26, 2021 was 67,963,233.

DOCUMENTS INCORPORATED BY REFERENCE

Portions of the registrants’ definitive Proxy Statement for its 2021 Annual Meeting of Stockholders, to be filed with the Securities and Exchange Commission, are incorporated by reference in this Annual Report on Form 10-K in response to Part III.


Table of Contents

TABLE OF CONTENTS

Page

PART I

Item 1.

Business

2

Item 1A.

Risk Factors

24

Item 1B.

Unresolved Staff Comments

52

Item 2.

Properties

52

Item 3.

Legal Proceedings

52

Item 4.

Mine Safety Disclosures

52

PART II

Item 5.

Market for Registrant’s Common Equity, Related Stockholder Matters and Issuer Purchases of Equity Securities

52

Item 6.

Selected Financial Data

56

Item 7.

Management’s Discussion and Analysis of Financial Condition and Results of Operations

59

Item 7A.

Quantitative and Qualitative Disclosures About Market Risk

74

Item 8.

Consolidated Financial Statements and Supplementary Data

76

Item 9.

Changes in and Disagreements with Accountants on Accounting and Financial Disclosure

179

Item 9A.

Controls and Procedures

179

Item 9B.

Other Information

179

PART III

Item 10.

Directors, Executive Officers and Corporate Governance

181

Item 11.

Executive Compensation

181

Item 12.

Security Ownership of Certain Beneficial Owners and Management and Related Stockholder Matters

182

Item 13.

Certain Relationships and Related Transactions, and Director Independence

182

Item 14.

Principal Accountant Fees and Services

182

PART IV

Item 15.

Exhibits and Consolidated Financial Statement Schedules

183

Signatures

186


Table of Contents

CAUTIONARY STATEMENT CONCERNING FORWARD-LOOKING STATEMENTS

This Annual Report on Form 10-K contains forward-looking statements regarding the plans and objectives of management for future operations and which relate to future events or our future performance or financial condition. Any such forward-looking statements may involve known and unknown risks, uncertainties and other factors which may cause our actual results, performance or achievements to be materially different from future results, performance or achievements expressed or implied by any forward-looking statements. Forward-looking statements, which involve assumptions and describe our future plans, strategies and expectations, are generally identifiable by use of the words “may,” “will,” “should,” “expect,” “anticipate,” “estimate,” “believe,” “intend” or “project” or the negative of these words or other variations on these words or comparable terminology. These forward-looking statements are based on assumptions that may be incorrect, and we cannot assure you that the projections included in these forward-looking statements will come to pass. Our actual results could differ materially from those expressed or implied by the forward-looking statements as a result of various factors, including, without limitation, the factors discussed in Item 1A entitled “Risk Factors” in Part I of this Annual Report on Form 10-K and elsewhere in this Annual Report on Form 10-K and in other filings we may make with the Securities and Exchange Comission (“SEC”) from time to time. Other factors that could cause actual results to differ materially include changes in the economy and future changes in laws or regulations and conditions in our operating areas.

We have based the forward-looking statements included in this Annual Report on Form 10-K on information available to us on the date of this Annual Report on Form 10-K, and we assume no obligation to update any such forward-looking statements, unless we are required to do so by applicable law. However, you are advised to refer to any additional disclosures that we may make directly to you or through reports that we in the future may file with the SEC, including subsequent annual reports on Form 10-K, quarterly reports on Form 10-Q and current reports on Form 8-K.

1


Table of Contents

PART I

Item 1. Business

ORGANIZATION

Main Street Capital Corporation (“MSCC”) is a principal investment firm primarily focused on providing customized debt and equity financing to lower middle market (“LMM”) companies and debt capital to middle market (“Middle Market”) companies. The portfolio investments of MSCC and its consolidated subsidiaries are typically made to support management buyouts, recapitalizations, growth financings, refinancings and acquisitions of companies that operate in a variety of industry sectors. MSCC seeks to partner with entrepreneurs, business owners and management teams and generally provides “one stop” financing alternatives within its LMM portfolio. MSCC and its consolidated subsidiaries invest primarily in secured debt investments, equity investments, warrants and other securities of LMM companies based in the United States and in secured debt investments of Middle Market companies generally headquartered in the United States.

MSCC was formed as a Maryland corporation in March 2007 to operate as an internally managed business development company (“BDC”) under the Investment Company Act of 1940, as amended (the “1940 Act”). MSCC wholly owns several investment funds, including Main Street Mezzanine Fund, LP (“MSMF”) and Main Street Capital III, LP (“MSC III” and, collectively with MSMF, the “Funds”), and each of their general partners. The Funds are each licensed as a Small Business Investment Company (“SBIC”) by the United States Small Business Administration (“SBA”). Because MSCC is internally managed, all of the executive officers and other employees are employed by MSCC. Therefore, MSCC does not pay any external investment advisory fees, but instead directly incurs the operating costs associated with employing investment and portfolio management professionals.

MSC Adviser I, LLC (the “External Investment Manager”) was formed in November 2013 as a wholly owned subsidiary of MSCC to provide investment management and other services to parties other than MSCC and its subsidiaries or their portfolio companies (“External Parties”) and receives fee income for such services. MSCC has been granted no-action relief by the SEC to allow the External Investment Manager to register as a registered investment adviser under the Investment Advisers Act of 1940, as amended (the “Advisers Act”). Since the External Investment Manager conducts all of its investment management activities for External Parties, it is accounted for as a portfolio investment of MSCC and is not included as a consolidated subsidiary of MSCC in MSCC’s consolidated financial statements.

MSCC has elected to be treated for U.S. federal income tax purposes as a regulated investment company (“RIC”) under Subchapter M of the Internal Revenue Code of 1986, as amended (the “Code”). As a result, MSCC generally will not pay corporate-level U.S. federal income taxes on any net ordinary taxable income or capital gains that it distributes to its stockholders.

MSCC has certain direct and indirect wholly owned subsidiaries that have elected to be taxable entities (the “Taxable Subsidiaries”). The primary purpose of the Taxable Subsidiaries is to permit MSCC to hold equity investments in portfolio companies which are “pass-through” entities for tax purposes.

Unless otherwise noted or the context otherwise indicates, the terms “we,” “us,” “our,” the “Company” and “Main Street” refer to MSCC and its consolidated subsidiaries, which include the Funds and the Taxable Subsidiaries.

2


Table of Contents

The following diagram depicts our organizational structure:

Graphic


*

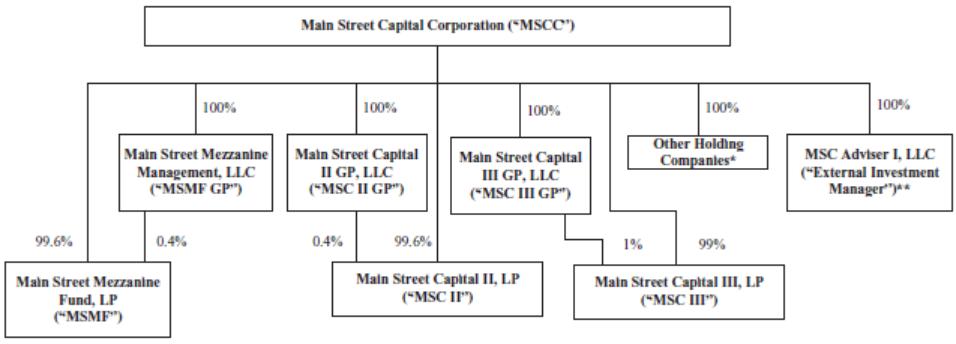
Other Holding Companies includes the Taxable Subsidiaries and other entities formed for operational purposes. Each of these companies is directly or indirectly wholly owned by MSCC.

**

The External Investment Manager is accounted for as a portfolio investment at fair value, as opposed to a consolidated subsidiary, and is indirectly wholly owned by MSCC.

CORPORATE INFORMATION

Our principal executive offices are located at 1300 Post Oak Boulevard, 8th Floor, Houston, Texas 77056. We maintain a Web site on the Internet at www.mainstcapital.com. We make available free of charge on our Web site our annual reports on Form 10-K, quarterly reports on Form 10-Q, current reports on Form 8-K, and all amendments to those reports as soon as reasonably practicable after such material is electronically filed with or furnished to the SEC. Information contained on our Web site is not incorporated by reference into this Annual Report on Form 10-K, and you should not consider that information to be part of this Annual Report on Form 10-K. Our annual reports on Form 10-K, quarterly reports on Form 10-Q, current reports on Form 8-K, and all amendments to those reports and other public filings are also available free of charge on the EDGAR Database on the SEC’s Web site at www.sec.gov.

OVERVIEW OF OUR BUSINESS

Our principal investment objective is to maximize our portfolio’s total return by generating current income from our debt investments and capital appreciation from our equity and equity-related investments, including warrants, convertible securities and other rights to acquire equity securities in a portfolio company. Our LMM companies generally have annual revenues between $10 million and $150 million, and our LMM portfolio investments generally range in size from $5 million to $50 million. Our Middle Market investments are made in businesses that are generally larger in size than our LMM portfolio companies, with annual revenues typically between $150 million and $1.5 billion, and our Middle Market investments generally range in size from $3 million to $20 million. Our private loan (“Private Loan”) portfolio investments are primarily debt securities in privately held companies that have been originated through strategic relationships with other investment funds on a collaborative basis, and are often referred to in the debt markets as “club deals.” Private Loan investments are typically similar in size, structure, terms and conditions to investments we hold in our LMM portfolio and Middle Market portfolio.

We seek to fill the financing gap for LMM businesses, which, historically, have had limited access to financing from commercial banks and other traditional sources. The underserved nature of the LMM creates the opportunity for us to meet the financing needs of LMM companies while also negotiating favorable transaction terms and equity participations. Our ability to invest across a company’s capital structure, from secured loans to equity securities, allows

3


Table of Contents

us to offer portfolio companies a comprehensive suite of financing options, or a “one stop” financing solution. Providing customized, “one stop” financing solutions is important to LMM portfolio companies. We generally seek to partner directly with entrepreneurs, management teams and business owners in making our investments. Our LMM portfolio debt investments are generally secured by a first or second lien on the assets of the portfolio company and typically have a term of between five and seven years from the original investment date.

Our Middle Market portfolio investments primarily consist of direct investments in or secondary purchases of interest-bearing debt securities in privately held companies based in the United States that are generally larger in size than the companies included in our LMM portfolio. Our Middle Market portfolio debt investments are generally secured by either a first or second priority lien on the assets of the portfolio company and typically have an expected duration of between three and seven years from the original investment date.

Private Loan investments are typically similar in size, structure, terms and conditions to investments we hold in our LMM portfolio and Middle Market portfolio. Our Private Loan portfolio debt investments are generally secured by either a first or second priority lien on the assets of the portfolio company and typically have a term of between three and seven years from the original investment date.

Our other portfolio (“Other Portfolio”) investments primarily consist of investments that are not consistent with the typical profiles for our LMM, Middle Market or Private Loan portfolio investments, including investments which may be managed by third parties. In our Other Portfolio, we may incur indirect fees and expenses in connection with investments managed by third parties, such as investments in other investment companies or private funds.

Our external asset management business is conducted through the External Investment Manager. The External Investment Manager earns management fees based on the assets of the funds under management and may earn incentive fees, or a carried interest, based on the performance of the funds managed. We have entered into an agreement with the External Investment Manager to share employees in connection with its asset management business generally, and specifically for its relationship with MSC Income Fund, Inc., an externally managed, non-listed BDC formerly known as HMS Income Fund, Inc. (“MSC Income”) and its other investment advisory clients. Through this agreement, we share employees with the External Investment Manager, including their related infrastructure, business relationships, management expertise and capital raising capabilities.

Our portfolio investments are generally made through MSCC and the Funds. MSCC and the Funds share the same investment strategies and criteria, although they are subject to different regulatory regimes (see “Regulation”). An investor’s return in MSCC will depend, in part, on the Funds’ investment returns as they are wholly owned subsidiaries of MSCC.

The level of new portfolio investment activity will fluctuate from period to period based upon our view of the current economic fundamentals, our ability to identify new investment opportunities that meet our investment criteria, and our ability to consummate the identified opportunities. The level of new investment activity, and associated interest and fee income, will directly impact future investment income. In addition, the level of dividends paid by portfolio companies and the portion of our portfolio debt investments on non-accrual status will directly impact future investment income. While we intend to grow our portfolio and our investment income over the long term, our growth and our operating results may be more limited during depressed economic periods. However, we intend to appropriately manage our cost structure and liquidity position based on applicable economic conditions and our investment outlook. The level of realized gains or losses and unrealized appreciation or depreciation on our investments will also fluctuate depending upon portfolio activity, economic conditions and the performance of our individual portfolio companies. The changes in realized gains and losses and unrealized appreciation or depreciation could have a material impact on our operating results.

Because we are internally managed, we do not pay any external investment advisory fees, but instead directly incur the operating costs associated with employing investment and portfolio management professionals. We believe that our internally managed structure provides us with a beneficial operating expense structure when compared to other publicly traded and privately held investment firms which are externally managed, and our internally managed structure allows us the opportunity to leverage our non-interest operating expenses as we grow our Investment Portfolio (as

4


Table of Contents

defined below). For the years ended December 31, 2020 and 2019, the ratio of our total operating expenses, excluding interest expense, as a percentage of our quarterly average total assets was 1.3% and 1.4%, respectively.

During May 2012, we entered into an investment sub-advisory agreement with HMS Adviser, LP (“HMS Adviser”), which was the investment advisor to MSC Income at the time to provide certain investment advisory services to HMS Adviser in exchange for 50% of the 2.0% annual base management fee and 20% incentive fee earned by HMS Adviser. In December 2013, after obtaining required no-action relief from the SEC to allow us to own a registered investment adviser, we assigned the sub-advisory agreement to the External Investment Manager since the fees received from such arrangement could otherwise have negative consequences on our ability to meet the source-of-income requirement necessary for us to maintain our RIC tax treatment. On October 30, 2020, after successfully receiving the required approval of the stockholders of MSC Income, we completed a transaction whereby the External Investment Manager became the sole investment adviser and administrator to MSC Income pursuant to an Investment Advisory and Administrative Services Agreement (the "Advisory Agreement"). Under the Advisory Agreement, the External Investment Manager earns a 1.75% annual base management fee and a 20% incentive fee in exchange for providing investment advisory services to MSC Income.

In December 2020, the External Investment Manager entered into an Investment Management Agreement with MS Private Loan Fund I, LP, a private investment fund with a strategy to invest in Private Loan portfolio investments (the “Private Loan Fund”), pursuant to which the External Investment Manager provides investment advisory and management services to the Private Loan Fund in exchange for an asset-based fee and certain incentive fees.

The External Investment Manager earns management fees based on the assets of the funds and accounts under management and may earn incentive fees, or a carried interest, based on the performance of the funds and accounts managed. The total contribution of the External Investment Manager to our net investment income consists of the combination of the expenses allocated to the External Investment Manager and the dividend income earned from the External Investment Manager. For the years ended December 31, 2020, 2019 and 2018, the total contribution of the External Investment Manager to our net investment income was $9.9 million, $11.7 million and $10.6 million, respectively. The External Investment Manager agreed to waive the historical incentive fees otherwise earned through December 31, 2018. During the year ended December 31, 2020, the External Investment Manager earned $10.7 million in base management fees and no incentive fees compared to $11.1 million of base management fees and $2.0 million in incentive fees in 2019 and $11.6 million of base management fees in 2018 for the investment advisory services provided related to MSC Income.

We have entered into an agreement with the External Investment Manager to share employees in connection with its asset management business generally, and specifically for its relationship with MSC Income and its other clients. Through this agreement, we share employees with the External Investment Manager, including their related infrastructure, business relationships, management expertise and capital raising capabilities, and we allocate the related expenses to the External Investment Manager pursuant to the sharing agreement. Our total expenses for the years ended December 31, 2020, 2019 and 2018 are net of expenses allocated to the External Investment Manager of $7.4 million, $6.7 million and $6.8 million, respectively.

In April 2014, we received an exemptive order from the SEC permitting co-investments by us and MSC Income in certain negotiated transactions where co-investing would otherwise be prohibited under the 1940 Act. During December 2020, we received an amended exemptive order from the SEC permitting co-investments by us, MSC Income and other funds advised by the External Investment Manager in certain negotiated transactions where co-investing would otherwise be prohibited under the 1940 Act. We have made co-investments with MSC Income and in the future intend to make co-investments with MSC Income, the Private Loan Fund and other funds advised by the External Investment Manager, in accordance with the conditions of the order. The order requires, among other things, that we and the External Investment Manager consider whether each such investment opportunity is appropriate for us and the External Investment Manager’s advised clients, including MSC Income, as applicable, and if it is appropriate, to propose an allocation of the investment opportunity between such parties. Because the External Investment Manager may receive performance-based fee compensation from funds advised by the External Investment Manager, including MSC Income and the Private Loan Fund, this may provide the Company and the External Investment Manager an incentive to allocate opportunities to other participating funds instead of us. However, both we and the External Investment Manager have

5


Table of Contents

policies and procedures in place to manage this conflict, including oversight by the independent members of our Board of Directors.

RECENT DEVELOPMENTS

In January 2021, we issued $300.0 million in aggregate principal amount of 3.00% unsecured notes due July 14, 2026 (the “3.00% Notes”) at an issue price of 99.004%. The total net proceeds from the offering of the 3.00% Notes, resulting from the public issue price and after underwriting discounts and estimated offering expenses payable, were approximately $294.8 million.

During February 2021, we declared monthly dividends of $0.205 per share for each month of April, May and June of 2021. These monthly dividends equal a total of $0.615 per share for the second quarter of 2021, unchanged from the monthly dividends paid in the second quarter of 2020. Including the monthly dividends declared for the second quarter of 2021, we will have paid $30.830 per share in cumulative dividends since our October 2007 initial public offering.

BUSINESS STRATEGIES

Our principal investment objective is to maximize our portfolio’s total return by generating current income from our debt investments and capital appreciation from our equity and equity-related investments, including warrants, convertible securities and other rights to acquire equity securities in a portfolio company. We have adopted the following business strategies to achieve our investment objective:

Deliver Customized Financing Solutions in the Lower Middle Market. We offer LMM portfolio companies customized debt and equity financing solutions that are tailored to the facts and circumstances of each situation. We believe our ability to provide a broad range of customized financing solutions to LMM companies sets us apart from other capital providers that focus on providing a limited number of financing solutions. Our ability to invest across a company’s capital structure, from senior secured loans to subordinated debt to equity securities, allows us to offer LMM portfolio companies a comprehensive suite of financing options, or a “one stop” financing solution.
Focus on Established Companies. We generally invest in companies with established market positions, experienced management teams and proven revenue streams. We believe that those companies generally possess better risk-adjusted return profiles than newer companies that are building their management teams or are in the early stages of building a revenue base. We also believe that established companies in our targeted size range also generally provide opportunities for capital appreciation.
Leverage the Skills and Experience of Our Investment Team. Our investment team has significant experience in lending to and investing in LMM and Middle Market companies. The members of our investment team have broad investment backgrounds, with prior experience at private investment funds, investment banks and other financial services companies and currently include seven certified public accountants and two Chartered Financial Analyst® charter holders. The expertise of our investment team in analyzing, valuing, structuring, negotiating and closing transactions should provide us with competitive advantages by allowing us to consider customized financing solutions and non-traditional or complex structures for our portfolio companies. Also, the reputation of our investment team has and should continue to enable us to generate additional revenue in the form of management and incentive fees in connection with us providing advisory services to other investment funds.
Invest Across Multiple Companies, Industries, Regions and End Markets. We seek to maintain a portfolio of investments that is appropriately balanced among various companies, industries, geographic regions and end markets. This portfolio balance is intended to mitigate the potential effects of negative economic events for particular companies, regions, industries and end markets.

6


Table of Contents

Capitalize on Strong Transaction Sourcing Network. Our investment team seeks to leverage its extensive network of referral sources for portfolio company investments. We have developed a reputation in our marketplace as a responsive, efficient and reliable source of financing, which has created a growing stream of proprietary deal flow for us.
Grow our Asset Management Business. Our asset management business provides us with a recurring source of income, additional income diversification from sources of income directly tied to invested capital and the opportunity for greater shareholder returns through the utilization of our existing investment expertise, strong historical track record and favorable reputation.  We seek to grow our asset management business within our internally managed BDC structure in order to increase the value of this unique benefit to our stakeholders.  We expect such growth to come organically through the expansion of the investment capital that we manage for third parties and the potential extension of our asset management business to new investment strategies, and potentially through mergers and acquisition activities.
Benefit from Lower, Fixed, Long-Term Cost of Capital. The SBIC licenses held by the Funds have allowed them to issue SBA-guaranteed debentures. SBA-guaranteed debentures carry long-term fixed interest rates that are generally lower than interest rates on comparable bank loans and other debt. Because lower-cost SBA leverage is, and will continue to be, a significant part of our capital base through the Funds, our relative cost of debt capital should be lower than many of our competitors. In addition, the SBIC leverage that we receive through the Funds represents a stable, long-term component of our capital structure with proper matching of duration and cost compared to our LMM portfolio investments. We also maintain an investment grade rating from Standard & Poor’s Ratings Services which provides us the opportunity and flexibility to obtain additional, attractive long-term financing options to supplement our capital structure, including the unsecured notes with fixed interest rates we issued in 2017, 2019, 2020 and 2021.

INVESTMENT CRITERIA

Our investment team has identified the following investment criteria that it believes are important in evaluating prospective portfolio companies. Our investment team uses these criteria in evaluating investment opportunities. However, not all of these criteria have been, or will be, met in connection with each of our investments:

Proven Management Team with Meaningful Equity Stake. We look for operationally-oriented management with direct industry experience and a successful track record. In addition, we expect the management team of each LMM portfolio company to have meaningful equity ownership in the portfolio company to better align our respective economic interests. We believe management teams with these attributes are more likely to manage the companies in a manner that both protects our debt investment and enhances the value of our equity investment.
Established Companies with Positive Cash Flow. We seek to invest in established companies with sound historical financial performance. We typically focus on LMM companies that have historically generated earnings before interest, taxes, depreciation and amortization (“EBITDA”) of $3 million to $20 million and commensurate levels of free cash flow. We also pursue investments in debt securities of Middle Market companies that are generally established companies with sound historical financial performance that are generally larger in size than LMM companies. We generally do not invest in start-up companies or companies with speculative business plans.
Defensible Competitive Advantages/Favorable Industry Position. We primarily focus on companies having competitive advantages in their respective markets and/or operating in industries with barriers to entry, which may help to protect their market position and profitability.
Exit Alternatives. We exit our debt investments primarily through the repayment of our investment from internally generated cash flow of the portfolio company and/or a refinancing. In addition, we seek to invest in companies whose business models and expected future cash flows may provide alternate methods of

7


Table of Contents

repaying our investment, such as through a strategic acquisition by other industry participants or a recapitalization.

INVESTMENT PORTFOLIO

The “Investment Portfolio”, as used herein, refers to all of our investments in LMM portfolio companies, investments in Middle Market portfolio companies, Private Loan portfolio investments, Other Portfolio investments, and our investment in the External Investment Manager. Our LMM portfolio investments primarily consist of secured debt, equity warrants and direct equity investments in privately held, LMM companies based in the United States. Our Middle Market portfolio investments primarily consist of direct investments in or secondary purchases of interest-bearing debt securities in privately held companies based in the United States that are generally larger in size than the companies included in our LMM portfolio. Our Private Loan portfolio investments primarily consist of investments in interest-bearing debt securities in companies that are consistent with the size of companies in our LMM portfolio or our Middle Market portfolio, but are investments that we originate on a collaborative basis with other investment funds, and are often referred to in the debt markets as “club deals.” Our Other Portfolio investments primarily consist of investments that are not consistent with the typical profiles for our LMM, Middle Market and Private Loan portfolio investments, including investments which may be managed by third parties. In our Other Portfolio, we may incur indirect fees and expenses in connection with investments managed by third parties, such as investments in other investment companies or private funds.

Debt Investments

Historically, we have made LMM debt investments principally in the form of single tranche debt. Single tranche debt financing involves issuing one debt security that blends the risk and return profiles of both first lien secured and subordinated debt. We believe that single tranche debt is more appropriate for many LMM companies given their size in order to reduce structural complexity and potential conflicts among creditors.

Our LMM debt investments generally have a term of five to seven years from the original investment date, with limited required amortization prior to maturity, and provide for monthly or quarterly payment of interest at interest rates generally between 10% and 14% per annum, payable currently in cash. Interest rate terms can include either fixed or floating rate terms. In addition, certain LMM debt investments may have a form of interest that is not paid currently but is accrued and added to the loan balance and paid at maturity. We refer to this form of interest as payment-in-kind, or PIK, interest. We typically structure our LMM debt investments with the maximum seniority and collateral that we can reasonably obtain while seeking to achieve our total return target. In most cases, our LMM debt investment will be collateralized by a first priority lien on substantially all the assets of the portfolio company. In addition to seeking a senior lien position in the capital structure of our LMM portfolio companies, we seek to limit the downside potential of our LMM debt investments by negotiating covenants that are designed to protect our LMM debt investments while affording our portfolio companies as much flexibility in managing their businesses as is reasonable. Such restrictions may include affirmative and negative covenants, default penalties, lien protection, change of control or change of management provisions, key-man life insurance, guarantees, equity pledges, personal guaranties, where appropriate, and put rights. In addition, we typically seek board representation or observation rights in all of our LMM portfolio companies. Interest rate terms can include either fixed or floating rate terms.

While we will continue to focus our LMM debt investments primarily on single tranche debt investments, we also anticipate structuring some of our debt investments as mezzanine loans. We expect that these mezzanine loans will be primarily junior secured or unsecured, subordinated loans that provide for relatively high interest rates, payable currently in cash, and will provide us with significant interest income. We also anticipate that these mezzanine loans will afford us the additional opportunity for income and gains through PIK interest and equity warrants and other similar equity instruments issued in conjunction with these mezzanine loans. These loans typically will have interest-only payments in the early years, with amortization of principal deferred to the later years of the mezzanine loan term. Typically, our mezzanine loans will have maturities of three to five years. We will generally target interest rates of 12% to 14%, payable currently in cash, for our mezzanine loan investments with higher targeted total returns from equity warrants or PIK interest.

8


Table of Contents

We also pursue debt investments in Middle Market companies. Our Middle Market portfolio investments primarily consist of direct investments or secondary purchases of interest-bearing debt securities in privately held companies based in the United States that are generally larger in size than the companies included in our LMM portfolio. Our Middle Market portfolio debt investments are generally secured by either a first or second priority lien on the assets of the portfolio company and typically have a term of between three and seven years from the original investment date. The debt investments in our Middle Market portfolio have rights and protections that are similar to those in our LMM debt investments, which may include affirmative and negative covenants, default penalties, lien protection, change of control provisions, guarantees and equity pledges. The Middle Market debt investments generally have floating interest rates at the London Interbank Offered Rate (“LIBOR”) plus a margin, and are typically subject to LIBOR floors.

Our Private Loan portfolio investments primarily consist of investments in interest-bearing debt securities in companies that are consistent with the size of companies in our LMM portfolio or our Middle Market portfolio, but are investments which have been originated through strategic relationships with other investment funds on a collaborative basis. Our Private Loan portfolio debt investments are generally secured by either a first or second priority lien and typically have a term of between three and seven years from the original investment date.

Warrants

In connection with our debt investments, we occasionally receive equity warrants to establish or increase our equity interest in the portfolio company. Warrants we receive in connection with a debt investment typically require only a nominal cost to exercise, and thus, as a portfolio company appreciates in value, we may achieve additional investment return from this equity interest. We typically structure the warrants to provide provisions protecting our rights as a minority-interest holder, as well as secured or unsecured put rights, or rights to sell such securities back to the portfolio company, upon the occurrence of specified events. In certain cases, we also may obtain registration rights in connection with these equity interests, which may include demand and “piggyback” registration rights.

Direct Equity Investments

We also will seek to make direct equity investments in situations where it is appropriate to align our interests with key management and stockholders of our LMM portfolio companies, and to allow for participation in the appreciation in the equity values of our LMM portfolio companies. We usually make our direct equity investments in connection with debt investments in our LMM portfolio companies. In addition, we may have both equity warrants and direct equity positions in some of our LMM portfolio companies. We seek to maintain fully diluted equity positions in our LMM portfolio companies of 5% to 50%, and may have controlling equity interests in some instances. We have a value orientation toward our direct equity investments and have traditionally been able to purchase our equity investments at reasonable valuations.

INVESTMENT PROCESS

Our management team’s investment committee is responsible for all aspects of our investment processes. The current members of our investment committee are Dwayne L. Hyzak, our Chief Executive Officer, David Magdol, our President and Chief Investment Officer, and Vincent D. Foster, our Executive Chairman.

The investment processes for LMM and Middle Market portfolio investments are outlined below. The investment processes for Private Loan portfolio investments, from origination to close and to eventual exit, follow the processes for our LMM portfolio investments or our Middle Market portfolio investments as outlined below, or a combination thereof. Our investment strategy involves a “team” approach, whereby potential transactions are screened by several members of our investment team before being presented to the investment committee. Our investment committee meets on an as-needed basis depending on transaction volume. We generally categorize our investment process into seven distinct stages:

9


Table of Contents

Deal Generation/Origination

Deal generation and origination is maximized through long-standing and extensive relationships with industry contacts, brokers, commercial and investment bankers, entrepreneurs, service providers such as lawyers, financial advisors and accountants, and current and former portfolio companies and investors. Our investment team has focused its deal generation and origination efforts on LMM and Middle Market companies, and we have developed a reputation as a knowledgeable, reliable and active source of capital and assistance in these markets.

Screening

During the screening process, if a transaction initially meets our investment criteria, we will perform preliminary due diligence, taking into consideration some or all of the following information:

a comprehensive financial model based on quantitative analysis of historical financial performance, projections and pro forma adjustments to determine the estimated internal rate of return;
a brief industry and market analysis;
direct industry expertise imported from other portfolio companies or investors;
preliminary qualitative analysis of the management team’s competencies and backgrounds;
potential investment structures and pricing terms; and
regulatory compliance.

Upon successful screening of a proposed LMM transaction, the investment team makes a recommendation to our investment committee. If our investment committee concurs with moving forward on the proposed LMM transaction, we typically issue a non-binding term sheet to the company. For Middle Market portfolio investments, the initial term sheet is typically issued by the borrower, through the syndicating bank, and is screened by the investment team which makes a recommendation to our investment committee.

Term Sheet

For proposed LMM transactions, the non-binding term sheet will include the key economic terms based upon our analysis performed during the screening process, as well as a proposed timeline and our qualitative expectation for the transaction. While the term sheet for LMM investments is non-binding, we typically receive an expense deposit in order to move the transaction to the due diligence phase. Upon execution of a term sheet, we begin our formal due diligence process.

For proposed Middle Market transactions, the initial term sheet will include key economic terms and other conditions proposed by the borrower and its representatives and the proposed timeline for the investment, which are reviewed by our investment team to determine if such terms and conditions are in agreement with our investment objectives.

Due Diligence

Due diligence on a proposed LMM investment is performed by a minimum of three of our investment professionals, whom we refer to collectively as the investment team, and certain external resources, who together conduct due diligence to understand the relationships among the prospective portfolio company’s business plan, operations and financial performance. Our LMM due diligence review includes some or all of the following:

site visits with management and key personnel;

10


Table of Contents

detailed review of historical and projected financial statements;
operational reviews and analysis;
interviews with customers and suppliers;
detailed evaluation of company management, including background checks;
review of material contracts;
in-depth industry, market and strategy analysis;
regulatory compliance analysis; and
review by legal, environmental or other consultants, if applicable.

Due diligence on a proposed Middle Market investment is generally performed on materials and information obtained from certain external resources and assessed internally by a minimum of two of our investment professionals, who work to understand the relationships among the prospective portfolio company’s business plan, operations and financial performance using the accumulated due diligence information. Our Middle Market due diligence review includes some or all of the following:

detailed review of historical and projected financial statements;
in-depth industry, market, operational and strategy analysis;
regulatory compliance analysis; and
detailed review of the company’s management team and their capabilities.

During the due diligence process, significant attention is given to sensitivity analyses and how the company might be expected to perform given downside, base-case and upside scenarios. In certain cases, we may decide not to make an investment based on the results of the diligence process.

Document and Close

Upon completion of a satisfactory due diligence review of a proposed LMM portfolio investment, the investment team presents the findings and a recommendation to our investment committee. The presentation contains information which can include, but is not limited to, the following:

company history and overview;
transaction overview, history and rationale, including an analysis of transaction strengths and risks;
analysis of key customers and suppliers and key contracts;
a working capital analysis;
an analysis of the company’s business strategy;
a management and key equity investor background check and assessment;
11

Table of Contents
third-party accounting, legal, environmental or other due diligence findings;
investment structure and expected returns;
anticipated sources of repayment and potential exit strategies;
pro forma capitalization and ownership;
an analysis of historical financial results and key financial ratios;
sensitivities to management’s financial projections;
regulatory compliance analysis findings; and
detailed reconciliations of historical to pro forma results.

Upon completion of a satisfactory due diligence review of a proposed Middle Market portfolio investment, the investment team presents the findings and a recommendation to our investment committee. The presentation contains information which can include, but is not limited to, the following:

company history and overview;
transaction overview, history and rationale, including an analysis of transaction strengths and risks;
analysis of key customers and suppliers;
an analysis of the company’s business strategy;
investment structure and expected returns;
anticipated sources of repayment and potential exit strategies;
pro forma capitalization and ownership;
regulatory compliance analysis findings; and
an analysis of historical financial results and key financial ratios.

If any adjustments to the transaction terms or structures are proposed by the investment committee, such changes are made and applicable analyses are updated prior to approval of the transaction. Approval for the transaction must be made by the affirmative vote from a majority of the members of the investment committee, with the committee member managing the transaction, if any, abstaining from the vote. Upon receipt of transaction approval, the investment team will re-confirm regulatory compliance, process and finalize all required legal documents, and fund the investment.

Post-Investment

We continuously monitor the status and progress of the portfolio companies. We generally offer managerial assistance to our portfolio companies, giving them access to our investment experience, direct industry expertise and contacts. The same investment team that was involved in the investment process will continue its involvement in the portfolio company post-investment. This provides for continuity of knowledge and allows the investment team to maintain a strong business relationship with key management of our portfolio companies for post-investment assistance and monitoring purposes.

12


Table of Contents

As part of the monitoring process of LMM portfolio investments, the investment team will analyze monthly and quarterly financial statements versus the previous periods and year, review financial projections, meet and discuss issues or opportunities with management, attend board meetings and review all compliance certificates and covenants. While we maintain limited involvement in the ordinary course operations of our LMM portfolio companies, we maintain a higher level of involvement in non-ordinary course financing or strategic activities and any non-performing scenarios. We also monitor the performance of our Middle Market portfolio investments; however, due to the larger size and higher sophistication level of these Middle Market companies in comparison to our LMM portfolio companies, it is not necessary or practical to have as much direct management interface.

We utilize an internally developed investment rating system to rate the performance of each LMM portfolio company and to monitor our expected level of returns on each of our LMM investments in relation to our expectations for the portfolio company. The investment rating system takes into consideration various factors, including, but not limited to, each investment’s expected level of returns, the collectability of our debt investments and the ability to receive a return of the invested capital in our equity investments, comparisons to competitors and other industry participants, the portfolio company’s future outlook and other factors that are deemed to be significant to the portfolio company.

Exit Strategies/Refinancing

While we generally exit most investments through the refinancing or repayment of our debt and redemption or sale of our equity positions, we typically assist our LMM portfolio companies in developing and planning exit opportunities, including any sale or merger of our portfolio companies. We may also assist in the structure, timing, execution and transition of the exit strategy. The refinancing or repayment of Middle Market debt investments typically does not require our assistance due to the additional resources available to these larger, Middle Market companies.

DETERMINATION OF NET ASSET VALUE AND INVESTMENT PORTFOLIO VALUATION PROCESS

We determine the net asset value per share of our common stock on a quarterly basis. The net asset value per share is equal to our total assets minus total liabilities divided by the total number of shares of common stock outstanding.

We are required to report our investments at fair value. As a result, the most significant determination inherent in the preparation of our consolidated financial statements is the valuation of our Investment Portfolio and the related amounts of unrealized appreciation and depreciation. We follow the provisions of the Financial Accounting Standards Board Accounting Standards Codification (“ASC”) 820, Fair Value Measurements and Disclosures (“ASC 820”). ASC 820 defines fair value, establishes a framework for measuring fair value, establishes a fair value hierarchy based on the quality of inputs used to measure fair value and enhances disclosure requirements for fair value measurements. ASC 820 requires us to assume that the portfolio investment is to be sold in the principal market to independent market participants, which may be a hypothetical market. Market participants are defined as buyers and sellers in the principal market that are independent, knowledgeable and willing and able to transact.

We determine in good faith the fair value of our Investment Portfolio pursuant to a valuation policy in accordance with ASC 820 and a valuation process approved by our Board of Directors and in accordance with the 1940 Act. Our valuation policies and processes are intended to provide a consistent basis for determining the fair value of our Investment Portfolio. See “Note B.1. — Valuation of the Investment Portfolio” in the notes to consolidated financial statements for a detailed discussion of our investment portfolio valuation process and procedures.

Due to the inherent uncertainty in the valuation process, our determination of fair value for our Investment Portfolio may differ materially from the values that would have been determined had a ready market for the securities existed. In addition, changes in the market environment, portfolio company performance and other events that may occur over the lives of the investments may cause the gains or losses ultimately realized on these investments to be materially different than the valuations currently assigned. We determine the fair value of each individual investment and record changes in fair value as unrealized appreciation or depreciation.

13


Table of Contents

As described below, we undertake a multi-step valuation process each quarter in connection with determining the fair value of our investments, with our Board of Directors having final responsibility for overseeing, reviewing and approving, in good faith, our determination of the fair value for our Investment Portfolio and our valuation procedures, consistent with 1940 Act requirements. In addition, the Audit Committee of our Board of Directors periodically evaluates the performance and methodologies of the financial advisory services firm that we consult in connection with valuing our LMM and Private Loan portfolio company investments.

Our quarterly valuation process begins with each LMM and Private Loan portfolio company investment being initially valued by the investment team responsible for monitoring the portfolio investment;
The fair value determination for our Middle Market and Other Portfolio debt and equity investments and our investment in the External Investment Manager consists of unobservable and observable inputs which are initially reviewed by the investment professionals responsible for monitoring the portfolio investment;
Preliminary valuation conclusions are then reviewed by and discussed with senior management, and the investment team considers and assesses, as appropriate, any changes that may be required to the preliminary valuations to address any comments provided by senior management;
A nationally recognized independent financial advisory services firm analyzes and provides observations, recommendations and an assurance certification regarding the determinations of the fair value for our LMM and Private Loan portfolio companies;
The Audit Committee of our Board of Directors reviews management’s valuations, and the investment team and senior management consider and assess, as appropriate, any changes that may be required to management’s valuations to address any comments provided by the Audit Committee; and
The Board of Directors assesses the valuations and ultimately approves the fair value of each investment in our portfolio in good faith.

Determination of fair value involves subjective judgments and estimates. The notes to our consolidated financial statements refer to the uncertainty with respect to the possible effect of such valuations, and any change in such valuations, on our financial results and financial condition.

COMPETITION

We compete for investments with a number of investment funds (including private equity funds, mezzanine funds, BDCs, and SBICs), as well as traditional financial services companies such as commercial banks and other sources of financing. Many of the entities that compete with us are larger and have more resources available to them. We believe we are able to be competitive with these entities primarily on the basis of our focus toward the underserved LMM, the experience and contacts of our management team, our responsive and efficient investment analysis and decision-making processes, our comprehensive suite of customized financing solutions and the investment terms we offer.

We believe that some of our competitors make senior secured loans, junior secured loans and subordinated debt investments with interest rates and returns that are comparable to or lower than the rates and returns that we target. Therefore, we do not seek to compete primarily on the interest rates and returns that we offer to potential portfolio companies. For additional information concerning the competitive risks we face, see “Risk Factors — Risks Relating to Our Business and Structure — We face increasing competition for investment opportunities.”

HUMAN CAPITAL

Our employees are vital to our success as a principal investment firm. As a human-capital intensive business, the long-term success of our company depends on our people. We strive to attract, develop and retain our employees by

14


Table of Contents

offering unique employment opportunities, superior advancement and promotion opportunities, attractive compensation and benefit structures and a close-knit culture. The departure of our key investment and other personnel could cause our operating results to suffer.

Our LMM business segment depends heavily on the business owners and management teams of our portfolio companies and their respective employees, contractors and service providers. In our investment process for LMM portfolio investments, the analysis of these individuals is a critical part of our overall investment underwriting process and as a result we carefully review the qualifications and experience of the portfolio company’s business owners and management team and their employment practices. We strive to partner with business owners and management teams whose business practices reflect our core values.

We strive to recruit talented and driven individuals who share our values. We have competitive programs dedicated to attracting and retaining new talent and enhancing the skills of our employees. Our recruiting efforts utilize strong relationships with a variety of sources from which we recruit. Among other opportunities, we offer selected students investment analyst internships, which are expected to lead to permanent roles for high performing and high potential interns. Through our internship program, individuals who want to become investment analysts have the opportunity to see the full investment process from origination to closing, as well as post-closing portfolio management activities. We routinely recruit from within, promoting current employees who have shown the technical ability, attitude, interest and the initiative to take on greater responsibility.

We have designed a compensation structure, including an array of benefit plans and programs, that we believe is attractive to our current and prospective employees. We also offer formal and informal training and mentorship programs that provide employees with access to senior level executives. Through our annual goal setting and performance review processes, our employees are annually evaluated by supervisors and our senior management team to ensure employees continue to develop and advance as expected. We are committed to having a diverse workforce, and an inclusive work environment is a natural extension of our culture. We also maintain a Women’s Initiative that provides employees with opportunities to network internally at MSCC and externally with other women in the financial services industry. Our employees have access to several programs designed to enable our employees to balance work, family and family-related situations including flexible working arrangements and parental leave for birth and adoption placement. We are committed to creating and maintaining an atmosphere where all employees feel welcomed, valued, respected and heard so that they feel motivated and encouraged to contribute fully to their careers, our company and our communities.

We seek to maintain a close-knit culture, which we believe is an important factor in employee retention, which is reinforced by our Community Building Committee. Our Community Building Committee, which is composed of a substantial cross section of employees across our organization, develops programs and initiatives that promote an open and inclusive atmosphere and encourage employee outreach with our community, in each case based upon feedback received from our employees. Recent initiatives generated by our Community Building Committee include a volunteer time-off program, a matching donation policy and partnerships with local charitable organizations. We encourage you to visit our website for more information about charitable organizations receiving our ongoing support. Nothing on our website, however, shall be deemed incorporated by reference into this Annual Report on Form 10-K.

We monitor and evaluate various turnover and attrition metrics throughout our management team. Our annualized voluntary turnover is relatively low, a record which we attribute to our strong corporate culture, commitment to career development and attractive compensation and benefit programs.

In addition to our normal prioritization of the health and safety of our employees, during 2020, to address the specific safety and health matters of our workforce in response to the COVID-19 pandemic, we implemented the following, among other steps:

Temporarily closing our offices and establishing new safety protocols and procedures;
Maintaining regular communication regarding the impacts of the pandemic on our team members and operations;

15


Table of Contents

Developing and distributing return-to-office guidelines to ensure the safe return of employees to our office;
Providing daily temperature checks and symptom screening and requiring those who are infected or exposed to the virus to quarantine in accordance with public health guidelines;
Enhanced cleaning protocols;
Establishing physical distancing procedures, modifying workspaces, and providing personal protective equipment and cleaning supplies for employees working onsite; and
Creating and refining protocols to address actual and suspected COVID-19 cases and potential exposure of our employees and our business partners.

As of December 31, 2020, we had approximately 76 employees, 48 of whom we characterize as investment and portfolio management professionals, and the others include operations professionals and administrative staff. None of our employees are represented by a collective bargaining agreement. As necessary, we will hire additional investment professionals and administrative personnel. All of our employees are located in our Houston, Texas office.

REGULATION

Regulation as a Business Development Company

We have elected to be regulated as a BDC under the 1940 Act. The 1940 Act contains prohibitions and restrictions relating to transactions between BDCs and their affiliates, principal underwriters and affiliates of those affiliates or underwriters. The 1940 Act requires that a majority of the members of the board of directors of a BDC be persons other than “interested persons,” as that term is defined in the 1940 Act. In addition, the 1940 Act provides that we may not change the nature of our business so as to cease to be, or to withdraw our election as, a BDC unless approved by a majority of our outstanding voting securities.

The 1940 Act defines “a majority of the outstanding voting securities” as the lesser of (i) 67% or more of the voting securities present at a meeting if the holders of more than 50% of our outstanding voting securities are present or represented by proxy or (ii) more than 50% of our outstanding voting securities.

Qualifying Assets

Under the 1940 Act, a BDC may not acquire any asset other than assets of the type listed in Section 55(a) of the 1940 Act, which are referred to as qualifying assets, unless, at the time the acquisition is made, qualifying assets represent at least 70% of the company’s total assets. The principal categories of qualifying assets relevant to our business are any of the following:

(1)Securities purchased in transactions not involving any public offering from the issuer of such securities, which issuer (subject to certain limited exceptions) is an eligible portfolio company (as defined below), or from any person who is, or has been during the preceding 13 months, an affiliated person of an eligible portfolio company, or from any other person, subject to such rules as may be prescribed by the SEC.
(2)Securities of any eligible portfolio company that we control.
(3)Securities purchased in a private transaction from a U.S. issuer that is not an investment company or from an affiliated person of the issuer, or in transactions incident thereto, if the issuer is in bankruptcy and subject to reorganization or if the issuer, immediately prior to the purchase of its securities was unable to meet its obligations as they came due without material assistance other than conventional lending or financing arrangements.

16


Table of Contents

(4)Securities of an eligible portfolio company purchased from any person in a private transaction if there is no ready market for such securities and we already own 60% of the outstanding equity of the eligible portfolio company.
(5)Securities received in exchange for or distributed on or with respect to securities described in (1) through (4) above, or pursuant to the exercise of warrants or rights relating to such securities.
(6)Cash, cash equivalents, U.S. government securities or high-quality debt securities maturing in one year or less from the time of investment.

In addition, a BDC must have been organized and have its principal place of business in the United States and must be operated for the purpose of making investments in the types of securities described in (1), (2) or (3) above.

An eligible portfolio company is defined in the 1940 Act as any issuer which:

(a)is organized under the laws of, and has its principal place of business in, the United States;
(b)is not an investment company (other than a small business investment company wholly owned by the BDC) or a company that would be an investment company but for certain exclusions under the 1940 Act; and
(c)satisfies any of the following:
(i)does not have any class of securities that is traded on a national securities exchange or has a class of securities listed on a national securities exchange but has an aggregate market value of outstanding voting and non-voting common equity of less than $250 million;
(ii)is controlled by a BDC or a group of companies including a BDC and the BDC has an affiliated person who is a director of the eligible portfolio company; or
(iii)is a small and solvent company having total assets of not more than $4 million and capital and surplus of not less than $2 million.

Managerial Assistance to Portfolio Companies

As noted above, a BDC must be operated for the purpose of making investments in the type of securities described in (1), (2) or (3) above under the heading entitled “— Qualifying Assets.” In addition, BDCs must generally offer to make available to such issuer of the securities (other than small and solvent companies described above) significant managerial assistance; except that, where we purchase such securities in conjunction with one or more other persons acting together, one of the other persons in the group may make available such managerial assistance. Making available managerial assistance means, among other things, any arrangement whereby the BDC, through its directors, officers or employees, offers to provide, and, if accepted, does so provide, significant guidance and counsel concerning the management, operations or business objectives and policies of a portfolio company.

Temporary Investments

Pending investment in “qualifying assets,” as described above, our investments may consist of cash, cash equivalents, U.S. government securities and high-quality debt securities maturing in one year or less from time of investment therein, so that 70% of our assets are qualifying assets.

Senior Securities

Under the provisions of the 1940 Act, we are permitted, as a BDC, to issue senior securities only in amounts such that our asset coverage, as defined in the 1940 Act, equals at least 200% of all debt and/or senior stock immediately

17


Table of Contents

after each such issuance. However, 2018 legislation modified the 1940 Act by allowing a BDC to increase the maximum amount of leverage it may incur from an asset coverage ratio of 200% to an asset coverage ratio of 150%, if certain requirements are met. We are permitted to increase our leverage capacity if stockholders representing at least a majority of the votes cast, when quorum is met, approve a proposal to do so. If we receive such stockholder approval, we would be permitted to increase our leverage capacity on the first day after such approval. Alternatively, we may increase the maximum amount of leverage we may incur to an asset coverage ratio of 150% if the “required majority” of our independent directors as defined in Section 57(o) of the 1940 Act approve such increase with such approval becoming effective after one year. In either case, we would be required to make certain disclosures on our website and in SEC filings regarding, among other things, the receipt of approval to increase our leverage, our leverage capacity and usage, and risks related to leverage. In addition, while any senior securities remain outstanding (other than senior securities representing indebtedness issued in consideration of a privately arranged loan which is not intended to be publicly distributed), we must make provisions to prohibit any cash distribution to our stockholders or the repurchase of such securities or shares unless we meet the applicable asset coverage ratios at the time of the distribution or repurchase. We may also borrow amounts up to 5% of the value of our total assets for temporary or emergency purposes without regard to asset coverage. For a discussion of the risks associated with leverage, see “Risk Factors — Risks Relating to Our Debt Financing,” including, without limitation, “— Because we borrow money, the potential for gain or loss on amounts invested in us is magnified and may increase the risk of investing in us.”

We have previously received an exemptive order from the SEC to exclude debt securities issued by MSMF and any other wholly owned subsidiaries of ours which operate as SBICs from the asset coverage requirements of the 1940 Act as applicable to Main Street. The exemptive order provides for the exclusion of all debt securities issued by the Funds, including the $309.8 million of outstanding debt as of December 31, 2020, issued pursuant to the SBIC program. This exemptive order provides us with expanded capacity and flexibility in obtaining future sources of capital for our investment and operational objectives.

Common Stock

We are not generally able to issue and sell our common stock at a price below net asset value per share. We may, however, sell our common stock, warrants, options or rights to acquire our common stock, at a price below the current net asset value of the common stock if our Board of Directors determines that such sale is in our best interests and that of our stockholders, and our stockholders approve such sale. In any such case, the price at which our securities are to be issued and sold may not be less than a price which, in the determination of our Board of Directors, closely approximates the market value of such securities (less any distributing commission or discount). We did not seek stockholder authorization to sell shares of our common stock below the then current net asset value per share of our common stock at our 2020 annual meeting of stockholders because our common stock price had been trading significantly above the net asset value per share of our common stock since 2011. Our stockholders have previously approved a proposal that authorizes us to issue securities to subscribe to, convert to, or purchase shares of our common stock in one or more offerings. We may also make rights offerings to our stockholders at prices per share less than the net asset value per share, subject to applicable requirements of the 1940 Act. See “Risk Factors — Risks Relating to Our Securities — Stockholders may incur dilution if we sell shares of our common stock in one or more offerings at prices below the then current net asset value per share of our common stock or issue securities to subscribe to, convert to or purchase shares of our common stock.”

Code of Ethics

We have adopted a code of ethics pursuant to Rule 17j-1 under the 1940 Act that establishes procedures for personal investments and restricts certain personal securities transactions. Personnel subject to the code may invest in securities for their personal investment accounts, including securities that may be purchased or held by us, so long as such investments are made in accordance with the code’s requirements. The code of ethics is available on the EDGAR Database on the SEC’s Web site at http://www.sec.gov.

18


Table of Contents

Proxy Voting Policies and Procedures

We vote proxies relating to our portfolio securities in a manner in which we believe is consistent with the best interest of our stockholders. We review on a case-by-case basis each proposal submitted to a stockholder vote to determine its impact on the portfolio securities held by us. Although we generally vote against proposals that we expect would have a negative impact on our portfolio securities, we may vote for such a proposal if there exists compelling long-term reasons to do so.

Our proxy voting decisions are made by the investment team which is responsible for monitoring each of our investments. To ensure that our vote is not the product of a conflict of interest, we require that anyone involved in the decision-making process discloses to our chief compliance officer any potential conflict regarding a proxy vote of which he or she is aware.

Stockholders may obtain information, without charge, regarding how we voted proxies with respect to our portfolio securities by making a written request for proxy voting information to: Chief Compliance Officer, 1300 Post Oak Boulevard, 8th Floor, Houston, Texas 77056.

Other 1940 Act Regulations

We are also prohibited under the 1940 Act from knowingly participating in certain transactions with our affiliates without the prior approval of our Board of Directors who are not interested persons and, in some cases, prior approval by the SEC.

We are required to provide and maintain a bond issued by a reputable fidelity insurance company to protect us against larceny and embezzlement. Furthermore, as a BDC, we are prohibited from protecting any director or officer against any liability to us or our stockholders arising from willful misfeasance, bad faith, gross negligence or reckless disregard of the duties involved in the conduct of such person’s office.

We are required to adopt and implement written policies and procedures reasonably designed to prevent violation of the federal securities laws, review these policies and procedures no less frequently than annually for their adequacy and the effectiveness of their implementation, and to designate a chief compliance officer to be responsible for administering the policies and procedures.

We may be periodically examined by the SEC for compliance with the 1940 Act.

Small Business Investment Company Regulations

Each of the Funds is licensed by the SBA to operate as a SBIC under Section 301(c) of the Small Business Investment Act of 1958. MSMF obtained its SBIC license in 2002, MSC II obtained its license in 2006 and MSC III obtained its license in 2016.

SBICs are designed to stimulate the flow of private capital to eligible small businesses. Under SBIC regulations, SBICs may make loans to eligible small businesses, invest in the equity securities of such businesses and provide them with consulting and advisory services. Each of the Funds has typically invested in secured debt, acquired warrants and/or made equity investments in qualifying small businesses.

The Funds are subject to regulation and oversight by the SBA, including requirements with respect to reporting financial information, such as the extent of capital impairment if applicable, on a regular basis and annual examinations conducted by the SBA. The SBA, as a creditor, will have a superior claim to the Funds’ assets over our securities holders in the event the Funds are liquidated or the SBA exercises its remedies under the SBA-guaranteed debentures issued by the Funds upon an event of default.

We have received exemptive relief from the SEC to permit us to exclude the SBA-guaranteed debentures of the Funds from our 200% asset coverage test under the 1940 Act. As such, our ratio of total consolidated assets to

19


Table of Contents

outstanding indebtedness may be less than 200%. This provides us with increased investment flexibility but also increases our risks related to leverage. See “Risk Factors — Risks Relating to Our Debt Financing — Because we borrow money, the potential for gain or loss on amounts invested in us is magnified and may increase the risk of investing in us.”

Under present SBIC regulations, eligible small businesses generally include businesses that (together with their affiliates) have a tangible net worth not exceeding $19.5 million or have average annual net income after U.S. federal income taxes not exceeding $6.5 million (average net income to be computed without benefit of any carryover loss) for the two most recent fiscal years. In addition, an SBIC must devote 25% of its investment activity to “smaller” enterprises as defined by the SBA. A smaller enterprise generally includes businesses that have a tangible net worth not exceeding $6 million and have average annual net income after U.S. federal income taxes not exceeding $2 million (average net income to be computed without benefit of any net carryover loss) for the two most recent fiscal years. SBIC regulations also provide alternative size standard criteria to determine eligibility for designation as an eligible small business or smaller enterprise, which criteria depend on the primary industry in which the business is engaged and are based on such factors as the number of employees and gross revenue. However, once an SBIC has invested in a company, it generally may continue to make follow-on investments in the company, regardless of the size of the portfolio company at the time of the follow-on investment, up to the time of the portfolio company’s initial public offering.

The SBA prohibits an SBIC from providing funds to small businesses for certain purposes, such as relending and investment outside the United States, to businesses engaged in certain prohibited industries, and to certain “passive” (non-operating) companies. In addition, without prior SBA approval, an SBIC may not invest an amount equal to more than approximately 30% of the SBIC’s regulatory capital, as defined by the SBA, in any one portfolio company and its affiliates.

The SBA places certain limitations on the financing terms of investments by SBICs in portfolio companies (such as limiting the permissible interest rate on debt securities held by an SBIC in a portfolio company). Included in such limitations are SBIC regulations which allow an SBIC to exercise control over a small business for a period of seven years from the date on which the SBIC initially acquires its control position. This control period may be extended for an additional period of time with the SBA’s prior written approval.

The SBA restricts the ability of an SBIC to lend money to any of its officers, directors and employees or to invest in affiliates thereof. The SBA also prohibits, without prior SBA approval, a “change of control” of an SBIC or transfers that would result in any person (or a group of persons acting in concert) owning 10% or more of a class of equity of a licensed SBIC. A “change of control” is any event which would result in the transfer of the power, direct or indirect, to direct the management and policies of an SBIC, whether through ownership, contractual arrangements or otherwise.

The SBIC licenses allow the Funds to incur leverage by issuing SBA-guaranteed debentures, subject to the issuance of a capital commitment and certain approvals by the SBA and customary procedures. SBA-guaranteed debentures carry long-term fixed rates that are generally lower than rates on comparable bank and other debt. Under applicable regulations, an SBIC may generally have outstanding debentures guaranteed by the SBA in amounts up to twice the amount of the privately raised funds of the SBIC. Debentures guaranteed by the SBA have a maturity of ten years, require semiannual payments of interest, do not require any principal payments prior to maturity, and are not subject to prepayment penalties. As of December 31, 2020, we, through the Funds, had $309.8 million of outstanding SBA-guaranteed debentures, which had an annual weighted-average interest rate of approximately 3.4%.

SBICs must invest idle funds that are not being used to make loans in investments permitted under SBIC regulations in the following limited types of securities: (i) direct obligations of, or obligations guaranteed as to principal and interest by, the United States government, which mature within 15 months from the date of the investment; (ii) repurchase agreements with federally insured institutions with a maturity of seven days or less (and the securities underlying the repurchase obligations must be direct obligations of or guaranteed by the federal government); (iii) certificates of deposit with a maturity of one year or less, issued by a federally insured institution; (iv) a deposit account in a federally insured institution that is subject to a withdrawal restriction of one year or less; (v) a checking account in a federally insured institution; or (vi) a reasonable petty cash fund.

20


Table of Contents

SBICs are periodically examined and audited by the SBA’s staff to determine their compliance with SBIC regulations and are periodically required to file certain financial information and other documents with the SBA.

Neither the SBA nor the U.S. government or any of its agencies or officers has approved any ownership interest to be issued by us or any obligation that we or any of our subsidiaries may incur.

Securities Exchange Act of 1934 and Sarbanes-Oxley Act Compliance

We are subject to the reporting and disclosure requirements of the Securities Exchange Act of 1934 (the “Exchange Act”), including the filing of quarterly, annual and current reports, proxy statements and other required items. In addition, we are subject to the Sarbanes-Oxley Act of 2002, which imposes a wide variety of regulatory requirements on publicly-held companies and their insiders. For example:

pursuant to Rule 13a-14 of the Exchange Act, our Chief Executive Officer and Chief Financial Officer are required to certify the accuracy of the consolidated financial statements contained in our periodic reports;
pursuant to Item 307 of Regulation S-K, our periodic reports are required to disclose our conclusions about the effectiveness of our disclosure controls and procedures;
pursuant to Rule 13a-15 of the Exchange Act, our management is required to prepare a report regarding its assessment of our internal control over financial reporting, and our independent registered public accounting firm separately audits our internal control over financial reporting; and
pursuant to Item 308 of Regulation S-K and Rule 13a-15 of the Exchange Act, our periodic reports must disclose whether there were significant changes in our internal control over financial reporting or in other factors that could significantly affect these controls subsequent to the date of their evaluation, including any corrective actions with regard to significant deficiencies and material weaknesses.

The New York Stock Exchange Corporate Governance Regulations

The New York Stock Exchange (“NYSE”) has adopted corporate governance regulations that listed companies must comply with. We believe we are in compliance with such corporate governance listing standards. We intend to monitor our compliance with all future listing standards and to take all necessary actions to ensure that we stay in compliance.

Investment Adviser Regulations

The External Investment Manager, which is wholly owned by us, is subject to regulation under the Advisers Act. The Advisers Act establishes, among other things, recordkeeping and reporting requirements, disclosure requirements, limitations on transactions between the adviser’s account and an advisory client’s account, limitations on transactions between the accounts of advisory clients, and general anti-fraud prohibitions. The External Investment Manager may be examined by the SEC from time to time for compliance with the Advisers Act.

Taxation as a Regulated Investment Company

MSCC has elected to be treated for U.S. federal income tax purposes as a RIC under Subchapter M of the Code. MSCC’s taxable income includes the taxable income generated by MSCC and certain of its subsidiaries, including the Funds, which are treated as disregarded entities for tax purposes. As a RIC, we generally will not pay corporate-level U.S. federal income taxes on any income that we distribute to our stockholders as dividends. To qualify as a RIC, we must, among other things, meet certain source-of-income and asset diversification requirements (as described below). In addition, in order to obtain RIC tax treatment, we must distribute to our stockholders, for each taxable year, at least 90% of our “investment company taxable income,” which is generally our net ordinary taxable income plus the excess of realized net short-term capital gains over realized net long-term capital losses, and 90% of our tax-exempt income (the

21


Table of Contents

“Annual Distribution Requirement”). As part of maintaining RIC status, undistributed taxable income (subject to a 4% non-deductible U.S. federal excise tax) pertaining to a given fiscal year may be distributed up to 12 months subsequent to the end of that fiscal year, provided such dividends are declared on or prior to the later of (i) filing of the U.S. federal income tax return for the applicable fiscal year or (ii) the fifteenth day of the ninth month following the close of the year in which such taxable income was generated.

For any taxable year in which we qualify as a RIC and satisfy the Annual Distribution Requirement, we will not be subject to U.S. federal income tax on the portion of our income or capital gains we distribute (or are deemed to distribute) to stockholders. We will be subject to U.S. federal income tax at the regular corporate rates on any income or capital gains not distributed (or deemed distributed) to our stockholders.

We are subject to a 4% non-deductible U.S. federal excise tax on certain undistributed income unless we distribute in a timely manner an amount at least equal to the sum of (1) 98% of our net ordinary taxable income for each calendar year, (2) 98.2% of our capital gain net income for the one-year period ending December 31 in that calendar year and (3) any taxable income recognized, but not distributed, in preceding years on which we paid no U.S. federal income tax (the “Excise Tax Avoidance Requirement”). Dividends declared and paid by us in a year will generally differ from taxable income for that year as such dividends may include the distribution of current year taxable income, exclude amounts carried over into the following year, and include the distribution of prior year taxable income carried over into and distributed in the current year. For amounts we carry over into the following year, we will be required to pay the 4% U.S. federal excise tax on the excess of 98% of our annual investment company taxable income and 98.2% of our capital gain net income over our distributions for the year.

In order to qualify as a RIC for U.S. federal income tax purposes, we must, among other things:

continue to qualify as a BDC under the 1940 Act at all times during each taxable year;
derive in each taxable year at least 90% of our gross income from dividends, interest, payments with respect to certain securities, loans, gains from the sale of stock or other securities, net income from certain “qualified publicly traded partnerships,” or other income derived with respect to our business of investing in such stock or securities (the “90% Income Test”); and
diversify our holdings so that at the end of each quarter of the taxable year:
at least 50% of the value of our assets consists of cash, cash equivalents, U.S. government securities, securities of other RICs, and other securities if such other securities of any one issuer do not represent more than 5% of the value of our assets or more than 10% of the outstanding voting securities of the issuer; and
no more than 25% of the value of our assets is invested in the securities, other than U.S. government securities or securities of other RICs, (i) of one issuer, (ii) of two or more issuers that are controlled, as determined under applicable Code rules, by us and that are engaged in the same or similar or related trades or businesses or (iii) of certain “qualified publicly traded partnerships” (collectively, the “Diversification Tests”).

In order to comply with the 90% Income Test, we formed the Taxable Subsidiaries as wholly owned taxable subsidiaries for the primary purpose of permitting us to own equity interests in portfolio companies which are “pass-through” entities for tax purposes. Absent the taxable status of the Taxable Subsidiaries, a portion of the gross income from such portfolio companies would flow directly to us for purposes of the 90% Income Test. To the extent such income did not consist of income derived from securities, such as dividends and interest, it could jeopardize our ability to qualify as a RIC and, therefore, cause us to incur significant U.S. federal income taxes. The Taxable Subsidiaries are consolidated with Main Street for generally accepted accounting principles in the United States of America (“U.S. GAAP”) purposes and are included in our consolidated financial statements, and the portfolio investments held by the Taxable Subsidiaries are included in our consolidated financial statements. The Taxable Subsidiaries are not consolidated with Main Street for income tax purposes and may generate income tax expense, or benefit, as a result of

22


Table of Contents

their ownership of the portfolio investments. The income tax expense, or benefit, if any, and any related tax assets and liabilities, are reflected in our consolidated financial statements.

The External Investment Manager is accounted for as a portfolio investment for U.S. GAAP purposes and is an indirect wholly owned subsidiary of MSCC, owned through a Taxable Subsidiary. The External Investment Manager is owned by a Taxable Subsidiary in order to comply with the 90% Income Test, since the External Investment Manager’s income would likely not consist of income derived from securities, such as dividends and interest, and as result, it could jeopardize our ability to qualify as a RIC and, therefore, cause us to incur significant U.S. federal income taxes. As a result of its ownership by a Taxable Subsidiary, the External Investment Manager is a disregarded entity for tax purposes. The External Investment Manager has also entered into a tax sharing agreement with its Taxable Subsidiary owner. Since the External Investment Manager is accounted for as a portfolio investment of MSCC and is not included as a consolidated subsidiary of MSCC in MSCC’s consolidated financial statements, and as a result of the tax sharing agreement with its Taxable Subsidiary owner, for its stand-alone financial reporting purposes the External Investment Manager is treated as if it is taxed at normal corporate tax rates based on its taxable income and, as a result of its activities, may generate income tax expense or benefit. The income tax expense, or benefit, if any, and the related tax assets and liabilities, of the External Investment Manager are reflected in the External Investment Manager’s separate financial statements.

We may be required to recognize taxable income in circumstances in which we do not receive cash. For example, if we hold debt obligations that are treated under applicable tax rules as having original issue discount (such as debt instruments issued with warrants and debt securities invested in at a discount to par), we must include in income each year a portion of the original issue discount that accrues over the life of the obligation, regardless of whether cash representing such income is received by us in the same taxable year. We may also have to include in income other amounts that we have not yet received in cash such as PIK interest, cumulative dividends or amounts that are received in non-cash compensation such as warrants or stock. Because any original issue discount or other amounts accrued will be included in our investment company taxable income for the year of accrual, we may be required to make a distribution to our stockholders in order to satisfy the Annual Distribution Requirement, even though we will not have received any corresponding cash amount.

Although we do not presently expect to do so, we are authorized to borrow funds and to sell assets in order to satisfy distribution requirements. However, under the 1940 Act, we are not permitted to make distributions to our stockholders in certain circumstances while our debt obligations and other senior securities are outstanding unless certain “asset coverage” tests are met. See “Regulation — Regulation as a Business Development Company — Senior Securities.” Moreover, our ability to dispose of assets to meet our distribution requirements may be limited by (1) the illiquid nature of our portfolio and/or (2) other requirements relating to our status as a RIC, including the Diversification Tests. If we dispose of assets in order to meet the Annual Distribution Requirement or the Excise Tax Avoidance Requirement, we may make such dispositions at times that, from an investment standpoint, are not advantageous.

We may distribute taxable dividends that are payable in part in our stock. Under certain applicable provisions of the Code and the U.S. Department of the Treasury (“Treasury”) regulations, distributions payable by us in cash or in shares of stock (at the stockholders election) would satisfy the Annual Distribution Requirement. The Internal Revenue Service has issued guidance indicating that this rule will apply even where the total amount of cash that may be distributed is limited to no more than 20% of the total distribution. According to this guidance, if too many stockholders elect to receive their distributions in cash, each such stockholder would receive a pro rata share of the total cash to be distributed and would receive the remainder of their distribution in shares of stock. Taxable stockholders receiving such dividends will be required to include the full amount of the dividend (whether received in cash, our stock, or a combination thereof) as (i) ordinary income (including any qualified dividend income that, in the case of a noncorporate stockholder, may be eligible for the same reduced maximum tax rate applicable to long-term capital gains to the extent such distribution is properly reported by us as qualified dividend income and such stockholder satisfies certain minimum holding period requirements with respect to our stock) or (ii) long-term capital gain (to the extent such distribution is properly reported as a capital gain dividend), to the extent of our current and accumulated earnings and profits for U.S. federal income tax purposes. As a result, a U.S. stockholder may be required to pay tax with respect to such dividends in excess of any cash received. If a U.S. stockholder sells the stock it receives in order to pay this tax, the sales proceeds may be less than the amount included in income with respect to the dividend, depending on the market price of our stock

23


Table of Contents

at the time of the sale. Furthermore, with respect to non-U.S. stockholders, we may be required to withhold U.S. tax with respect to such dividends, including in respect of all or a portion of such dividend that is payable in stock. In addition, if a significant number of our stockholders determine to sell shares of our stock in order to pay taxes owed on dividends, it may put downward pressure on the trading price of our stock.

Failure to Qualify as a RIC

If we fail to satisfy the 90% Income Test or the Diversification Tests for any taxable year, we may nevertheless continue to qualify as a RIC for such year if certain relief provisions are applicable (which may, among other things, require us to pay certain corporate-level U.S. federal taxes or to dispose of certain assets).

If we were unable to qualify for treatment as a RIC and the foregoing relief provisions are not applicable, we would be subject to tax on all of our taxable income at regular corporate rates. We would not be able to deduct distributions to stockholders, nor would they be required to be made. If we were subject to tax on all of our taxable income at regular corporate rates, then distributions we make after being subject to such tax would be taxable to our stockholders and, provided certain holding period and other requirements were met, could qualify for treatment as “qualified dividend income” eligible for the maximum 20% rate (plus a 3.8% Medicare surtax, if applicable) applicable to qualified dividends to the extent of our current and accumulated earnings and profits. Subject to certain limitations under the Code, corporate taxpayers would be eligible for a dividends-received deduction on distributions they receive. Distributions in excess of our current and accumulated earnings and profits would be treated first as a return of capital to the extent of the stockholder’s tax basis, and any remaining distributions would be treated as a capital gain. To requalify as a RIC in a subsequent taxable year, we would be required to satisfy the RIC qualification requirements for that year and dispose of any earnings and profits from any year in which we failed to qualify as a RIC. Subject to a limited exception applicable to RICs that qualified as such under Subchapter M of the Code for at least one year prior to disqualification and that requalify as a RIC no later than the second year following the nonqualifying year, we could be subject to tax on any unrealized net built-in gains in the assets held by us during the period in which we failed to qualify as a RIC that are recognized within the subsequent five years, unless we made a special election to pay corporate-level U.S. federal income tax on such built-in gain at the time of our requalification as a RIC.

Item 1A. Risk Factors

Investing in our securities involves a number of significant risks. In addition to the other information contained in this Annual Report on Form 10-K, you should consider carefully the following information before making an investment in our securities. The risks set out below are not the only risks we face. Additional risks and uncertainties not presently known to us or not presently deemed material by us might also impair our operations and performance. If any of the following events occur, our business, financial condition and results of operations could be materially and adversely affected. In such case, our net asset value, the trading price of our common stock and the value of our other securities could decline, and you may lose all or part of your investment.

SUMMARY OF RISK FACTORS

The following is a summary of the principal risk factors associated with an investment in our securities. Further details regarding each risk included in the below summary list can be found further below.

Risks Relating to Economic Conditions

Events outside of our control, including public health crises, could negatively affect our portfolio companies and our results of operations.

Risks Relating to our Business and Structure

Our Investment Portfolio is and will continue to be recorded at fair value, with our Board of Directors having final responsibility for overseeing, reviewing and approving, in good faith, our determination of fair value and, as a result, there is and will continue to be uncertainty as to the value of our portfolio investments.
Our financial condition and results of operations depends on our ability to effectively manage and deploy capital.
We face increasing competition for investment opportunities.
We are dependent upon our key investment personnel for our future success.

24


Table of Contents

Our business model depends to a significant extent upon strong referral relationships, and our inability to maintain or develop these relationships, as well as the failure of these relationships to generate investment opportunities, could adversely affect our business.

Risks Relating to our Investment Management Activities

Our executive officers and employees, through the External Investment Manager, may manage other investment funds, including MSC Income, that operate in the same or a related line of business as we do, and may invest in such funds, which may result in significant conflicts of interest.
We, through the External Investment Manager, derive revenues from managing third party funds pursuant to management agreements that may be terminated pursuant to the terms of such agreements or requirements under the 1940 Act.

Risks Related to BDCs and SBICs

Operating under the constraints imposed on us as a BDC and RIC may hinder the achievement of our investment objectives.
Regulations governing our operation as a BDC will affect our ability to, and the way in which we, raise additional capital.
The Funds are licensed by the SBA, and therefore subject to SBIC regulations.

Risks Related to our Investments

Our investments in portfolio companies involve higher levels of risk, and we could lose all or part of our investment.
The lack of liquidity in our investments may adversely affect our business.
Our portfolio companies may incur debt that ranks equally with, or senior to, our investments in such companies.
There may be circumstances where our debt investments could be subordinated to claims of other creditors or we could be subject to lender liability claims.
Second priority liens on collateral securing loans that we make to our portfolio companies may be subject to control by senior creditors with first priority liens. If there is a default, the value of the collateral may not be sufficient to repay in full both the first priority creditors and us.
Changes relating to the LIBOR calculation process, the phase-out of LIBOR and the use of replacement rates for LIBOR may adversely affect the value of our portfolio securities.
Changes in interest rates may affect our cost of capital, net investment income and value of our investments.

Risks Related to Our Debt Financing

Because we borrow money, the potential for gain or loss on amounts invested in us is magnified and may increase the risk of investing in us.
All of our assets are subject to security interests under our secured Credit Facility or subject to a superior claim over our stockholders by the SBA and if we default on our obligations under the Credit Facility or with respect to our SBA guaranteed debentures or under the Notes, we may suffer adverse consequences, including foreclosure on our assets.

Risks Relating to our Securities

Investing in our securities may involve a high degree of risk.
Shares of closed end investment companies, including BDCs, may trade at a discount to their net asset value.
The market price of our securities may be volatile and fluctuate significantly.
Stockholders may incur dilution if we sell shares of our common stock in one or more offerings at prices below the then current net asset value per share of our common stock or issue securities to subscribe to, convert to or purchase shares of our common stock.
Provisions of the Maryland General Corporation Law and our articles of incorporation and bylaws could deter takeover attempts and have an adverse impact on the price of our common stock.
The Notes are unsecured and therefore effectively subordinated to any current or future secured indebtedness, including indebtedness under the Credit Facility.
The Notes are structurally subordinated to the indebtedness and other liabilities of our subsidiaries.
The indentures under which the Notes were issued contain limited protection for holders of the Notes.
If we default on our obligations to pay our other indebtedness, we may not be able to make payments on the Notes.

Federal Income Tax Risks

We will be subject to corporate-level U.S. federal income tax if we are unable to qualify as a RIC under Subchapter M of the Code.

25


Table of Contents

We may have difficulty paying the distributions required to maintain RIC tax treatment under the Code if we recognize income before or without receiving cash representing such income.
Because we intend to distribute substantially all of our taxable income to our stockholders to maintain our status as a RIC, we will continue to need additional capital to finance our growth, and regulations governing our operation as a BDC will affect our ability to, and the way in which we, raise additional capital and make distributions.

RISKS RELATING TO ECONOMIC CONDITIONS

Events outside of our control, including public health crises, could negatively affect our portfolio companies and our results of operations.

Periods of market volatility have occurred and could continue to occur in response to pandemics or other events outside of our control. These types of events have adversely affected, and could continue to adversely affect, operating results for us and for our portfolio companies. For example, the COVID-19 pandemic has led to, and for an unknown period of time will continue to lead to, disruptions in local, regional, national and global markets and economies affected thereby, including the United States. With respect to U.S. and global credit markets and the economy in general, this outbreak has resulted in, and until fully resolved is likely to continue to result in, the following (among other things): (i) restrictions on travel and the temporary closure of many corporate offices, retail stores and manufacturing facilities and factories, resulting in significant disruption to the business of many companies, including supply chains and demand, as well as layoffs of employees; (ii) increased draws by borrowers on revolving lines of credit; (iii) increased requests by borrowers for amendments or waivers of their credit agreements to avoid default, increased defaults by borrowers and/or increased difficulty in obtaining refinancing; (iv) volatility in credit markets, including greater volatility in pricing and spreads; and (v) evolving proposals and actions by state and federal governments to address the problems being experienced by markets, businesses and the economy in general, which may not adequately address the problems being faced. The pandemic is having, and any future continuation of the pandemic could have, an adverse impact on the markets and the economy in general.

Although it is impossible to predict the precise nature and consequences of these events, or of any political or policy decisions and regulatory changes occasioned by emerging events or uncertainty on applicable laws or regulations that impact us and our portfolio companies and investments, it is clear that these types of events are impacting and will, for at least some time, continue to impact us and our portfolio companies; in many instances the impact will be adverse and material. Any potential impact to our results of operations will depend to a large extent on future developments and new information that could emerge regarding the duration and severity of the COVID-19 pandemic and the actions taken by authorities and other entities to contain the spread or treat its impact, all of which are beyond our control. These potential impacts, while uncertain, could adversely affect our and our portfolio companies' operating results and financial condition.

The COVID-19 pandemic and the related disruption and financial distress experienced by our portfolio companies may have material adverse effects on our financial results, including investment income received from our investments and the underlying value of those investments. We may need to restructure our investments in certain portfolio companies as a result of the adverse effects of the COVID-19 pandemic, which could reduce the amount or extend the time for payment of principal or the life of our investment or reduce the amount or extend the time of payment of interest or dividends, among other things. In addition, if an investment included in the borrowing base for our multi-year revolving, secured credit facility (the “Credit Facility”) is deemed to have a material impairment or loss, or if we modify the terms of an investment included in the borrowing base for the Credit Facility, it may reduce the value of the borrowing base, which may have a material adverse effect on our available liquidity, results of operations and financial condition. In addition, any decreases in our net investment income would impact the portion of our cash flows dedicated to servicing existing borrowings under the Credit Facility, any unsecured notes or other debt we have outstanding and funding the dividends paid to our stockholders. Depending on the duration of the COVID-19 pandemic and the extent of its effects on our portfolio companies' operations and our operating results, any future dividends to our stockholders may be for amounts less than our historical dividends, may be paid less frequently than historical practices and may also include return of capital.

26


Table of Contents

The 1940 Act generally prohibits us, as a BDC, from incurring indebtedness unless immediately after such borrowing we have an asset coverage, as defined in the 1940 Act, of at least 200% (or 150% if certain requirements are met). In addition, the Credit Facility and the indentures governing our outstanding unsecured notes contain similar limitations or covenants requiring our compliance with the 1940 Act asset coverage requirements, and the Credit Facility also contains other affirmative and negative covenants. A continued significant decrease in the value of our Investment Portfolio, resulting in significant reductions of our net asset value as a result of the effects of the COVID-19 pandemic or otherwise increases the risk of us not meeting the required asset coverage requirement under the 1940 Act or breaching covenants under the Credit Facility or under the indentures governing our outstanding unsecured notes. Any such result could have a material adverse effect on our business, liquidity, financial condition, results of operations and ability to pay dividends to our stockholders and attributes thereof.

We are currently operating in a period of capital markets disruption and economic uncertainty. These conditions have historically affected and could again materially and adversely affect debt and equity capital markets in the United States, which could have a materially negative impact on our business, financial condition and results of operations.

The U.S. capital markets have experienced extreme volatility and disruption following the global outbreak of COVID-19 that began in December 2019. Some economists and major investment banks have expressed concern that the continued spread of the virus globally could lead to a world-wide economic downturn. Disruptions in the capital markets have increased the spread between the yields realized on risk-free and higher risk securities, resulting in illiquidity in parts of the capital markets. Additionally, the impact of potential downgrades by rating agencies to the U.S. government’s sovereign credit rating or its perceived creditworthiness, as well as potential government shutdowns could adversely affect the U.S. and global financial markets and economic conditions. Since 2010, several European Union, or EU, countries have faced budget issues, some of which may have negative long-term effects for the economies of those countries and other EU countries. There is concern about national-level support for the Euro and the accompanying coordination of fiscal and wage policy among European Economic and Monetary Union member countries. In addition, the fiscal policy of foreign nations, such as Russia and China, may have a severe impact on the worldwide and U.S. financial markets. The decision made in the United Kingdom referendum to leave the EU (the so-called “Brexit”) has led to volatility in global financial markets and may lead to weakening in consumer, corporate and financial confidence in the United Kingdom and Europe. While the United Kingdom commenced its withdrawal from the EU, the transition and its surrounding negotiations are ongoing, which creates uncertainty, which may lead to continued volatility. Additionally, trade wars and volatility in the U.S. repo market, the U.S. high yield bond markets, the Chinese stock markets and global markets for commodities may affect other financial markets worldwide. In addition, while recent government stimulus measures worldwide have reduced volatility in the financial markets, volatility may return as such measures are phased out, and the long-term impacts of such stimulus on fiscal policy and inflation remain unknown.

These and future market disruptions and/or illiquidity would be expected to have an adverse effect on our business, financial condition, results of operations and cash flows. Unfavorable economic conditions also would be expected to increase our funding costs, limit our access to the capital markets or result in a decision by lenders not to extend credit to us. These events could limit our investment originations, limit our ability to grow and have a material negative impact on our operating results and the fair values of our debt and equity investments. We monitor developments in economic, political and market conditions and seek to manage our investments in a manner consistent with achieving our investment objective, but there can be no assurance that we will be successful in doing so.

RISKS RELATING TO OUR BUSINESS AND STRUCTURE

Our Investment Portfolio is and will continue to be recorded at fair value, with our Board of Directors having final responsibility for overseeing, reviewing and approving, in good faith, our determination of fair value and, as a result, there is and will continue to be uncertainty as to the value of our portfolio investments.

Under the 1940 Act, we are required to carry our portfolio investments at market value or, if there is no readily available market value, at fair value as determined by us with our Board of Directors having final responsibility for overseeing, reviewing and approving, in good faith, our determination of fair value and our valuation procedures. Typically, there is not a public market for the securities of the privately held LMM or Private Loan companies in which we have invested and will generally continue to invest. As a result, we value these securities quarterly at fair value based

27


Table of Contents

on inputs from management, a nationally recognized independent financial advisory services firm (on a rotational basis) and the Audit Committee of our Board of Directors with the oversight, review and approval of our Board of Directors. In addition, the market for investments in Middle Market companies is generally not a liquid market, and therefore, we primarily use a combination of observable inputs in non-active markets for which sufficient observable inputs were not available to determine the fair value of these investments and unobservable inputs, which are reviewed by the Audit Committee with the oversight, review and approval of our Board of Directors. See “Note B.1. — Valuation of the Investment Portfolio” in the notes to consolidated financial statements for a more detailed description of our investment portfolio valuation process and procedures.

The determination of fair value and consequently, the amount of unrealized gains and losses in our portfolio, are to a certain degree, subjective and dependent on a valuation process approved by our Board of Directors. Certain factors that may be considered in determining the fair value of our investments include external events, such as private mergers, sales and acquisitions involving comparable companies. Because such valuations, and particularly valuations of securities in privately held companies, are inherently uncertain, may fluctuate over short periods of time and may be based on estimates, our determinations of fair value may differ materially from the values that would have been used if a ready market for these securities existed. Due to this uncertainty, our fair value determinations may cause our net asset value on a given date to materially understate or overstate the value that we may ultimately realize on one or more of our investments. As a result, investors purchasing our securities based on an overstated net asset value would pay a higher price than the value of our investments might warrant. Conversely, investors selling our securities during a period in which the net asset value understates the value of our investments may receive a lower price for their securities than the value of our investments might warrant.

Our financial condition and results of operations depends on our ability to effectively manage and deploy capital.

Our ability to achieve our investment objective of maximizing our portfolio’s total return by generating current income from our debt investments and capital appreciation from our equity and equity-related investments, including warrants, convertible securities and other rights to acquire equity securities in a portfolio company, depends on our ability to effectively manage and deploy capital, which depends, in turn, on our investment team’s ability to identify, evaluate and monitor, and our ability to finance and invest in, companies that meet our investment criteria.

Accomplishing our investment objective on a cost-effective basis is largely a function of our investment team’s handling of the investment process, its ability to provide competent, attentive and efficient services and our access to investments offering acceptable terms. In addition to monitoring the performance of our existing investments, members of our investment team are also called upon, from time to time, to provide managerial assistance to some of our portfolio companies. These demands on their time may distract them or slow the rate of investment.

Even if we are able to grow and build upon our investment operations, any failure to manage our growth effectively could have a material adverse effect on our business, financial condition, results of operations and prospects. The results of our operations will depend on many factors, including the availability of opportunities for investment, readily accessible short and long-term funding alternatives in the financial markets and economic conditions. Furthermore, if we cannot successfully operate our business or implement our investment policies and strategies as described herein, it could negatively impact our ability to pay dividends.

We face increasing competition for investment opportunities.

We compete for investments with other investment funds (including private equity funds, debt funds, mezzanine funds, collateralized loan obligation funds, or CLOs, BDCs and SBICs), as well as traditional financial services companies such as commercial banks and other sources of funding. Many of our competitors are substantially larger and have considerably greater financial, technical and marketing resources than we do. For example, some competitors may have a lower cost of capital and access to funding sources that are not available to us. In addition, some of our competitors may have higher risk tolerances or different risk assessments than we have. These characteristics could allow our competitors to consider a wider variety of investments, establish more relationships and offer better pricing and more flexible structuring than we are able to do. We may lose investment opportunities if we do not match our competitors’ pricing, terms and structure. If we are forced to match our competitors’ pricing, terms and structure, we may not be able to achieve acceptable returns on our investments or may bear substantial risk of capital loss. A

28


Table of Contents

significant part of our competitive advantage stems from the fact that the market for investments in LMM companies is underserved by traditional commercial banks and other financing sources. A significant increase in the number and/or the size of our competitors in this target market could force us to accept less attractive investment terms. Furthermore, many of our competitors are not subject to the regulatory restrictions that the 1940 Act imposes on us as a BDC.

We are dependent upon our key investment personnel for our future success.

We depend on the members of our investment team, particularly Dwayne L. Hyzak, David L. Magdol, Vincent D. Foster, Jesse E. Morris, K. Colton Braud, III, Damian T. Burke, Nicholas T. Meserve and Samuel A. Cashiola, for the identification, review, final selection, structuring, closing and monitoring of our investments. These employees have significant investment expertise and relationships that we rely on to implement our business plan. Although we have entered into non-compete arrangements with all of our executive officers and other key employees, we cannot guarantee that any employees will remain employed with us. If we lose the services of the individuals mentioned above, we may not be able to operate our business as we expect, and our ability to compete could be harmed, which could cause our operating results to suffer.

Our success depends on attracting and retaining qualified personnel in a competitive environment.

Our growth will require that we retain new investment and administrative personnel in a competitive market. Our ability to attract and retain personnel with the requisite credentials, experience and skills depends on several factors including, but not limited to, our ability to offer competitive wages, benefits and professional growth opportunities. Many of the entities, including investment funds (such as private equity funds, debt funds and mezzanine funds) and traditional financial services companies, with which we compete for experienced personnel have greater resources than we have.

The competitive environment for qualified personnel may require us to take certain measures to ensure that we are able to attract and retain experienced personnel. Such measures may include increasing the attractiveness of our overall compensation packages, altering the structure of our compensation packages through the use of additional forms of compensation, or other steps. The inability to attract and retain experienced personnel would have a material adverse effect on our business.

Our business model depends to a significant extent upon strong referral relationships, and our inability to maintain or develop these relationships, as well as the failure of these relationships to generate investment opportunities, could adversely affect our business.

We expect that members of our management team will maintain their relationships with intermediaries, financial institutions, investment bankers, commercial bankers, financial advisors, attorneys, accountants, consultants and other individuals within our network, and we will rely to a significant extent upon these relationships to provide us with potential investment opportunities. If our management team fails to maintain its existing relationships or develop new relationships with sources of investment opportunities, we will not be able to grow our Investment Portfolio. In addition, individuals with whom members of our management team have relationships are not obligated to provide us with investment opportunities, and, therefore, there is no assurance that such relationships will generate investment opportunities for us.

We may be unable to invest a significant portion of the net proceeds from an offering or from exiting an investment or other capital on acceptable terms, which could harm our financial condition and operating results.

Delays in investing the net proceeds raised in an offering or other capital raised or proceeds resulting from exiting an investment may cause our performance to be worse than that of other fully invested BDCs or other lenders or investors pursuing comparable investment strategies. We cannot assure you that we will be able to identify any investments that meet our investment objective or that any investment that we make will produce a positive return. We may be unable to invest the net proceeds of any offering or other capital raised or proceeds resulting from exiting an investment on acceptable terms within the time period that we anticipate or at all, which could harm our financial condition and operating results.

29


Table of Contents

We anticipate that, depending on market conditions and the amount of the capital, it may take us a substantial period of time to invest substantially all the capital in securities meeting our investment objective. During this period, we may invest the capital primarily in marketable securities and idle funds investments, which generally consist of debt investments, independently rated debt investments, certificates of deposit with financial institutions, diversified bond funds and publicly traded debt and equity investments and may produce returns that are significantly lower than the returns which we expect to achieve when our portfolio is fully invested in securities meeting our investment objective. Most of the debt investments that meet our investment criteria are, or would be if rated, below investment grade quality. Indebtedness of below investment grade quality, which is often referred to as “junk,” is regarded as having predominantly speculative characteristics with respect to the issuer’s capacity to pay interest and repay principal. As a result, any distributions that we pay during such period may be substantially lower than the distributions that we may be able to pay when our portfolio is fully invested in securities meeting our investment objective. In addition, until such time as the net proceeds of any offering or from exiting an investment or other capital are invested in new securities meeting our investment objective, the market price for our securities may decline. Thus, the initial return on your investment may be lower than when, if ever, our portfolio is fully invested in securities meeting our investment objective.

Our Board of Directors may change our operating policies and strategies without prior notice or stockholder approval, the effects of which may be adverse.

Our Board of Directors has the authority to modify or waive our current operating policies, investment criteria and strategies without prior notice and without stockholder approval. We cannot predict the effect any changes to our current operating policies, investment criteria and strategies would have on our business, net asset value, operating results and value of our stock. However, the effects might be adverse, which could negatively impact our ability to pay interest and principal payments to holders of our debt instruments and dividends to our stockholders and cause our investors to lose all or part of their investment in us.

We may not be able to pay distributions to our stockholders, our distributions may not grow over time, and a portion of distributions paid to our stockholders may be a return of capital, which is a distribution of the stockholders’ invested capital.

We intend to pay distributions to our stockholders out of assets legally available for distribution. We cannot assure you that we will achieve investment results that will allow us to pay a specified level of cash distributions, previously projected distributions for future periods, or year-to-year increases in cash distributions. Our ability to pay distributions might be adversely affected by, among other things, the impact of one or more of the risk factors described herein. In addition, the inability to satisfy the asset coverage test applicable to us as a BDC could limit our ability to pay distributions. All distributions will be paid at the discretion of our Board of Directors and will depend on our earnings, our financial condition, maintenance of our RIC status, compliance with applicable BDC regulations, compliance with our debt covenants, each of the Funds’ compliance with applicable SBIC regulations and such other factors as our Board of Directors may deem relevant from time to time. We cannot assure you that we will pay distributions to our stockholders in the future.

When we make distributions, we will be required to determine the extent to which such distributions are paid out of current or accumulated taxable earnings, recognized capital gains or capital. To the extent there is a return of capital, investors will be required to reduce their basis in our stock for U.S. federal income tax purposes, which may result in higher tax liability when the shares are sold, even if they have not increased in value or have lost value. In addition, any return of capital will be net of any sales load and offering expenses associated with sales of shares of our common stock. In the future, our distributions may include a return of capital.

We are subject to risks related to corporate social responsibility.

Our business faces increasing public scrutiny related to environmental, social and governance (“ESG”) activities. We risk damage to our brand and reputation if we fail to act responsibly in a number of areas, such as diversity and inclusion, environmental stewardship, support for local communities, corporate governance and transparency and considering ESG factors in our investment processes. Adverse incidents with respect to ESG activities could impact the

30


Table of Contents

value of our brand, the cost of our operations and relationships with investors, all of which could adversely affect our business and results of operations. Additionally, new regulatory initiatives related to ESG could adversely affect our business.

RISKS RELATED TO OUR INVESTMENT MANAGEMENT ACTIVITIES

Our executive officers and employees, through the External Investment Manager, may manage other investment funds, including MSC Income, that operate in the same or a related line of business as we do, and may invest in such funds, which may result in significant conflicts of interest.

Our executive officers and employees, through the External Investment Manager, may manage other investment funds that operate in the same or a related line of business as we do, and which funds may be invested in by us and/or our executive officers and employees, including the Private Loan Fund. Accordingly, they may have obligations to, or pecuniary interests in, such other entities, and the fulfillment of such obligations may not be in the best interests of us or our stockholders and may create conflicts of interest. During May 2012, we entered into an investment sub-advisory agreement with HMS Adviser, to provide certain investment advisory services to HMS Adviser in connection with its role as investment adviser to MSC Income (then HMS Income Fund, Inc.) in exchange for 50% of the 2.0% base management fee and 20% incentive fee earned by HMS Adviser. In December 2013, after obtaining required no-action relief from the SEC to allow us to own a registered investment adviser, we assigned the sub-advisory agreement to the External Investment Manager since the fees received from such arrangement could otherwise have negative consequences on our ability to meet the source-of-income requirement necessary for us to maintain our RIC tax treatment. On October 30, 2020, after successfully receiving the required approval of the stockholders of MSC Income, we completed a transaction whereby the External Investment Manager became the sole investment adviser and administrator to MSC Income pursuant to the Advisory Agreement. Under the Advisory Agreement, the External Investment Manager earns a 1.75% base management fee and a 20% incentive fee in exchange for providing investment advisory services to MSC Income.

The investment advisory relationship requires us to commit resources to achieving MSC Income’s investment objective, while such resources would otherwise be solely devoted to achieving our investment objective. Our investment objective and investment strategies are very similar to those of MSC Income and it is likely that an investment appropriate for us or MSC Income would be appropriate for the other entity. As a result, we and MSC Income requested an exemptive order from the SEC permitting co-investments by us and MSC Income in certain negotiated transactions where our co-investing would otherwise be prohibited under the 1940 Act. The SEC granted the exemptive order in April 2014, and in December 2020, we received an amended exemptive order from the SEC permitting co-investments by us, MSC Income and other funds advised by the External Investment Manager in certain negotiated transactions where co-investing would otherwise be prohibited under the 1940 Act. We have made co-investments with MSC Income and in the future intend to make co-investments with MSC Income, the Private Loan Fund and other funds advised by the External Investment Manager in accordance with the conditions of the order. The order requires, among other things, that we and the External Investment Manager consider whether each such investment opportunity is appropriate for us and the External Investment Manager’s advised clients, including MSC Income, as applicable, and if it is appropriate, to propose an allocation of the investment opportunity between such parties. As a consequence, it may be more difficult for us to maintain or increase the size of our Investment Portfolio in the future. Although we will endeavor to allocate investment opportunities in a fair and equitable manner, including in accordance with the conditions set forth in the exemptive order issued by the SEC when relying on such order, we may face conflicts in allocating investment opportunities between us and other funds and accounts managed by the External Investment Manager, including MSC Income and the Private Loan Fund. Because the External Investment Manager may receive performance-based fee compensation from MSC Income and any other funds and accounts it manages, this may provide the Company and the External Investment Manager an incentive to allocate opportunities to MSC Income and any other funds and accounts the External Invesment Manager manages, including the Priate Loan Fund, instead of us. We and the External Investment Manager have implemented an allocation policy to ensure the equitable distribution of investment opportunities and, as a result, may be unable to participate in certain investments based upon such allocation policy.

31


Table of Contents

We, through the External Investment Manager, derive revenues from managing third-party funds pursuant to management agreements that may be terminated pursuant to the terms of such agreements or requirements under the 1940 Act.

The External Investment Manager earns management fees based on the assets of the funds under management and may earn incentive fees, or a carried interest, based on the performance of the funds managed, including MSC Income and the Private Loan Fund. The terms of fund investment management agreements generally give the manager of the fund and the fund itself the right to terminate the management agreement in certain circumstances. With respect to funds that are not exempt from regulation under the 1940 Act, the fund’s investment management agreement must be approved annually by (a) such fund’s board of directors or by the vote of a majority of such fund’s stockholders and (b) the majority of the independent members of such fund’s board of directors and, in certain cases, by its stockholders, as required by law. The funds’ investment management agreements can also be terminated by the majority of such fund’s stockholders. Termination of any such management agreements would reduce the fees we earn from the relevant funds through the External Investment Manager, which could have a material adverse effect on our results of operations. Currently, MSC Income, an investment company that has elected to be regulated as a BDC under the 1940 Act, is subject to these provisions of the 1940 Act.

RISKS RELATED TO BDCs and SBICs

Failure to comply with applicable laws or regulations and changes in laws or regulations governing our operations may adversely affect our business or cause us to alter our business strategy.

We, the Funds, and our portfolio companies are subject to applicable local, state and federal laws and regulations. Failure to comply with any applicable local, state or federal law or regulation could negatively impact our reputation and our business results. New legislation may also be enacted or new interpretations, rulings or regulations could be adopted, including those governing the types of investments we are permitted to make, any of which could harm us and our stockholders, potentially with retroactive effect. In addition, any change to the SBA’s current debenture SBIC program could have a significant impact on our ability to obtain lower-cost leverage through the Funds, and therefore, our ability to compete with other finance companies.

Additionally, any changes to the laws and regulations governing our operations relating to permitted investments may cause us to alter our investment strategy in order to avail ourselves of new or different opportunities. Such changes could result in material differences to the strategies and plans set forth herein and may result in our investment focus shifting from the areas of expertise of our investment team to other types of investments in which our investment team may have less expertise or little or no experience. Thus, any such changes, if they occur, could have a material adverse effect on our results of operations and the value of your investment.

Failure to maintain our status as a BDC would reduce our operating flexibility.

If we do not remain a BDC, we might be regulated as a closed-end investment company under the 1940 Act, which would subject us to substantially more regulatory restrictions under the 1940 Act and correspondingly decrease our operating flexibility.

Operating under the constraints imposed on us as a BDC and RIC may hinder the achievement of our investment objectives.

The 1940 Act and the Code impose numerous constraints on the operations of BDCs and RICs that do not apply to certain of the other investment vehicles managed by the External Investment Manager. BDCs are required, for example, to invest at least 70% of their total assets in certain qualifying assets, including U.S. private or thinly-traded public companies, cash, cash equivalents, U.S. government securities and other high-quality debt instruments that mature in one year or less from the date of investment. Moreover, qualification for taxation as a RIC requires satisfaction of source-of-income, asset diversification and distribution requirements. Operating under these constraints may hinder our ability to take advantage of attractive investment opportunities and to achieve our investment objective. Any failure to do so could subject us to enforcement action by the SEC, cause us to fail to satisfy the requirements associated with RIC

32


Table of Contents

status and subject us to entity-level corporate income taxation, cause us to fail the 70% test described above or otherwise have a material adverse effect on our business, financial condition or results of operations.

Regulations governing our operation as a BDC will affect our ability to, and the way in which we, raise additional capital.

Our business will require capital to operate and grow. We may acquire such additional capital from the following sources:

Senior Securities. We may issue debt securities or preferred stock and/or borrow money from banks or other financial institutions, which we refer to collectively as senior securities. As a result of issuing senior securities, we will be exposed to additional risks, including the following:

Under the provisions of the 1940 Act, we are permitted, as a BDC, to issue senior securities only in amounts such that our asset coverage, as defined in the 1940 Act, equals at least 200% (or 150% if certain requirements are met) immediately after each issuance of senior securities. We have received exemptive relief from the SEC to permit us to exclude the SBA-guaranteed debentures of the Funds from our asset coverage test under the 1940 Act. If the value of our assets declines, we may be unable to satisfy this test. If that happens, we will be prohibited from issuing debt securities or preferred stock and/or borrowing money from banks or other financial institutions and may not be permitted to declare a dividend or make any distribution to stockholders or repurchase shares until such time as we satisfy this test.
Any amounts that we use to service our debt or make payments on preferred stock will not be available for dividends to our common stockholders.
It is likely that any senior securities or other indebtedness we issue will be governed by an indenture or other instrument containing covenants restricting our operating flexibility. Additionally, some of these securities or other indebtedness may be rated by rating agencies, and in obtaining a rating for such securities and other indebtedness, we may be required to abide by operating and investment guidelines that further restrict operating and financial flexibility.
We and, indirectly, our stockholders will bear the cost of issuing and servicing such securities and other indebtedness.
Preferred stock or any convertible or exchangeable securities that we issue in the future may have rights, preferences and privileges more favorable than those of our common stock, including separate voting rights and could delay or prevent a transaction or a change in control to the detriment of the holders of our common stock.
Any unsecured debt issued by us would generally rank (i) pari passu with our current and future unsecured indebtedness and effectively subordinated to all of our existing and future secured indebtedness, to the extent of the value of the assets securing such indebtedness, and (ii) structurally subordinated to all existing and future indebtedness and other obligations of any of our subsidiaries, including the SBA-guaranteed debentures issued by the Funds.

Additional Common Stock. The 1940 Act prohibits us from selling shares of our common stock at a price below the current net asset value per share of such stock, with certain exceptions. One such exception is prior stockholder approval of issuances below current net asset value per share provided that our Board of Directors makes certain determinations. We did not seek stockholder authorization to sell shares of our common stock below the then current net asset value per share of our common stock at our 2020 annual meeting of stockholders because our common stock price had been trading significantly above the net asset value per share of our common stock since 2011. We may, however, sell our common stock, warrants, options or rights to acquire our common stock, at a price below the current net asset value of the common stock if our Board of Directors determines that such sale is in the best interests of our stockholders, and our stockholders approve such sale. See “Risk Factors – Risks Relating to our Securities — Stockholders may incur dilution if

33


Table of Contents

we sell shares of our common stock in one or more offerings at prices below the then current net asset value per share of our common stock or issue securities to subscribe to, convert to or purchase shares of our common stock” for a discussion of the risks related to us issuing shares of our common stock below net asset value. Our stockholders have authorized us to issue warrants, options or rights to subscribe for, convert to, or purchase shares of our common stock at a price per share below the net asset value per share, subject to the applicable requirements of the 1940 Act. There is no expiration date on our ability to issue such warrants, options, rights or convertible securities based on this stockholder approval. If we raise additional funds by issuing more common stock or senior securities convertible into, or exchangeable for, our common stock, the percentage ownership of our stockholders at that time would decrease, and they may experience dilution. Moreover, we can offer no assurance that we will be able to issue and sell additional equity securities in the future, on favorable terms or at all.

Previously enacted legislation may allow us to incur additional leverage.

The 1940 Act generally prohibits us from incurring indebtedness unless immediately after such borrowing we have an asset coverage for total borrowings of at least 200% (i.e., the amount of debt may not exceed 50% of the value of our assets). However, legislation passed in March 2018 modified the 1940 Act by allowing a BDC to increase the maximum amount of leverage it may incur by lowering the required asset coverage ratio of 200% to an asset coverage ratio of 150% (i.e., the amount of debt may not exceed 662/3% of the value of our assets), if certain requirements are met. Under the legislation, we are allowed to increase our leverage capacity if stockholders representing at least a majority of the votes cast, when a quorum is met, approve a proposal to do so. If we receive stockholder approval, we would be allowed to increase our leverage capacity on the first day after such approval. Alternatively, the legislation allows a “required majority” (as defined in Section 57(o) of the 1940 Act) of the members of our Board of Directors to approve an increase in our leverage capacity, and such approval would become effective after one year from the date of approval. In either case, we would be required to make certain disclosures on our website and in SEC filings regarding, among other things, the receipt of approval to increase our leverage, our leverage capacity and usage, and risks related to leverage. As a result of this legislation, we may be able to increase our leverage up to an amount that reduces our asset coverage ratio from 200% to 150%. See “Risk Factors — Risks Relating to Our Debt Financing — Because we borrow money, the potential for gain or loss on amounts invested in us is magnified and may increase the risk of investing in us” for a discussion of the risks associated with leverage.

The Funds are licensed by the SBA, and therefore subject to SBIC regulations.

The Funds, our wholly owned subsidiaries, are licensed to act as SBICs and are regulated by the SBA. The SBA also places certain limitations on the financing terms of investments by SBICs in portfolio companies and prohibits SBICs from providing funds for certain purposes or to businesses in a few prohibited industries. Compliance with SBA requirements may cause the Funds to forego attractive investment opportunities that are not permitted under SBIC regulations.

Further, the SBIC regulations require, among other things, that a licensed SBIC be periodically examined by the SBA and audited by an independent auditor, in each case to determine the SBIC’s compliance with the relevant SBIC regulations. The SBA prohibits, without prior SBA approval, a “change of control” of an SBIC or transfers that would result in any person (or a group of persons acting in concert) owning 10% or more of a class of capital stock of a licensed SBIC. If the Funds fail to comply with applicable SBIC regulations, the SBA could, depending on the severity of the violation, limit or prohibit their use of SBIC debentures, declare outstanding SBIC debentures immediately due and payable, and/or limit them from making new investments. In addition, the SBA can revoke or suspend a license for willful or repeated violation of, or willful or repeated failure to observe, any provision of the Small Business Investment Act of 1958 or any rule or regulation promulgated thereunder. Such actions by the SBA would, in turn, negatively affect us.

34


Table of Contents

RISKS RELATED TO OUR INVESTMENTS

Our investments in portfolio companies involve higher levels of risk, and we could lose all or part of our investment.

Investing in our portfolio companies exposes us indirectly to a number of significant risks. Among other things, these companies:

may have limited financial resources and may be unable to meet their obligations under their debt instruments that we hold, which may be accompanied by a deterioration in the value of any collateral and a reduction in the likelihood of us realizing any guarantees from subsidiaries or affiliates of our portfolio companies that we may have obtained in connection with our investment, as well as a corresponding decrease in the value of the equity components of our investments;
may have shorter operating histories, narrower product lines, smaller market shares and/or significant customer concentrations than larger businesses, which tend to render them more vulnerable to competitors’ actions and market conditions, as well as general economic downturns;
are more likely to depend on the management talents and efforts of a small group of persons; therefore, the death, disability, resignation, termination or significant under-performance of one or more of these persons could have a material adverse impact on our portfolio company and, in turn, on us;
generally have less predictable operating results, may from time to time be parties to litigation, may be engaged in rapidly changing businesses with products subject to a substantial risk of obsolescence, and may require substantial additional capital to support their operations, finance expansion or maintain their competitive position; and
generally have less publicly available information about their businesses, operations and financial condition. We are required to rely on the ability of our management team and investment professionals to obtain adequate information to evaluate the potential returns from investing in these companies. If we are unable to uncover all material information about these companies, we may not make a fully informed investment decision, and may lose all or part of our investment.

In addition, in the course of providing significant managerial assistance to certain of our portfolio companies, certain of our officers and directors may serve as directors on the boards of such companies. To the extent that litigation arises out of our investments in these companies, our officers and directors may be named as defendants in such litigation, which could result in an expenditure of funds (through our indemnification of such officers and directors) and the diversion of management time and resources.

We may be exposed to higher risks with respect to our investments that include original issue discount or PIK interest.

Our investments may include original issue discount and contractual PIK interest, which represents contractual interest added to a loan balance and due at the end of such loan’s term. To the extent original issue discount or PIK interest constitute a portion of our income, we are exposed to typical risks associated with such income being required to be included in taxable and accounting income prior to receipt of cash, including the following:

original issue discount and PIK instruments may have higher yields, which reflect the payment deferral and credit risk associated with these instruments;
for accounting purposes, cash distributions to investors representing original issue discount income are not derived from paid in capital, although they may be effectively paid from any offering proceeds during any given period; thus, although the source for the cash used to pay a distribution of original issue discount income may come from the cash invested by investors, the 1940 Act does not require that investors be given notice of this fact;

35


Table of Contents

original issue discount and PIK instruments may have unreliable valuations because their continuing accruals require continuing judgments about the collectability of the deferred payments and the value of the collateral; and
original issue discount and PIK instruments may represent a higher credit risk than coupon loans; even if the conditions for income accrual under generally accepted accounting principles in the United States of America are satisfied, a borrower could still default when actual payment is due upon the maturity of such loan.

The lack of liquidity in our investments may adversely affect our business.

We generally invest in companies whose securities are not publicly traded, and whose securities will be subject to legal and other restrictions on resale or will otherwise be less liquid than publicly traded securities. The illiquidity of these investments may make it difficult for us to sell these investments when desired. In addition, if we are required to liquidate all or a portion of our portfolio quickly, we may realize significantly less than the value at which we had previously recorded these investments. As a result, we do not expect to achieve liquidity in our investments in the near-term. Our investments are usually subject to contractual or legal restrictions on resale or are otherwise illiquid because there is usually no established trading market for such investments. The illiquidity of most of our investments may make it difficult for us to dispose of them at a favorable price, and, as a result, we may suffer losses.

We may not have the funds or ability to make additional investments in our portfolio companies.

We may not have the funds or ability to make additional investments in our portfolio companies. After our initial investment in a portfolio company, we may be called upon from time to time to provide additional funds to such company or have the opportunity to increase our investment through the extension of additional loans, the exercise of a warrant to purchase equity securities, or the funding of additional equity investments. There is no assurance that we will make, or will have sufficient funds to make, follow-on investments. Any decisions not to make a follow-on investment or any inability on our part to make such an investment may have a negative impact on a portfolio company in need of such an investment, may result in a missed opportunity for us to increase our participation in a successful operation, may reduce our ability to protect an existing investment or may reduce the expected yield on the investment.

Our portfolio companies may incur debt that ranks equally with, or senior to, our investments in such companies.

We invest primarily in the secured term debt of LMM, Private Loan and Middle Market companies and equity issued by LMM companies. Our portfolio companies may have, or may be permitted to incur, other debt that ranks equally with, or senior to, the debt in which we invest. By their terms, such debt instruments may entitle the holders to receive payment of interest or principal on or before the dates on which we are entitled to receive payments with respect to the debt instruments in which we invest. Also, in the event of insolvency, liquidation, dissolution, reorganization or bankruptcy of a portfolio company, holders of debt instruments ranking senior to our investment in that portfolio company would typically be entitled to receive payment in full before we receive any distribution. After repaying such senior creditors, such portfolio company may not have any remaining assets to use for repaying its obligation to us. In the case of debt ranking equally with debt instruments in which we invest, we would have to share on an equal basis any distributions with other creditors holding such debt in the event of an insolvency, liquidation, dissolution, reorganization or bankruptcy of the relevant portfolio company.

There may be circumstances where our debt investments could be subordinated to claims of other creditors or we could be subject to lender liability claims.

Even though we may have structured certain of our investments as secured loans, if one of our portfolio companies were to go bankrupt, depending on the facts and circumstances, and based upon principles of equitable subordination as defined by existing case law, a bankruptcy court could subordinate all or a portion of our claim to that of other creditors and transfer any lien securing such subordinated claim to the bankruptcy estate. The principles of equitable subordination defined by case law have generally indicated that a claim may be subordinated only if its holder is guilty of misconduct or where the senior loan is re-characterized as an equity investment and the senior lender has

36


Table of Contents

actually provided significant managerial assistance to the bankrupt debtor. We may also be subject to lender liability claims for actions taken by us with respect to a borrower’s business or instances where we exercise control over the borrower. It is possible that we could become subject to a lender liability claim, including as a result of actions taken in rendering significant managerial assistance or actions to compel and collect payments from the borrower outside the ordinary course of business.

Second priority liens on collateral securing loans that we make to our portfolio companies may be subject to control by senior creditors with first priority liens. If there is a default, the value of the collateral may not be sufficient to repay in full both the first priority creditors and us.

Certain loans that we make are secured by a second priority security interest in the same collateral pledged by a portfolio company to secure senior debt owed by the portfolio company to commercial banks or other traditional lenders. Often the senior lender has procured covenants from the portfolio company prohibiting the incurrence of additional secured debt without the senior lender’s consent. Prior to and as a condition of permitting the portfolio company to borrow money from us secured by the same collateral pledged to the senior lender, the senior lender will require assurances that it will control the disposition of any collateral in the event of bankruptcy or other default. In many such cases, the senior lender will require us to enter into an “intercreditor agreement” prior to permitting the portfolio company to borrow from us. Typically the intercreditor agreements we are requested to execute expressly subordinate our debt instruments to those held by the senior lender and further provide that the senior lender shall control: (1) the commencement of foreclosure or other proceedings to liquidate and collect on the collateral; (2) the nature, timing and conduct of foreclosure or other collection proceedings; (3) the amendment of any collateral document; (4) the release of the security interests in respect of any collateral; and (5) the waiver of defaults under any security agreement. Because of the control we may cede to senior lenders under intercreditor agreements we may enter, we may be unable to realize the proceeds of any collateral securing some of our loans.

Finally, the value of the collateral securing our debt investment will ultimately depend on market and economic conditions, the availability of buyers and other factors. Therefore, there can be no assurance that the proceeds, if any, from the sale or sales of all of the collateral would be sufficient to satisfy the loan obligations secured by our first or second priority liens. There is also a risk that such collateral securing our investments will decrease in value over time, will be difficult to sell in a timely manner, will be difficult to appraise and will fluctuate in value based upon the success of the portfolio company and market conditions. If such proceeds are not sufficient to repay amounts outstanding under the loan obligations secured by our second priority liens, then we, to the extent not repaid from the proceeds of the sale of the collateral, will only have an unsecured claim against the company’s remaining assets, if any.

We are a non-diversified investment company within the meaning of the 1940 Act, and therefore we are not limited with respect to the proportion of our assets that may be invested in securities of a single issuer.

We are classified as a non-diversified investment company within the meaning of the 1940 Act, which means that we are not limited by the 1940 Act with respect to the proportion of our assets that we may invest in securities of a single issuer. Under the 1940 Act, a “diversified” investment company is required to invest at least 75% of the value of its total assets in cash and cash items, government securities, securities of other investment companies and other securities limited in respect of any one issuer to an amount not greater than 5% of the value of the total assets of such company and no more than 10% of the outstanding voting securities of such issuer. As a non-diversified investment company, we are not subject to this requirement. To the extent that we assume large positions in the securities of a small number of issuers, our net asset value may fluctuate to a greater extent than that of a diversified investment company as a result of changes in the financial condition or the market’s assessment of the issuer. We may also be more susceptible to any single economic or regulatory occurrence than a diversified investment company. Beyond our RIC asset diversification requirements, we do not have fixed guidelines for diversification, and our investments could be concentrated in relatively few portfolio companies. See “Risk Factors — Federal Income Tax Risks — We will be subject to corporate-level U.S. federal income tax if we are unable to qualify as a RIC under Subchapter M of the Code.”

37


Table of Contents

We generally will not control our portfolio companies.

We do not, and do not expect to, control the decision making in many of our portfolio companies, even though we may have board representation or board observation rights, and our debt agreements may contain certain restrictive covenants. As a result, we are subject to the risk that a portfolio company in which we invest will make business decisions with which we disagree and the management of such company will take risks or otherwise act in ways that do not serve our interests as debt investors or minority equity holders. Due to the lack of liquidity for our investments in non-traded companies, we may not be able to dispose of our interests in our portfolio companies as readily as we would like or at an appropriate valuation. As a result, a portfolio company may make decisions that would decrease the value of our portfolio holdings.

Defaults by our portfolio companies will harm our operating results.

A portfolio company’s failure to satisfy financial or operating covenants imposed by us or other lenders could lead to non-payment of interest and other defaults and, potentially, termination of its loans and foreclosure on its secured assets, which could trigger cross-defaults under other agreements and jeopardize a portfolio company’s ability to meet its obligations under the debt or equity securities that we hold. We may incur expenses to the extent necessary to seek recovery upon default or to negotiate new terms, which may include the waiver of certain financial covenants, with a defaulting portfolio company.

Any unrealized depreciation we experience in our portfolio may be an indication of future realized losses, which could reduce our income and gains available for distribution.

As a BDC, we are required to carry our investments at market value or, if no market value is ascertainable, at the fair value as determined in good faith by our Board of Directors. Decreases in the market values or fair values of our investments will be recorded as unrealized depreciation. Any unrealized depreciation in our portfolio could be an indication of a portfolio company’s inability to meet its repayment obligations to us with respect to affected loans or a potential impairment of the value of affected equity investments. This could result in realized losses in the future and ultimately in reductions of our income and gains available for distribution in future periods.

Prepayments of our debt investments by our portfolio companies could adversely impact our results of operations and reduce our return on equity.

We are subject to the risk that the investments we make in our portfolio companies may be repaid prior to maturity. When this occurs, we will generally reinvest these proceeds in temporary investments, pending their future investment in new portfolio companies. These temporary investments will typically have substantially lower yields than the debt being prepaid and we could experience significant delays in reinvesting these amounts. Any future investment in a new portfolio company may also be at lower yields than the debt that was repaid. As a result, our results of operations could be materially adversely affected if one or more of our portfolio companies elect to prepay amounts owed to us. Additionally, prepayments could negatively impact our return on equity, which could result in a decline in the market price of our securities.

Changes relating to the LIBOR calculation process, the phase-out of LIBOR and the use of replacement rates for LIBOR may adversely affect the value of our portfolio securities.

LIBOR is the basic rate of interest used in lending transactions between banks on the London interbank market and is widely used as a reference for setting the interest rate on loans globally. We typically use LIBOR as a reference rate in floating rate loans we extend to portfolio companies such that the interest due to us pursuant to a term loan extended to a portfolio company is calculated using LIBOR and we use LIBOR as a reference rate in connection with our Credit Facility. The terms of our debt investments generally include minimum interest rate floors which are calculated based on LIBOR.

In July 2017, the United Kingdom’s Financial Conduct Authority, which regulates LIBOR, announced that it intends to phase out LIBOR by the end of 2021. Although, on November 30, 2020, Intercontinental Exchange, Inc.

38


Table of Contents

(“ICE”) announced that it will consider extending the LIBOR transition deadline to June 30, 2023, U.S. regulators continue to urge financial institutions to stop entering into new LIBOR transactions by the end of 2021. As such, the potential effect of a LIBOR phase out on our net investment income cannot yet be determined. The U.S. Federal Reserve, in conjunction with the Alternative Reference Rates Committee, a steering committee comprised of large U.S. financial institutions, has identified the Secured Overnight Financing Rate (“SOFR”) as its preferred alternative rate for LIBOR. SOFR is a measure of the cost of borrowing cash overnight, collateralized by U.S. Treasury securities, and is based on directly observable U.S. Treasury-based repurchase transactions. Although SOFR appears to be the preferred replacement rate for U.S. dollar LIBOR, at this time, it is not possible to predict whether SOFR will attain market traction as a LIBOR replacement tool or the effect of any such changes as the establishment of alternative reference rates or other reforms to LIBOR may be enacted in the United States, United Kingdom or elsewhere. If LIBOR ceases to exist, we may need to renegotiate the credit agreements with our portfolio companies that utilize LIBOR as a factor in determining the interest rate to replace LIBOR with the new standard that is established, which may have an adverse effect on our overall financial condition or results of operations. In addition, any further changes or reforms to the determination or supervision of LIBOR may result in a sudden or prolonged increase or decrease in reported LIBOR, which could have an adverse impact on the market value for or value of any LIBOR-linked securities, loans and other financial obligations or extensions of credit held by or due to us and could have a material adverse effect on our business, financial condition, tax position and results of operations.

Changes in interest rates may affect our cost of capital, net investment income and value of our investments.

Some of our debt investments will bear interest at variable rates and may be negatively affected by changes in market interest rates. An increase in market interest rates would increase the interest costs and reduce the cash flows of our portfolio companies that have variable rate debt instruments, a situation which could reduce the value of the investment. The value of our securities could also be reduced from an increase in market interest rates as rates available to investors could make an investment in our securities less attractive than alternative investments. In addition, an increase in interest rates would make it more expensive for us to use debt to finance our investments. As a result, a significant increase in market interest rates could increase our cost of capital, which would reduce our net investment income. Conversely, decreases in market interest rates could negatively impact the interest income from our variable rate debt investments. A decrease in market interest rates may also have an adverse impact on our returns by requiring us to accept lower yields on our debt investments and by increasing the risk that our portfolio companies will prepay our debt investments, resulting in the need to redeploy capital at potentially lower rates. See further discussion and analysis at “Item 7A. Quantitative and Qualitative Disclosures about Market Risk”.

We may not realize gains from our equity investments.

Certain investments that we have made in the past and may make in the future include warrants or other equity securities. Investments in equity securities involve a number of significant risks, including the risk of further dilution as a result of additional issuances, inability to access additional capital and failure to pay current distributions. Investments in preferred securities involve special risks, such as the risk of deferred distributions, credit risk, illiquidity and limited voting rights. In addition, we may from time to time make non-control, equity investments in portfolio companies. Our goal is ultimately to realize gains upon our disposition of such equity interests. However, the equity interests we receive may not appreciate in value and, in fact, may decline in value. Accordingly, we may not be able to realize gains from our equity interests, and any gains that we do realize on the disposition of any equity interests may not be sufficient to offset any other losses we experience. We also may be unable to realize any value if a portfolio company does not have a liquidity event, such as a sale of the business, recapitalization or public offering, which would allow us to sell the underlying equity interests. We often seek puts or similar rights to give us the right to sell our equity securities back to the portfolio company issuer; however, we may be unable to exercise these put rights for the consideration provided in our investment documents if the issuer is in financial distress.

Our investments in foreign securities may involve significant risks in addition to the risks inherent in U.S. investments.

Our investment strategy contemplates potential investments in debt securities of foreign companies. Investing in foreign companies may expose us to additional risks not typically associated with investing in securities of U.S.

39


Table of Contents

companies. These risks include changes in exchange control regulations, political and social instability, expropriation, imposition of foreign taxes, less liquid markets and less available information than is generally the case in the U.S., higher transaction costs, less government supervision of exchanges, brokers and issuers, less developed bankruptcy laws, difficulty in enforcing contractual obligations, lack of uniform accounting and auditing standards and greater price volatility.

Although most of our investments will be U.S. dollar denominated, any investments denominated in a foreign currency will be subject to the risk that the value of a particular currency will change in relation to one or more other currencies. Among the factors that may affect currency values are trade balances, the level of short-term interest rates, differences in relative values of similar assets in different currencies, long-term opportunities for investment and capital appreciation, and political developments.

RISKS RELATING TO OUR DEBT FINANCING

Because we borrow money, the potential for gain or loss on amounts invested in us is magnified and may increase the risk of investing in us.

Borrowings, also known as leverage, magnify the potential for loss on investments in our indebtedness and gain or loss on investments in our equity capital. As we use leverage to partially finance our investments, you will experience increased risks of investing in our securities. We, through the Funds, issue debt securities guaranteed by the SBA and sold in the capital markets. As a result of its guarantee of the debt securities, the SBA has fixed dollar claims on the assets of the Funds that are superior to the claims of our securities holders. We may also borrow from banks and other lenders, including under our Credit Facility, and may issue debt securities or enter into other types of borrowing arrangements in the future. See “Management’s Discussion and Analysis of Financial Condition and Results of Operations — Liquidity and Capital Resources — Capital Resources” for a discussion regarding our outstanding indebtedness. If the value of our assets decreases, leveraging would cause net asset value to decline more sharply than it otherwise would have had we not leveraged our business. Similarly, any decrease in our income would cause net investment income to decline more sharply than it would have had we not leveraged our business. Such a decline could negatively affect our ability to pay common stock dividends, scheduled debt payments or other payments related to our securities. Use of leverage is generally considered a speculative investment technique.

As of December 31, 2020, we, through the Funds, had $309.8 million of outstanding indebtedness guaranteed by the SBA, which had a weighted-average annualized interest cost of approximately 3.4%. The debentures guaranteed by the SBA have a maturity of ten years, with a current weighted-average remaining maturity of 5.4 years as of December 31, 2020, and require semiannual payments of interest. We will need to generate sufficient cash flow to make required interest payments on the debentures. If we are unable to meet the financial obligations under the debentures, the SBA, as a creditor, will have a superior claim to the assets of the Funds over our securities holders in the event we liquidate or the SBA exercises its remedies under such debentures as the result of a default by us.

In addition, as of December 31, 2020, we had $269.0 million outstanding under our Credit Facility. Borrowings under the Credit Facility bear interest, subject to our election, on a per annum basis at a rate equal to the applicable LIBOR rate (0.2% as of the most recent reset date for the period ended December 31, 2020) plus (i) 1.875% (or the applicable base rate (Prime Rate of 3.25% as of December 31, 2020) plus 0.875%), as long as we meet certain agreed upon excess collateral and maximum leverage requirements or (ii) 2.0% (or the applicable base rate plus 1.0%) otherwise. We pay unused commitment fees of 0.25% per annum on the unused lender commitments under the Credit Facility. If we are unable to meet the financial obligations under the Credit Facility, the Credit Facility lending group will have a superior claim to the assets of MSCC and its subsidiaries (excluding the assets of the Funds) over our stockholders in the event we liquidate or the lending group exercises its remedies under the Credit Facility as the result of a default by us.

In November 2017, we issued $185.0 million in aggregate principal amount of 4.50% unsecured notes due 2022 (the “4.50% Notes”) at an issue price of 99.16%. As of December 31, 2020, the outstanding balance of the 4.50% Notes was $185.0 million. The 4.50% Notes are unsecured obligations and rank pari passu with our current and future unsecured indebtedness; senior to any of our future indebtedness that expressly provides it is subordinated to the 4.50% Notes; effectively subordinated to all of our existing and future secured indebtedness, to the extent of the value of the assets securing such indebtedness, including borrowings under our Credit Facility; and structurally subordinated to all

40


Table of Contents

existing and future indebtedness and other obligations of any of our subsidiaries, including without limitation, the indebtedness of the Funds. The 4.50% Notes mature on December 1, 2022, and may be redeemed in whole or in part at any time at our option subject to certain make-whole provisions.

In April 2019, we issued $250.0 million in aggregate principal amount of 5.20% unsecured notes due 2024 (the “5.20% Notes”) at an issue price of 99.125%. In December 2019, we issued an additional $75.0 million in aggregate principal amount of the 5.20% Notes at an issue price of 105.0%. In July 2020, we issued an additional $125.0 million in aggregate principal amount of the 5.20% Notes at an issue price of 102.674%. As of December 31, 2020, the outstanding balance of the 5.20% Notes was $450.0 million. The 5.20% Notes issued in December 2019 and July 2020 have identical terms as, and are a part of a single series with, the 5.20% Notes issued in April 2019. The aggregate net proceeds from the 5.20% Notes issuances were used to repay a portion of the borrowings outstanding under the Credit Facility. The 5.20% Notes are unsecured obligations and rank pari passu with our current and future unsecured indebtedness; senior to any of our future indebtedness that expressly provides it is subordinated to the 5.20% Notes; effectively subordinated to all of our existing and future secured indebtedness, to the extent of the value of the assets securing such indebtedness, including borrowings under our Credit Facility; and structurally subordinated to all existing and future indebtedness and other obligations of any of our subsidiaries, including without limitation, the indebtedness of the Funds. The 5.20% Notes mature on May 1, 2024, and may be redeemed in whole or in part at any time at our option subject to certain make-whole provisions.

In January 2021, we issued $300.0 million in aggregate principal amount of 3.00% unsecured notes due 2026 (the “3.00% Notes” and, together with the 4.50% Notes and the 5.20% Notes, the “Notes”) at an issue price of 99.004%. The 3.00% Notes are unsecured obligations and rank pari passu with our current and future unsecured indebtedness; senior to any of our future indebtedness that expressly provides it is subordinated to the 3.00% Notes; effectively subordinated to all of our existing and future secured indebtedness, to the extent of the value of the assets securing such indebtedness, including borrowings under our Credit Facility; and structurally subordinated to all existing and future indebtedness and other obligations of any of our subsidiaries, including without limitation, the indebtedness of the Funds. The 3.00% Notes mature on July 14, 2026, and may be redeemed in whole or in part at any time at our option subject to certain make-whole provisions if redeemed prior to June 14, 2026.

Illustration. The following table illustrates the effect of leverage on returns from an investment in our common stock assuming various annual returns, net of expenses. The calculations in the table below are hypothetical and actual returns may be higher or lower than those appearing below.

Assumed Return on Our Portfolio(1)

(net of expenses)

(10.0)

%

(5.0)

%

0.0

%

5.0

%

10.0

%

Corresponding Net Return to Common Stock Holder(2)

(21.5)

%

(12.4)

%

(3.2)

%

5.9

%

15.1

%


(1)

Assumes, as of December 31, 2020, $2,769.4 million in total assets, $1,213.8 million in debt outstanding, $1,514.8 million in net assets, and a weighted-average interest rate of 4.0%. Actual interest payments may be different.

(2)

In order for us to cover our annual interest payments on indebtedness, we must achieve annual returns on our December 31, 2020 total assets of at least 1.8%.

Our ability to achieve our investment objective may depend in part on our ability to access additional leverage on favorable terms by issuing debentures guaranteed by the SBA through the Funds, by borrowing from banks or insurance companies or by issuing other debt securities and there can be no assurance that such additional leverage can in fact be achieved.

41


Table of Contents

All of our assets are subject to security interests under our secured Credit Facility or subject to a superior claim over our stockholders by the SBA and if we default on our obligations under the Credit Facility or with respect to our SBA-guaranteed debentures, or under the Notes, we may suffer adverse consequences, including foreclosure on our assets.

Substantially all of our assets are currently pledged as collateral under our Credit Facility or are subject to a superior claim over our stockholders by the SBA. If we default on our obligations under the Credit Facility or our SBA-guaranteed debentures, the lenders and/or the SBA may have the right to foreclose upon and sell, or otherwise transfer, the collateral subject to their security interests or their superior claim. In such event, we may be forced to sell our investments to raise funds to repay our outstanding borrowings in order to avoid foreclosure and these forced sales may be at times and at prices we would not consider advantageous. Moreover, such deleveraging of our company could significantly impair our ability to effectively operate our business in the manner in which we have historically operated. As a result, we could be forced to curtail or cease new investment activities and lower or eliminate the dividends that we have historically paid to our stockholders. In addition, if the lenders exercise their right to sell the assets pledged under our Credit Facility, such sales may be completed at distressed sale prices, thereby diminishing or potentially eliminating the amount of cash available to us after repayment of the amounts outstanding under the Credit Facility.

If our operating performance declines and we are not able to generate sufficient cash flow to service our debt obligations, we may in the future need to refinance or restructure our debt, including with respect to the Credit Facility and the Notes, sell assets, reduce or delay capital investments, seek to raise additional capital or seek to obtain waivers from the required lenders under the Credit Facility or the required holders of the Notes or other debt that we may incur in the future to avoid being in default. If we are unable to implement one or more of these alternatives, we may not be able to meet our payment obligations under the Credit Facility, the Notes and our other debt. If we breach our covenants under the Credit Facility or under the indentures governing the Notes or other debt and seek a waiver, we may not be able to obtain a waiver from the required lenders or debt holders. If this occurs, we would be in default under the Credit Facility, the Notes or other debt, the lenders or debt holders could exercise their rights as described above, and we could be forced into bankruptcy or liquidation. If we are unable to repay debt, lenders having secured obligations could proceed against the collateral securing the debt. Because the Credit Facility has, and any future credit facilities will likely have, and the indentures governing the Notes have customary cross-default provisions, if the indebtedness under the Notes, the Credit Facility or under any future credit facility is accelerated, we may be unable to repay or finance the amounts due.

RISKS RELATING TO OUR SECURITIES

Investing in our securities may involve a high degree of risk.

The investments we make in accordance with our investment objective may result in a higher amount of risk than alternative investment options and a higher risk of volatility or loss of principal. Our investments in portfolio companies involve higher levels of risk, and therefore, an investment in our securities may not be suitable for someone with lower risk tolerance.

Shares of closed-end investment companies, including BDCs, may trade at a discount to their net asset value.

Shares of closed-end investment companies, including BDCs, may trade at a discount to net asset value. This characteristic of closed-end investment companies and BDCs is separate and distinct from the risk that our net asset value per share may decline. We cannot predict whether our common stock will trade at, above or below net asset value. In addition, if our common stock trades below our net asset value per share, we will generally not be able to issue additional common stock at the market price unless our stockholders approve such a sale and our Board of Directors makes certain determinations. See “Risk Factors — Risks Relating to Our Securities — Stockholders may incur dilution if we sell shares of our common stock in one or more offerings at prices below the then current net asset value per share of our common stock or issue securities to subscribe to, convert to or purchase shares of our common stock” for a discussion related to us issuing shares of our common stock below net asset value.

42


Table of Contents

The market price of our securities may be volatile and fluctuate significantly.

Fluctuations in the trading prices of our securities may adversely affect the liquidity of the trading market for our securities and, if we seek to raise capital through future securities offerings, our ability to raise such capital. The market price and liquidity of the market for our securities may be significantly affected by numerous factors, some of which are beyond our control and may not be directly related to our operating performance. These factors include:

significant volatility in the market price and trading volume of securities of BDCs or other companies in our sector, which are not necessarily related to the operating performance of these companies;
changes in regulatory policies, accounting pronouncements or tax guidelines, particularly with respect to RICs, BDCs or SBICs;
the exclusion of BDC common stock from certain market indices, such as what happened with respect to the Russell indices and the Standard and Poor’s indices, could reduce the ability of certain investment funds to own our common stock and limit the number of owners of our common stock and otherwise negatively impact the market price of our common stock;
inability to obtain any exemptive relief that may be required by us in the future from the SEC;
loss of our BDC or RIC status or any of the Funds’ status as an SBIC;
changes in our earnings or variations in our operating results;
changes in the value of our portfolio of investments;
any shortfall in our investment income or net investment income or any increase in losses from levels expected by investors or securities analysts;
loss of a major funding source;
fluctuations in interest rates;
the operating performance of companies comparable to us;
departure of our key personnel;
proposed, or completed, offerings of our securities, including classes other than our common stock;
global or national credit market changes; and
general economic trends and other external factors.

Stockholders may incur dilution if we sell shares of our common stock in one or more offerings at prices below the then current net asset value per share of our common stock or issue securities to subscribe to, convert to or purchase shares of our common stock.

The 1940 Act prohibits us from selling shares of our common stock at a price below the current net asset value per share of such stock, with certain exceptions. One such exception is prior stockholder approval of issuances below net asset value provided that our Board of Directors makes certain determinations. We did not seek stockholder authorization to sell shares of our common stock below the then current net asset value per share of our common stock at our 2020 annual meeting of stockholders because our common stock price per share had been trading significantly above the net asset value per share of our common stock since 2011. We may, however, seek such authorization at future annual or special meetings of stockholders. Our stockholders have previously approved a proposal to authorize us to

43


Table of Contents

issue securities to subscribe to, convert to, or purchase shares of our common stock in one or more offerings. Any decision to sell shares of our common stock below the then current net asset value per share of our common stock or securities to subscribe to, convert to, or purchase shares of our common stock would be subject to the determination by our Board of Directors that such issuance is in our and our stockholders’ best interests.

If we were to sell shares of our common stock below net asset value per share, such sales would result in an immediate dilution to the net asset value per share. This dilution would occur as a result of the sale of shares at a price below the then current net asset value per share of our common stock and a proportionately greater decrease in a stockholder’s interest in our earnings and assets and voting interest in us than the increase in our assets resulting from such issuance. In addition, if we issue securities to subscribe to, convert to or purchase shares of common stock, the exercise or conversion of such securities would increase the number of outstanding shares of our common stock. Any such exercise would be dilutive on the voting power of existing stockholders, and could be dilutive with regard to dividends and our net asset value, and other economic aspects of the common stock.

Because the number of shares of common stock that could be so issued and the timing of any issuance is not currently known, the actual dilutive effect cannot be predicted; however, the example below illustrates the effect of dilution to existing stockholders resulting from the sale of common stock at prices below the net asset value of such shares.

Illustration: Example of Dilutive Effect of the Issuance of Shares Below Net Asset Value. Assume that Company XYZ has 1,000,000 total shares outstanding, $15,000,000 in total assets and $5,000,000 in total liabilities. The net asset value per share of the common stock of Company XYZ is $10.00. The following table illustrates the reduction to net asset value, or NAV, and the dilution experienced by Stockholder A following the sale of 40,000 shares of the common stock of Company XYZ at $9.50 per share, a price below its NAV per share.

Prior to Sale
Below NAV

Following Sale
Below NAV

Percentage
Change

Reduction to NAV

Total Shares Outstanding

1,000,000

1,040,000

4.0%

NAV per share

$10.00

$9.98

(0.2)%

Dilution to Existing Stockholder

Shares Held by Stockholder A

10,000

10,000(1)

0.0%

Percentage Held by Stockholder A

1.00%

0.96%

(3.8)%

Total Interest of Stockholder A in NAV

$100,000

$99,808

(0.2)%


(1)

Assumes that Stockholder A does not purchase additional shares in the sale of shares below NAV.

Provisions of the Maryland General Corporation Law and our articles of incorporation and bylaws could deter takeover attempts and have an adverse impact on the price of our common stock.

The Maryland General Corporation Law and our articles of incorporation and bylaws contain provisions that may have the effect of discouraging, delaying or making difficult a change in control of our company or the removal of our incumbent directors. The existence of these provisions, among others, may have a negative impact on the price of our common stock and may discourage third-party bids for ownership of our company. These provisions may prevent any premiums being offered to you for our common stock.

The Notes are unsecured and therefore effectively subordinated to any current or future secured indebtedness, including indebtedness under the Credit Facility.

The Notes are not secured by any of our assets or any of the assets of our subsidiaries and rank equally in right of payment with all of our existing and future unsubordinated, unsecured indebtedness. As a result, the Notes are effectively subordinated to any secured indebtedness we or our subsidiaries have currently incurred and may incur in the future (or any indebtedness that is initially unsecured to which we subsequently grant security) to the extent of the value

44


Table of Contents

of the assets securing such indebtedness. In any liquidation, dissolution, bankruptcy or other similar proceeding, the holders of any of our existing or future secured indebtedness and the secured indebtedness of our subsidiaries may assert rights against the assets pledged to secure that indebtedness in order to receive full payment of their indebtedness before the assets may be used to pay other creditors, including the holders of the Notes. As of December 31, 2020, we had $269.0 million outstanding under the Credit Facility out of $780.0 million in commitments. The indebtedness under the Credit Facility is senior to the Notes to the extent of the value of the assets securing such indebtedness.

The Notes are structurally subordinated to the indebtedness and other liabilities of our subsidiaries.

The Notes are obligations exclusively of Main Street Capital Corporation and not of any of our subsidiaries. None of our subsidiaries is a guarantor of the Notes, and the Notes are not required to be guaranteed by any subsidiaries we may acquire or create in the future. In addition, several of our subsidiaries, specifically the Funds, maintain significant indebtedness and as a result the Notes are structurally subordinated to the indebtedness of these subsidiaries. For example, as of December 31, 2020, the Funds had collectively issued $309.8 million of the current regulatory maximum of $350.0 million of SBA-guaranteed debentures, which are included in our consolidated financial statements. The assets of such subsidiaries are not directly available to satisfy the claims of our creditors, including holders of the Notes. See “Management’s Discussion and Analysis of Financial Condition and Results of Operations — Liquidity and Capital Resources” for more detail on the SBA-guaranteed debentures.

Except to the extent we are a creditor with recognized claims against our subsidiaries, all claims of other creditors of our subsidiaries have priority over our equity interests in such subsidiaries (and therefore the claims of our creditors, including holders of the Notes) with respect to the assets of such subsidiaries. Even if we are recognized as a creditor of one or more of our subsidiaries, our claims would still be effectively subordinated to any security interests in the assets of any such subsidiary and to any indebtedness or other liabilities of any such subsidiary senior to our claims. Consequently, the Notes are structurally subordinated to all indebtedness, including the SBA-guaranteed debentures, and other liabilities of any of our subsidiaries and any subsidiaries that we may in the future acquire or establish. In addition, our subsidiaries may incur substantial additional indebtedness in the future, all of which would be structurally senior to the Notes.

The Notes may or may not have an established trading market. If a trading market in the Notes is developed, it may not be maintained.

The Notes may or may not have an established trading market. If a trading market in the Notes is developed, it may not be maintained. If the Notes are traded, they may trade at a discount to their initial offering price depending on prevailing interest rates, the market for similar securities, our credit ratings, our financial condition or other relevant factors. Accordingly, we cannot assure you that a liquid trading market has been or will develop for the Notes, that you will be able to sell your Notes at a particular time or that the price you receive when you sell will be favorable. To the extent an active trading market does not develop or is not maintained, the liquidity and trading price for the Notes may be harmed. Accordingly, you may be required to bear the financial risk of an investment in the Notes for an indefinite period of time.

A downgrade, suspension or withdrawal of the credit rating assigned by a rating agency to us or the Notes, if any, or change in the debt markets could cause the liquidity or market value of the Notes to decline significantly.

Our credit ratings are an assessment by rating agencies of our ability to pay our debts when due. Consequently, real or anticipated changes in our credit ratings will generally affect the market value of the Notes. These credit ratings may not reflect the potential impact of risks relating to the structure or marketing of the Notes. Credit ratings are not a recommendation to buy, sell or hold any security, and may be revised or withdrawn at any time by the issuing organization in its sole discretion. We undertake no obligation to maintain our credit ratings or to advise holders of Notes of any changes in our credit ratings. The Notes are currently rated by Standard & Poor’s Ratings Services (“S&P”). There can be no assurance that our credit ratings will remain for any given period of time or that such credit ratings will not be lowered or withdrawn entirely by the rating agency if in their judgment future circumstances relating to the basis of the credit ratings, such as adverse changes in our company, so warrant. In this regard, in March 2020, in connection with the onset of the COVID-19 pandemic, S&P downgraded our long-term issuer rating to "BBB–" with an

45


Table of Contents

"Outlook Stable." Further downgrades to us or our securities could increase our cost of capital or otherwise have a negative effect on our results of operations and financial condition. The conditions of the financial markets and prevailing interest rates have fluctuated in the past and are likely to fluctuate in the future, which could have an adverse effect on the market prices of the Notes.

The indentures under which the Notes were issued contain limited protection for holders of the Notes.

The indentures under which the Notes were issued offer limited protection to holders of the Notes. The terms of the indentures and the Notes do not restrict our or any of our subsidiaries’ ability to engage in, or otherwise be a party to, a variety of corporate transactions, circumstances or events that could have an adverse impact on investments in the Notes. In particular, the terms of the indentures and the Notes do not place any restrictions on our or our subsidiaries’ ability to:

issue securities or otherwise incur additional indebtedness or other obligations, including (1) any indebtedness or other obligations that would be equal in right of payment to the Notes, (2) any indebtedness or other obligations that would be secured and therefore rank effectively senior in right of payment to the Notes to the extent of the values of the assets securing such debt, (3) indebtedness of ours that is guaranteed by one or more of our subsidiaries and which therefore is structurally senior to the Notes and (4) securities, indebtedness or obligations issued or incurred by our subsidiaries that would be senior to our equity interests in our subsidiaries and therefore rank structurally senior to the Notes with respect to the assets of our subsidiaries, in each case other than an incurrence of indebtedness or other obligation that would cause a violation of Section 18(a)(1)(A) as modified by Section 61(a)(1) of the 1940 Act or any successor provisions, but giving effect, in each case, to any exemptive relief granted to us by the SEC (currently, this provision generally prohibits us from making additional borrowings, including through the issuance of additional debt or the sale of additional debt securities, unless our asset coverage, as defined in the 1940 Act, equals at least 200% (or 150% if certain requirements are met) after such borrowings);
pay dividends on, or purchase or redeem or make any payments in respect of, capital stock or other securities ranking junior in right of payment to the Notes, including subordinated indebtedness;
sell assets (other than certain limited restrictions on our ability to consolidate, merge or sell all or substantially all of our assets);
enter into transactions with affiliates;
create liens (including liens on the shares of our subsidiaries) or enter into sale and leaseback transactions;
make investments; or
create restrictions on the payment of dividends or other amounts to us from our subsidiaries.

Furthermore, the terms of the indentures and the Notes do not protect holders of the Notes in the event that we experience changes (including significant adverse changes) in our financial condition, results of operations or credit ratings, if any, as they do not require that we or our subsidiaries adhere to any financial tests or ratios or specified levels of net worth, revenues, income, cash flow or liquidity.

Our ability to recapitalize, incur additional debt and take a number of other actions that are not limited by the terms of the Notes may have important consequences for holders of the Notes, including making it more difficult for us to satisfy our obligations with respect to the Notes or negatively affecting the trading value of the Notes.

46


Table of Contents

Other debt we issue or incur in the future could contain more protections for its holders than the indentures and the Notes, including additional covenants and events of default. The issuance or incurrence of any such debt with incremental protections could affect the market for and trading levels and prices of the Notes.

The optional redemption provision may materially adversely affect your return on the Notes.

The Notes are redeemable in whole or in part upon certain conditions at any time or from time to time at our option. We may choose to redeem the Notes at times when prevailing interest rates are lower than the interest rate paid on the Notes. In this circumstance, you may not be able to reinvest the redemption proceeds in a comparable security at an effective interest rate as high as the Notes being redeemed.

We may not be able to repurchase the Notes upon a Change of Control Repurchase Event.

We may not be able to repurchase the Notes upon certain change in control events described in the indentures under which the Notes were issued (each, a “Change of Control Repurchase Event”) because we may not have sufficient funds. Upon a Change of Control Repurchase Event, holders of the Notes may require us to repurchase for cash some or all of the Notes at a repurchase price equal to 100% of the aggregate principal amount of the Notes being repurchased, plus accrued and unpaid interest to, but not including, the repurchase date. The terms of our Credit Facility provide that certain change of control events will constitute an event of default thereunder entitling the lenders to accelerate any indebtedness outstanding under our Credit Facility at that time and to terminate the Credit Facility. Our and our subsidiaries’ future financing facilities may contain similar restrictions and provisions. Our failure to purchase such tendered Notes upon the occurrence of such Change of Control Repurchase Event would cause an event of default under the indentures governing the Notes and a cross-default under the agreements governing certain of our other indebtedness, which may result in the acceleration of such indebtedness requiring us to repay that indebtedness immediately. If a Change of Control Repurchase Event were to occur, we may not have sufficient funds to repay any such accelerated indebtedness.

If we default on our obligations to pay our other indebtedness, we may not be able to make payments on the Notes.

As of December 31, 2020, we had approximately $1,213.8 million of principal indebtedness, including $269.0 million outstanding under the Credit Facility, $309.8 million outstanding from SBA-guaranteed debentures, $185.0 million of the 4.50% Notes and $450.0 million of the 5.20% Notes outstanding. Any default under the agreements governing our indebtedness, including a default under the Credit Facility, under the Notes or under other indebtedness to which we may be a party that is not waived by the required lenders or debt holders, and the remedies sought by the holders of such indebtedness could make us unable to pay principal, premium, if any, and interest on the Notes and substantially decrease the market value of the Notes. If we are unable to generate sufficient cash flow and are otherwise unable to obtain funds necessary to meet required payments of principal, premium, if any, and interest on our indebtedness, or if we otherwise fail to comply with the various covenants, including financial and operating covenants, in the instruments governing our indebtedness, we could be in default under the terms of the agreements governing such indebtedness. In the event of such default, the holders of such indebtedness could elect to declare all the funds borrowed thereunder to be due and payable, together with accrued and unpaid interest, the lenders under the Credit Facility or other debt we may incur in the future could elect to terminate their commitments, cease making further loans and institute foreclosure proceedings against our assets, and we could be forced into bankruptcy or liquidation. Our ability to generate sufficient cash flow in the future is, to some extent, subject to general economic, financial, competitive, legislative and regulatory factors as well as other factors that are beyond our control. We cannot assure you that our business will generate cash flow from operations, or that future borrowings will be available to us under the Credit Facility or otherwise, in an amount sufficient to enable us to meet our payment obligations under the Notes and our other debt and to fund other liquidity needs.

We may in the future determine to issue preferred stock, which could adversely affect the market value of our common stock.

The issuance of shares of preferred stock with dividend or conversion rights, liquidation preferences or other economic terms favorable to the holders of preferred stock could adversely affect the market price for our common stock

47


Table of Contents

by making an investment in the common stock less attractive. In addition, the dividends on any preferred stock we issue must be cumulative. Payment of dividends and repayment of the liquidation preference of preferred stock must take preference over any dividends or other payments to our common stockholders, and holders of preferred stock are not subject to any of our expenses or losses and are not entitled to participate in any income or appreciation in excess of their stated preference (other than convertible preferred stock that converts into common stock). In addition, under the 1940 Act, preferred stock constitutes a “senior security” for purposes of the asset coverage test.

FEDERAL INCOME TAX RISKS

We will be subject to corporate-level U.S. federal income tax if we are unable to qualify as a RIC under Subchapter M of the Code.

To maintain RIC tax treatment under the Code, we must meet the following annual distribution, income source and asset diversification requirements:

The Annual Distribution Requirement for a RIC will be satisfied if we distribute to our stockholders on an annual basis at least 90% of our net ordinary taxable income and realized net short-term capital gains in excess of realized net long-term capital losses, if any. Depending on the level of taxable income earned in a tax year, we may choose to carry forward taxable income in excess of current year distributions into the next tax year and pay a 4% U.S. federal excise tax on such income. Any such carryover taxable income must be distributed through a dividend declared prior to filing the final tax return related to the year which generated such taxable income. For more information regarding tax treatment, see “Business — Regulation — Taxation as a Regulated Investment Company.” Because we use debt financing, we are subject to certain asset coverage ratio requirements under the 1940 Act and are (and may in the future become) subject to certain financial covenants under loan and credit agreements that could, under certain circumstances, restrict us from making distributions necessary to satisfy the distribution requirement. In addition, because we receive non-cash sources of income such as PIK interest which involves us recognizing taxable income without receiving the cash representing such income, we may have difficulty meeting the distribution requirement. If we are unable to obtain cash from other sources, we could fail to qualify for RIC tax treatment and thus become subject to corporate-level U.S. federal income tax.
The source-of-income requirement will be satisfied if we obtain at least 90% of our gross income for each year from distributions, interest, gains from the sale of stock or securities or similar sources.
The asset diversification requirement will be satisfied if we meet certain asset diversification requirements at the end of each quarter of our taxable year. To satisfy this requirement, at least 50% of the value of our assets must consist of cash, cash equivalents, U.S. government securities, securities of other RICs, and other acceptable securities; and no more than 25% of the value of our assets can be invested in the securities, other than U.S. government securities or securities of other RICs, (i) of one issuer, (ii) of two or more issuers that are controlled, as determined under applicable Code rules, by us and that are engaged in the same or similar or related trades or businesses or (iii) of certain “qualified publicly traded partnerships.”

Failure to meet these requirements may result in our having to dispose of certain investments quickly in order to prevent the loss of RIC status. Because most of our investments are in privately held companies, and therefore illiquid, any such dispositions could be made at disadvantageous prices and could result in substantial losses. Moreover, if we fail to maintain RIC tax treatment for any reason and are subject to corporate income tax, the resulting corporate taxes could substantially reduce our net assets, the amount of income available for distribution and the amount of our distributions.

We may have difficulty paying the distributions required to maintain RIC tax treatment under the Code if we recognize income before or without receiving cash representing such income.

We will include in income certain amounts that we have not yet received in cash, such as: (i) amortization of original issue discount, which may arise if we receive warrants in connection with the origination of a loan such that ascribing a value to the warrants creates original issue discount in the debt instrument, if we invest in a debt investment at a discount to the par value of the debt security or possibly in other circumstances; (ii) contractual payment-in-kind, or

48


Table of Contents

PIK, interest, which represents contractual interest added to the loan balance and due at the end of the loan term; (iii) contractual preferred dividends, which represents contractual dividends added to the preferred stock and due at the end of the preferred stock term, subject to adequate profitability at the portfolio company; or (iv) amortization of market discount, which is associated with loans purchased in the secondary market at a discount to par value. Such amortization of original issue discounts, increases in loan balances as a result of contractual PIK arrangements, cumulative preferred dividends, or amortization of market discount will be included in income before we receive the corresponding cash payments. We also may be required to include in income certain other amounts before we receive such amounts in cash. Investments structured with these features may represent a higher level of credit risk compared to investments generating income which must be paid in cash on a current basis. For the year ended December 31, 2020, (i) approximately 2.8% of our total investment income was attributable to PIK income not paid currently in cash, (ii) approximately 0.3% of our total investment income was attributable to amortization of original issue discount, (iii) approximately 0.8% of our total investment income was attributable to cumulative dividend income not paid currently in cash, and (iv) approximately 2.3% of our total investment income was attributable to amortization of market discount on loans purchased in the secondary market at a discount.

Since, in certain cases, we may recognize taxable income before or without receiving cash representing such income, we may have difficulty meeting the Annual Distribution Requirement necessary to maintain RIC tax treatment under the Code. Accordingly, we may have to sell some of our investments at times and/or at prices we would not consider advantageous, raise additional debt or equity capital or forgo new investment opportunities for this purpose. If we are not able to obtain cash from other sources, we may fail to qualify for RIC tax treatment and thus become subject to corporate-level U.S. federal income tax. For additional discussion regarding the tax implications of a RIC, please see “Business — Regulation — Taxation as a Regulated Investment Company.”

We may in the future choose to pay dividends in our own stock, in which case you may be required to pay tax in excess of the cash you receive.

We may distribute taxable dividends that are payable in part in our stock. Under certain applicable provisions of the Code and the Treasury regulations, distributions payable by us in cash or in shares of stock (at the stockholders election) would satisfy the Annual Distribution Requirement. The Internal Revenue Service has issued guidance providing that a dividend payable in stock or in cash at the election of the stockholders will be treated as a taxable dividend eligible for the dividends paid deduction provided that at least 20% of the total dividend is payable in cash and certain other requirements are satisfied. Taxable stockholders receiving such dividends will be required to include the full amount of the dividend as ordinary income (or as long-term capital gain to the extent such dividend is properly reported as a capital gain dividend) to the extent of our current and accumulated earnings and profits for U.S. federal income tax purposes. As a result, a U.S. stockholder may be required to pay tax with respect to such dividends in excess of any cash received. If a U.S. stockholder sells the stock it receives as a dividend in order to pay this tax, the sales proceeds may be less than the amount included in income with respect to the dividend, depending on the market price of our stock at the time of the sale. Furthermore, with respect to non-U.S. stockholders, we may be required to withhold U.S. tax with respect to such dividends, including in respect of all or a portion of such dividend that is payable in stock. In addition, if a significant number of our stockholders determine to sell shares of our stock in order to pay taxes owed on dividends, it may put downward pressure on the trading price of our stock.

Legislative or regulatory tax changes could adversely affect our stockholders.

At any time, the federal income tax laws governing RICs or the administrative interpretations of those laws or regulations may be amended. Any of those new laws, regulations or interpretations may take effect retroactively and could adversely affect the taxation of us or our stockholders. Therefore, changes in tax laws, regulations or administrative interpretations or any amendments thereto could diminish the value of an investment in our shares or the value or the resale potential of our investments. If we do not comply with applicable laws and regulations, we could lose any licenses that we then hold for the conduct of our business and may be subject to civil fines and criminal penalties.

49


Table of Contents

Each of the Funds, as an SBIC, may be unable to make distributions to us that will enable us to meet or maintain RIC status, which could result in the imposition of an entity-level tax.

In order for us to continue to qualify for RIC tax treatment and to minimize corporate-level U.S. federal taxes, we will be required to distribute substantially all of our net ordinary taxable income and net capital gain income, including taxable income from certain of our subsidiaries, which includes the income from the Funds. We will be partially dependent on the Funds for cash distributions to enable us to meet the RIC distribution requirements. The Funds may be limited by SBIC regulations from making certain distributions to us that may be necessary to enable us to maintain our status as a RIC. We may have to request a waiver of the SBA’s restrictions for the Funds to make certain distributions to maintain our eligibility for RIC status. We cannot assure you that the SBA will grant such waiver and if the Funds are unable to obtain a waiver, compliance with the SBIC regulations may result in loss of RIC tax treatment and a consequent imposition of an entity-level tax on us.

Because we intend to distribute substantially all of our taxable income to our stockholders to maintain our status as a RIC, we will continue to need additional capital to finance our growth, and regulations governing our operation as a BDC will affect our ability to, and the way in which we, raise additional capital and make distributions.

In order to satisfy the requirements applicable to a RIC and to minimize corporate-level U.S. federal taxes, we intend to distribute to our stockholders substantially all of our net ordinary taxable income and net capital gain income. We may carry forward excess undistributed taxable income into the next year. Any such carryover taxable income must be distributed through a dividend declared prior to filing the final tax return related to the year which generated such taxable income. As a BDC, we generally are required to meet an asset coverage ratio, as defined in the 1940 Act, of at least 200% (or 150% if certain requirements are met) immediately after each issuance of senior securities. This requirement limits the amount that we may borrow and may prohibit us from making distributions. Because we will continue to need capital to grow our Investment Portfolio, this limitation may prevent us from incurring debt and require us to raise additional equity at a time when it may be disadvantageous to do so.

While we expect to be able to borrow and to issue additional debt and equity securities, we cannot assure you that debt and equity financing will be available to us on favorable terms, or at all. In addition, as a BDC, we generally are not permitted to issue equity securities priced below net asset value without stockholder approval. If additional funds are not available to us, we could be forced to curtail or cease new investment activities, and our net asset value could decline.

GENERAL RISK FACTORS

Deterioration in the economy and financial markets could impair our portfolio companies’ financial positions and operating results and affect the industries in which we invest, which could, in turn, harm our operating results.

The broader fundamentals of the United States economy remain mixed. In the event that the United States economy contracts, it is likely that the financial results of small to mid-sized companies, like those in which we invest, could experience deterioration or limited growth from current levels, which could ultimately lead to difficulty in meeting their debt service requirements and an increase in defaults. In addition, a decline in oil and natural gas prices would adversely affect the credit quality of our debt investments and the underlying operating performance of our equity investments in energy-related businesses. Consequently, we can provide no assurance that the performance of certain portfolio companies will not be negatively impacted by economic cycles, industry cycles or other conditions, which could also have a negative impact on our future results.

Although we have been able to secure access to additional liquidity, including through our Credit Facility, public debt issuances, leverage available through the SBIC program and equity offerings, the potential for volatility in the debt and equity capital markets provides no assurance that debt or equity capital will be available to us in the future on favorable terms, or at all. Further, if the price of our common stock falls below our net asset value per share, we will be limited in our ability to sell new shares if we do not have stockholder authorization to sell shares at a price below net asset value per share. We did not seek stockholder authorization to sell shares of our common stock below the then

50


Table of Contents

current net asset value per share of our common stock at our 2020 annual meeting of stockholders because our common stock price had been trading significantly above the net asset value per share of our common stock since 2011.

We may experience fluctuations in our operating results.

We could experience fluctuations in our operating results due to a number of factors, including our ability or inability to make investments in companies that meet our investment criteria, the interest rate payable on the debt securities we acquire, the level of portfolio dividend and fee income, the level of our expenses, variations in and the timing of the recognition of realized and unrealized gains or losses, the degree to which we encounter competition in our markets and general economic conditions. As a result of these factors, operating results for any period should not be relied upon as being indicative of performance in future periods.

Terrorist attacks, acts of war, public health crises or natural disasters may affect any market for our securities, impact the businesses in which we invest and harm our business, operating results and financial condition.

Terrorist acts, acts of war, public health crises (including the recent coronavirus outbreak) or natural disasters may disrupt our operations, as well as the operations of the businesses in which we invest. Such acts have created, and continue to create, economic and political uncertainties and have contributed to global economic instability. Future terrorist activities, military or security operations, public health crises, or natural disasters could further weaken the domestic/global economies and create additional uncertainties, which may negatively impact the businesses in which we invest directly or indirectly and, in turn, could have a material adverse impact on our business, operating results and financial condition. Losses from terrorist attacks, public health crises and natural disasters are generally uninsurable.

We are highly dependent on information systems and systems failures could significantly disrupt our business, which may, in turn, negatively affect the market price of our common stock and our ability to pay dividends.

Our business is highly dependent on our and third parties’ communications and information systems. Any failure or interruption of those systems, including as a result of the termination of an agreement with any third-party service providers, could cause delays or other problems in our activities. Our financial, accounting, data processing, backup or other operating systems and facilities may fail to operate properly or become disabled or damaged as a result of a number of factors including events that are wholly or partially beyond our control and adversely affect our business. There could be:

sudden electrical or telecommunications outages;
natural disasters such as earthquakes, tornadoes and hurricanes;
disease pandemics;
events arising from local or larger scale political or social matters, including terrorist acts; and
cyber attacks, including software viruses, ransomware, malware and phishing and vishing schemes.

The failure in cyber security systems, as well as the occurrence of events unanticipated in our disaster recovery systems and management continuity planning could impair our ability to conduct business effectively.

The occurrence of a disaster such as a cyber-attack, a natural catastrophe, an industrial accident, a terrorist attack or war, events unanticipated in our disaster recovery systems, or a support failure from external providers, could have an adverse effect on our ability to conduct business and on our results of operations and financial condition, particularly if those events affect our computer-based data processing, transmission, storage, and retrieval systems or destroy data. If a significant number of our managers were unavailable in the event of a disaster, our ability to effectively conduct our business could be severely compromised.

51


Table of Contents

We depend heavily upon computer systems to perform necessary business functions. Despite our implementation of a variety of security measures, our computer systems could be subject to cyber-attacks and unauthorized access, such as physical and electronic break-ins or unauthorized tampering. Like other companies, we may experience threats to our data and systems, including malware and computer virus attacks, unauthorized access, system failures and disruptions. If one or more of these events occurs, it could potentially jeopardize the confidential, proprietary and other information processed and stored in, and transmitted through, our computer systems and networks, or otherwise cause interruptions or malfunctions in our operations, which could result in damage to our reputation, financial losses, litigation, increased costs, regulatory penalties and/or customer dissatisfaction or loss.

Third parties with which we do business (including, but not limited to, service providers, such as accountants, custodians, transfer agents and administrators, and the issuers of securities in which we invest) may also be sources or targets of cyber security or other technological risks. While we engage in actions to reduce our exposure resulting from outsourcing, we cannot control the cyber security plans and systems put in place by these third parties and ongoing threats may result in unauthorized access, loss, exposure or destruction of data, or other cybersecurity incidents, with increased costs and other consequences, including those described above. Privacy and information security laws and regulation changes, and compliance with those changes, may also result in cost increases due to system changes and the development of new administrative processes.

Item 1B. Unresolved Staff Comments

None.

Item 2. Properties

We do not own any real estate or other physical properties materially important to our operations. Currently, we lease office space in Houston, Texas for our corporate headquarters.

Item 3. Legal Proceedings

We may, from time to time, be involved in litigation arising out of our operations in the normal course of business or otherwise. Furthermore, third parties may seek to impose liability on us in connection with the activities of our portfolio companies. While the outcome of any current legal proceedings cannot at this time be predicted with certainty, we do not expect any current matters will materially affect our financial condition or results of operations; however, there can be no assurance whether any pending legal proceedings will have a material adverse effect on our financial condition or results of operations in any future reporting period.

Item 4. Mine Safety Disclosures

Not applicable.

PART II

Item 5. Market for Registrant’s Common Equity, Related Stockholder Matters and Issuer Purchases of Equity Securities

COMMON STOCK AND HOLDERS

Our common stock is traded on the New York Stock Exchange (“NYSE”) under the symbol “MAIN.”

52


Table of Contents

The following table sets forth, for the periods indicated, the range of high and low closing prices of our common stock as reported on the NYSE, and the sales price as a percentage of the net asset value per share of our common stock.

Premium 


Premium of

(Discount) of

High Sales

Low Sales


Price Range

Price to

Price to


NAV(1)


High


Low


NAV(2)


NAV(2)


Year ending December 31, 2021


First Quarter (through February 25, 2021)

*

$

36.92

$

31.35

*


*

Year ending December 31, 2020


Fourth Quarter

$

22.35

$

32.59

$

27.39

46

%  

23

%

Third Quarter


21.52


33.01


28.66

53

%  

33

%

Second Quarter


20.85


35.82


17.34

72

%  

(17)

%

First Quarter


20.73


45.00


15.74

117

%  

(24)

%

Year ending December 31, 2019


Fourth Quarter

$

23.91

$

43.68

$

41.27

83

%  

73

%

Third Quarter


24.20


44.34


40.90

83

%  

69

%

Second Quarter


24.17


41.80


37.49

73

%  

55

%

First Quarter


24.41


39.21


33.99

61

%  

39

%


(1)Net asset value per share, or NAV, is determined as of the last day in the relevant quarter and therefore may not reflect the net asset value per share on the date of the high and low closing prices. The net asset values shown are based on outstanding shares at the end of each period. Net asset value has not yet been determined for the first quarter of 2021.
(2)Calculated for each quarter as (i) NAV subtracted from the respective high or low share price divided by (ii) NAV.

On February 25, 2021, the last sale price of our common stock on the NYSE was $35.70 per share, and there were approximately 428 holders of record of the common stock which did not include stockholders for whom shares are held in “nominee” or “street name.” The net asset value per share of our common stock on December 31, 2020 was $22.35, and the premium of the February 25, 2021 closing price of our common stock was 60% to this net asset value per share.

Shares of BDCs may trade at a market price that is less than the value of the net assets attributable to those shares. The possibility that our shares of common stock will trade at a discount from net asset value per share or at premiums that are unsustainable over the long term are separate and distinct from the risk that our net asset value per share will decrease. It is not possible to predict whether our common stock will trade at, above, or below net asset value per share. Since our IPO in October 2007, our shares of common stock have traded at prices both less than and exceeding our net asset value per share.

DIVIDEND/DISTRIBUTION POLICY

We currently intend to distribute dividends or make distributions to our stockholders out of assets legally available for distribution. Our dividends and other distributions, if any, will be determined by our Board of Directors from time to time. Our ability to declare dividends depends on our earnings, our overall financial condition (including our liquidity position), maintenance of our RIC status and such other factors as our Board of Directors may deem relevant from time to time. When we make distributions, we are required to determine the extent to which such distributions are paid out of current or accumulated earnings, recognized capital gains or capital. To the extent there is a return of capital (a distribution of the stockholders' invested capital), investors will be required to reduce their basis in our stock for federal tax purposes. In the future, our distributions may include a return of capital.

We have adopted a dividend reinvestment and direct stock purchase plan (the “Plan”). The dividend reinvestment feature of the Plan (the “DRIP”) provides for the reinvestment of dividends on behalf of our stockholders,

53


Table of Contents

unless a stockholder has elected to receive dividends in cash. As a result, if we declare a cash dividend, our stockholders who have not “opted out” of the DRIP by the dividend record date will have their cash dividend automatically reinvested into additional shares of MSCC common stock. The share requirements of the DRIP may be satisfied through the issuance of new shares of common stock or through open market purchases of common stock by the DRIP plan administrator. Newly issued shares will be valued based upon the final closing price of MSCC’s common stock on a valuation date determined for each dividend by our Board of Directors. Shares purchased in the open market to satisfy the DRIP requirements will be valued based upon the average price of the applicable shares purchased by the DRIP plan administrator, before any associated brokerage or other costs. Our DRIP is administered by our transfer agent on behalf of our record holders and participating brokerage firms. Brokerage firms and other financial intermediaries may decide not to participate in our DRIP but may provide a similar dividend reinvestment plan for their clients.

SALES OF UNREGISTERED SECURITIES

During the year ended December 31, 2020, we issued a total of 517,796 shares of our common stock under the DRIP. These issuances were not subject to the registration requirements of the Securities Act of 1933, as amended. The aggregate value of the shares of our common stock issued under the DRIP during 2020 was approximately $16.2 million.

PURCHASES OF EQUITY SECURITIES

Upon vesting of restricted stock awarded pursuant to our employee equity compensation plan, shares may be withheld to meet applicable tax withholding requirements. Any withheld shares are treated as common stock purchases by the Company in our consolidated financial statements as they reduce the number of shares received by employees upon vesting (see “Purchase of vested stock for employee payroll tax withholding” in the consolidated statements of changes in net assets for share amounts withheld).

STOCK PERFORMANCE GRAPH

The following graph compares the stockholder return on our common stock from October 5, 2007 to December 31, 2020 with the S&P 500 Index, the Russell 2000 Index, the KBW Regional Bank Index and the Main Street Peer Group (as defined below). This comparison assumes $100.00 was invested on October 5, 2007 (the date our common stock began to trade in connection with our initial public offering) in our common stock and in the comparison groups and assumes the reinvestment of all cash dividends prior to any tax effect. The comparisons in the graph below are based on historical data and are not intended to forecast the possible future performance of our common stock.

54


Table of Contents

COMPARISON OF STOCKHOLDER RETURN(1)

Among Main Street Capital Corporation, the S&P 500 Index, the Russell 2000 Index, the KBW

Regional Bank Index, and the Main Street Peer Group(2)

(For the Period October 5, 2007 to December 31, 2020)

TOTAL RETURN PERFORMANCE SINCE IPO

Graphic


(1)Total return includes reinvestment of dividends through December 31, 2020.
(2)The Main Street Peer Group is composed of Apollo Investment Corp., Ares Capital Corporation, Barings BDC, Inc., Blackrock Capital Investment Corp., Crescent Capital BDC Inc, TCG BDC, Inc, Capital Southwest Corporation, Fidus Investment Corporation, FS KKR Capital Corp., Gladstone Investment Corporation, Golub Capital BDC, Inc., Goldman Sachs BDC, Inc., Hercules Capital Inc., Monroe Capital Corporation, Newtek Business Services Corp., New Mountain Finance Corporation, Oaktree Strategic Income Corp., Oaktree Specialty Lending Corp., OFS Capital Corporation, PennantPark Floating Rate Capital Ltd., PennantPark Investment Corp., Prospect Capital Corporation, Saratoga Investment Corp., Stellus Capital Investment Corp., Solar Capital Ltd., Solar Senior Capital Ltd, BlackRock TCP Capital Corp., Triplepoint Venture Growth BDC Corp., Sixth Street Specialty Lending, Inc., and WhiteHorse Finance, Inc.

55


Table of Contents

Item 6. Selected Financial Data

The selected financial and other data as of and for the years ended December 31, 2020, 2019, 2018, 2017 and 2016 have been derived from our consolidated financial statements. You should read this selected financial and other data in conjunction with our “Management’s Discussion and Analysis of Financial Condition and Results of Operations” and the consolidated financial statements and related notes included in this Annual Report on Form 10-K.

Twelve Months Ended December 31, 


2020


2019


2018


2017


2016

(dollars in thousands, except per share amounts)

Statement of operations data:


Investment income:


Total interest, fee and dividend income


$

222,614

$

243,373

$

233,355

$

205,741

$

178,165

Interest from idle funds and other


174

Total investment income


222,614

243,373


233,355


205,741


178,339

Expenses:


Interest


(49,587)

(50,258)


(43,493)


(36,479)


(33,630)

Compensation


(18,981)

(19,792)


(18,966)


(18,560)


(16,408)

General and administrative


(12,702)

(12,546)


(11,868)


(11,674)


(9,284)

Share‑based compensation


(10,828)

(10,083)


(9,151)


(10,027)


(8,304)

Expenses allocated to the External Investment Manager


7,429

6,672


6,768


6,370


5,089

Total expenses


(84,669)

(86,007)


(76,710)


(70,370)


(62,537)

Net investment income


137,945

157,366


156,645


135,371


115,802

Total net realized gain (loss) from investments


(115,947)

(15,112)


1,341


16,182


29,389

Realized loss on extinguishment of debt


(534)

(5,689)


(2,896)


(5,217)


Total net unrealized appreciation (depreciation) from investments


(6,082)

(10,204)


17,981


42,545


(6,576)

Total net unrealized appreciation (depreciation) from SBIC debentures


460

4,450


1,294


6,212


(943)

Income tax benefit (provision)


13,541

(1,242)


(6,152)


(24,471)


1,227

Net increase in net assets resulting from operations attributable to common stock

$

29,383

$

129,569

$

168,213

$

170,622

$

138,899

Net investment income per share — basic and diluted

$

2.10

$

2.50

$

2.60

$

2.39

$

2.23

Net increase in net assets resulting from operations attributable to common stock per share — basic and diluted

$

0.45

$

2.06

$

2.80

$

3.01

$

2.67

Weighted‑average shares outstanding — basic and diluted


65,705,963


62,960,591


60,176,843


56,691,913


52,025,002

56


Table of Contents


As of December 31, 


2020


2019


2018


2017


2016

(dollars in thousands)

Balance sheet data:


Assets:


Total portfolio investments at fair value

$

2,684,866

$

2,602,324

$

2,453,909

$

2,171,305

$

1,996,906

Cash and cash equivalents


31,919


55,246


54,181


51,528


24,480

Interest receivable and other assets


49,761


50,458


40,875


38,725


37,123

Deferred financing costs, net of accumulated amortization


2,818


3,521


4,461


3,837


12,645

Deferred tax asset, net


9,125

Total assets

$

2,769,364

$

2,711,549

$

2,553,426

$

2,265,395

$

2,080,279

Liabilities and net assets:

Credit facility

$

269,000

$

300,000

$

301,000

$

64,000

$

343,000

SBIC debentures at fair value(1)


303,972


306,188


338,186


288,483


239,603

5.20% Notes due 2024


451,817


324,595


4.50% Notes due 2022


183,836


183,229


182,622


182,015


4.50% Notes due 2019


174,338


173,616


175,000

6.125% Notes


89,057


90,655

Accounts payable and other liabilities


20,833


24,532


17,962


20,168


14,205

Payable for securities purchased


28,254


40,716


2,184

Interest payable


8,658


7,292


6,041


5,273


4,103

Dividend payable


13,889


13,174


11,948


11,146


10,048

Deferred tax liability, net


2,592


16,149


17,026


10,553


Total liabilities


1,254,597


1,175,159


1,077,377


885,027


878,798

Total net assets


1,514,767


1,536,390


1,476,049


1,380,368


1,201,481

Total liabilities and net assets

$

2,769,364

$

2,711,549

$

2,553,426

$

2,265,395

$

2,080,279

Other data:

Weighted‑average effective yield on LMM debt investments(2),(3)


11.6

%  


11.8

%  


12.3

%  


12.0

%  


12.5

%

Number of LMM portfolio companies


70


69


69


70


73

Weighted‑average effective yield on Middle Market debt investments(2),(3)


7.9

%  


8.6

%  


9.6

%  


9.0

%  


8.5

%

Number of Middle Market portfolio companies


42


51


56


62


78

Weighted‑average effective yield on Private Loan debt investments(2),(3)


8.7

%  


9.5

%  


10.4

%  


9.2

%  


9.6

%

Number of Private Loan portfolio companies


63


65


59


54


46

Expense ratios (as percentage of average net assets):

Total expenses, including income tax expense


5.0

%  


5.7

%  


5.7

%  


7.4

%  


5.5

%

Operating expenses


5.9

%  


5.7

%  


5.3

%  


5.5

%  


5.6

%

Operating expenses, excluding interest expense


2.4

%  


2.4

%  


2.3

%  


2.6

%  


2.6

%

Total investment return(4)


(19.1)

%  


36.9

%  


(8.3)

%  


16.0

%  


37.4

%

Total return based on change in NAV(5)


1.9

%  


8.8

%  


12.2

%  


14.2

%  


13.0

%


(1)SBIC debentures for December 31, 2020, 2019, 2018, 2017 and 2016 are $309,800, $311,800, $345,800, $298,800 and $240,000 at par, respectively.

57


Table of Contents

(2)Weighted-average effective yield is calculated based on our debt investments at the end of each period and includes amortization of deferred debt origination fees and accretion of original issue discount, but excludes liquidation fees payable upon repayment and any debt investments on non-accrual status. The weighted-average annual effective yield is higher than what an investor in shares of our common stock will realize on its investment because it does not reflect any debt investments on non-accrual status, our expenses or any sales load paid by an investor. For information on our investments on non-accrual status, see “Management’s Discussion and Analysis of Financial Condition and Results of Operations — Portfolio Asset Quality”.
(3)Including investments on non-accrual status, the weighted-average effective yield for LMM, Middle Market, and Private Loan debt investments was 10.4%, 7.9%, and 8.4%, respectively, as of December 31, 2020.
(4)Total investment return is based on the purchase of stock at the current market price on the first day and a sale at the current market price on the last day of each period reported on the table and assumes reinvestment of dividends at prices obtained by our dividend reinvestment plan during the period. The return does not reflect any sales load that may be paid by an investor.
(5)Total return is based on change in net asset value and was calculated using the sum of ending net asset value plus dividends to stockholders and other non-operating changes during the period, as divided by the beginning net asset value. Non-operating changes include any items that affect net asset value other than the net increase in net assets resulting from operations, such as the effects of stock offerings, shares issued under the DRIP and equity incentive plans and other miscellaneous items.

58


Table of Contents

Item 7. Management’s Discussion and Analysis of Financial Condition and Results of Operations

The following discussion should be read in conjunction with our consolidated financial statements and the notes thereto included elsewhere in this Annual Report on Form 10-K.

Statements we make in the following discussion which express a belief, expectation or intention, as well as those that are not historical fact, are forward-looking statements that are subject to risks, uncertainties and assumptions. Our actual results, performance or achievements, or industry results, could differ materially from those we express in the following discussion as a result of a variety of factors, including the risks and uncertainties we have referred to under the headings “Cautionary Statement Concerning Forward-Looking Statements” and “Risk Factors” in Part I of this report.

COVID-19 UPDATE

The COVID-19 pandemic, and the related effect on the U.S. and global economies, has had, and threatens to continue to have, adverse consequences for our business and operating results, and the businesses and operating results of our portfolio companies. During the quarter ended December 31, 2020, we continued to work collectively with our employees and portfolio companies to navigate the significant challenges created by the COVID-19 pandemic. We remain focused on ensuring the safety of our employees and the employees of our portfolio companies, while also managing our ongoing business activities. In this regard, we remain heavily engaged with our portfolio companies. As discussed below under “Discussion and Analysis of Results of Operations,” our investment income, principally our interest and dividend income, was negatively impacted by the economic effects of COVID-19 in 2020. We continue to maintain access to multiple sources of liquidity, including cash, unused capacity under our Credit Facility and remaining SBIC debenture capacity, and from December 31, 2019 to December 31, 2020, our total liquidity improved from $495.5 million to $583.1 million. As of December 31, 2020, we were in compliance with all debt covenants and do not anticipate any issues with our ability to comply with all covenants in the future. Refer to “—Liquidity and Capital Resources” below for further discussion as of December 31, 2020.

Neither our management nor our Board of Directors is able to predict the full impact of the COVID-19 pandemic, including its duration and the magnitude of its economic and societal impact. As such, while we will continue to monitor the rapidly evolving situation and guidance from U.S. and international authorities, including federal, state and local public health authorities, we are unable to predict with any certainty the extent to which the outbreak will negatively affect our portfolio companies’ operating results and financial condition or the impact that such disruptions may have on our results of operations and financial condition in the future.

INVESTMENT PORTFOLIO ACTIVITY

The following tables provide a summary of our investments in the LMM, Middle Market and Private Loan portfolios as of December 31, 2020 and 2019 (this information excludes the Other Portfolio investments and the External Investment Manager which are discussed further below):


As of December 31, 2020


LMM (a)

Middle Market

Private Loan


(dollars in millions)


Number of portfolio companies

70


42


63

Fair value

$

1,285.5


$

445.6


$

740.4

Cost

$

1,104.6


$

488.9


$

769.0

Debt investments as a % of portfolio (at cost)

65.8

%

93.0

%

93.8

%

Equity investments as a % of portfolio (at cost)

34.2

%

7.0

%

6.2

%

% of debt investments at cost secured by first priority lien

98.1

%

92.4

%

95.4

%

Weighted-average annual effective yield (b)

11.6

%

7.9

%

8.7

%

Average EBITDA (c)

$

5.3


$

76.5


$

58.1


59


Table of Contents

(a)At December 31, 2020, we had equity ownership in approximately 99% of our LMM portfolio companies, and the average fully diluted equity ownership in those portfolio companies was approximately 38%.
(b)The weighted-average annual effective yields were computed using the effective interest rates for all debt investments at cost as of December 31, 2020, including amortization of deferred debt origination fees and accretion of original issue discount but excluding fees payable upon repayment of the debt instruments and any debt investments on non-accrual status. Weighted-average annual effective yield is higher than what an investor in shares of our common stock will realize on its investment because it does not reflect our expenses or any sales load paid by an investor.
(c)The average EBITDA is calculated using a simple average for the LMM portfolio and a weighted-average for the Middle Market and Private Loan portfolios. These calculations exclude certain portfolio companies, including three LMM portfolio companies, one Middle Market portfolio company and four Private Loan portfolio companies, as EBITDA is not a meaningful valuation metric for our investments in these portfolio companies, and those portfolio companies whose primary purpose is to own real estate.


As of December 31, 2019


LMM (a)

Middle Market

Private Loan


(dollars in millions)


Number of portfolio companies

69


51


65

Fair value

$

1,206.9


$

522.1


$

692.1

Cost

$

1,002.2


$

572.3


$

734.8

Debt investments as a % of portfolio (at cost)

65.9

%

94.8

%

94.6

%

Equity investments as a % of portfolio (at cost)

34.1

%

5.2

%

5.4

%

% of debt investments at cost secured by first priority lien

98.1

%

91.3

%

95.4

%

Weighted-average annual effective yield (b)

11.8

%

8.6

%

9.5

%

Average EBITDA (c)

$

5.1


$

85.0


$

57.8


(a)At December 31, 2019, we had equity ownership in approximately 99% of our LMM portfolio companies, and the average fully diluted equity ownership in those portfolio companies was approximately 42%.
(b)The weighted-average annual effective yields were computed using the effective interest rates for all debt investments at cost as of December 31, 2019, including amortization of deferred debt origination fees and accretion of original issue discount but excluding fees payable upon repayment of the debt instruments and any debt investments on non-accrual status. Weighted-average annual effective yield is higher than what an investor in shares of our common stock will realize on its investment because it does not reflect our expenses or any sales load paid by an investor.
(c)The average EBITDA is calculated using a simple average for the LMM portfolio and a weighted-average for the Middle Market and Private Loan portfolios. These calculations exclude certain portfolio companies, including three LMM portfolio companies, two Middle Market portfolio companies and three Private Loan portfolio companies, as EBITDA is not a meaningful valuation metric for our investments in these portfolio companies, and those portfolio companies whose primary purpose is to own real estate.

As of December 31, 2020, we had Other Portfolio investments in twelve companies, collectively totaling approximately $96.6 million in fair value and approximately $124.7 million in cost basis and which comprised approximately 3.6% of our Investment Portfolio at fair value. As of December 31, 2019, we had Other Portfolio investments in eleven companies, collectively totaling approximately $106.7 million in fair value and approximately $118.4 million in cost basis and which comprised approximately 4.1% of our Investment Portfolio at fair value.

As previously discussed, the External Investment Manager is a wholly owned subsidiary that is treated as a portfolio investment. As of December 31, 2020, there was $29.5 million in cost basis in this investment and the investment had a fair value of approximately $116.8 million, which comprised approximately 4.3% of our Investment

60


Table of Contents

Portfolio at fair value. As of December 31, 2019, there was no cost basis in this investment and the investment had a fair value of approximately $74.5 million, which comprised approximately 2.9% of our Investment Portfolio at fair value.

CRITICAL ACCOUNTING POLICIES

The preparation of financial statements and related disclosures in conformity with GAAP requires management to make estimates and assumptions that affect the reported amounts of assets and liabilities, and contingent assets and liabilities at the date of the financial statements, and revenues and expenses during the periods reported. Actual results could materially differ from those estimates. Critical accounting policies are those that require management to make subjective or complex judgments about the effect of matters that are inherently uncertain and may change in subsequent periods. Changes that may be required in the underlying assumptions or estimates in these areas could have a material impact on our current and future financial condition and results of operations.

Management has discussed the development and selection of each critical accounting policy and estimate with the Audit Committee of the Board of Directors. Our critical accounting policies and estimates include the Investment Portfolio Valuation and Revenue Recognition policies described below. Our significant accounting policies are described in greater detail in Note B to the consolidated financial statements included in “Item 8.– Consolidated Financial Statements and Supplementary Data” of this Annual Report on Form 10-K.

Investment Portfolio Valuation

The most significant determination inherent in the preparation of our consolidated financial statements is the valuation of our Investment Portfolio and the related amounts of unrealized appreciation and depreciation. We consider this determination to be a critical accounting estimate, given the significant judgments and subjective measurements required. As of December 31, 2020 and 2019, our Investment Portfolio valued at fair value represented approximately 97% and 96% of our total assets, respectively. We are required to report our investments at fair value. We follow the provisions of FASB ASC 820, Fair Value Measurements and Disclosures (“ASC 820”). ASC 820 defines fair value, establishes a framework for measuring fair value, establishes a fair value hierarchy based on the quality of inputs used to measure fair value and enhances disclosure requirements for fair value measurements. ASC 820 requires us to assume that the portfolio investment is to be sold in the principal market to independent market participants, which may be a hypothetical market. Market participants are defined as buyers and sellers in the principal market that are independent, knowledgeable and willing and able to transact. See “Note B.1.—Valuation of the Investment Portfolio” in the notes to consolidated financial statements for a detailed discussion of our investment portfolio valuation process and procedures.

Due to the inherent uncertainty in the valuation process, our determination of fair value for our Investment Portfolio may differ materially from the values that would have been determined had a ready market for the securities existed. In addition, changes in the market environment, portfolio company performance and other events that may occur over the lives of the investments may cause the gains or losses ultimately realized on these investments to be materially different than the valuations currently assigned. We determine the fair value of each individual investment and record changes in fair value as unrealized appreciation or depreciation.

Our Board of Directors has the final responsibility for overseeing, reviewing and approving, in good faith, our determination of the fair value for our Investment Portfolio and our valuation procedures, consistent with 1940 Act requirements. We believe our Investment Portfolio as of December 31, 2020 and 2019 approximates fair value as of those dates based on the markets in which we operate and other conditions in existence on those reporting dates.

The SEC recently adopted new Rule 2a-5 under the 1940 Act, which establishes requirements for determining fair value in good faith for purposes of the 1940 Act. We will comply with the new rule’s valuation requirements on or before the SEC’s compliance date in 2022.

61


Table of Contents

Revenue Recognition

Interest and Dividend Income

We record interest and dividend income on the accrual basis to the extent amounts are expected to be collected. Dividend income is recorded as dividends are declared by the portfolio company or at the point an obligation exists for the portfolio company to make a distribution. In accordance with our valuation policies, we evaluate accrued interest and dividend income periodically for collectability. When a loan or debt security becomes 90 days or more past due, and if we otherwise do not expect the debtor to be able to service all of its debt or other obligations, we will generally place the loan or debt security on non-accrual status and cease recognizing interest income on that loan or debt security until the borrower has demonstrated the ability and intent to pay contractual amounts due. If a loan or debt security’s status significantly improves regarding the debtor’s ability to service the debt or other obligations, or if a loan or debt security is sold or written off, we remove it from non-accrual status.

Fee Income

We may periodically provide services, including structuring and advisory services, to our portfolio companies or other third parties. For services that are separately identifiable and evidence exists to substantiate fair value, fee income is recognized as earned, which is generally when the investment or other applicable transaction closes. Fees received in connection with debt financing transactions for services that do not meet these criteria are treated as debt origination fees and are deferred and accreted into income over the life of the financing.

Payment-in-Kind (“PIK”) Interest and Cumulative Dividends

We hold certain debt and preferred equity instruments in our Investment Portfolio that contain PIK interest and cumulative dividend provisions. The PIK interest, computed at the contractual rate specified in each debt agreement, is periodically added to the principal balance of the debt and is recorded as interest income. Thus, the actual collection of this interest may be deferred until the time of debt principal repayment. Cumulative dividends are recorded as dividend income, and any dividends in arrears are added to the balance of the preferred equity investment. The actual collection of these dividends in arrears may be deferred until such time as the preferred equity is redeemed or sold. To maintain RIC tax treatment (as discussed in “Note B.9.—Income Taxes” in the notes to consolidated financial statements), these non-cash sources of income may need to be paid out to stockholders in the form of distributions, even though we may not have collected the PIK interest and cumulative dividends in cash. We stop accruing PIK interest and cumulative dividends and write off any accrued and uncollected interest and dividends in arrears when we determine that such PIK interest and dividends in arrears are no longer collectible. For the years ended December 31, 2020, 2019, and 2018, (i) approximately 2.8%, 2.0% and 1.0%, respectively, of our total investment income was attributable to PIK interest income not paid currently in cash and (ii) approximately 0.8%, 1.0% and 1.0%, respectively, of our total investment income was attributable to cumulative dividend income not paid currently in cash.

INVESTMENT PORTFOLIO COMPOSITION

The following tables summarize the composition of our total combined LMM portfolio investments, Middle Market portfolio investments and Private Loan portfolio investments at cost and fair value by type of investment as a percentage of the total combined LMM portfolio investments, Middle Market portfolio investments and Private Loan portfolio investments as of December 31, 2020 and 2019 (this information excludes the Other Portfolio investments and the External Investment Manager).

Cost:


December 31, 2020


December 31, 2019

First lien debt


77.0

%  

78.2

%

Equity


19.0

%  

17.2

%

Second lien debt


2.7

%  

3.5

%

Equity warrants


0.5

%  

0.6

%

Other


0.8

%  

0.5

%


100.0

%  

100.0

%

62


Table of Contents

Fair Value:


December 31, 2020


December 31, 2019


First lien debt


70.0

%  

70.1

%


Equity


26.4

%  

26.0

%


Second lien debt


2.4

%  

3.0

%


Equity warrants


0.4

%  

0.4

%


Other


0.8

%  

0.5

%


100.0

%  

100.0

%


Our LMM portfolio investments, Middle Market portfolio investments and Private Loan portfolio investments carry a number of risks including: (1) investing in companies which may have limited operating histories and financial resources; (2) holding investments that generally are not publicly traded and which may be subject to legal and other restrictions on resale; and (3) other risks common to investing in below investment grade debt and equity investments in our Investment Portfolio. Please see “Risk Factors — Risks Related to Our Investments” for a more complete discussion of the risks involved with investing in our Investment Portfolio.

PORTFOLIO ASSET QUALITY

We utilize an internally developed investment rating system to rate the performance of each LMM portfolio company and to monitor our expected level of returns on each of our LMM investments in relation to our expectations for the portfolio company. The investment rating system takes into consideration various factors, including each investment’s expected level of returns, the collectability of our debt investments and the ability to receive a return of the invested capital in our equity investments, comparisons to competitors and other industry participants, the portfolio company’s future outlook and other factors that are deemed to be significant to the portfolio company.

As of December 31, 2020, our total Investment Portfolio had seven investments on non-accrual status, which comprised approximately 1.3% of its fair value and 3.6% of its cost. As of December 31, 2019, our total Investment Portfolio had eight investments on non-accrual status, which comprised approximately 1.4% of its fair value and 4.8% of its cost.

The operating results of our portfolio companies are impacted by changes in the broader fundamentals of the United States economy. In periods during which the United States economy contracts, as it has due to the impact of COVID-19, it is likely that the financial results of small to mid-sized companies, like those in which we invest, could experience deterioration or limited growth from current levels, which could ultimately lead to difficulty in meeting their debt service requirements, to an increase in defaults on our debt investments or in realized losses on our investments and to difficulty in maintaining historical dividend payment rates and unrealized appreciation on our equity investments. Consequently, we can provide no assurance that the performance of certain portfolio companies will not be negatively impacted by future economic cycles or other conditions, which could also have a negative impact on our future results.

DISCUSSION AND ANALYSIS OF RESULTS OF OPERATIONS

Set forth below is a comparison of the results of operations and changes in financial condition for the years ended December 31, 2020 and 2019. The comparison of, and changes between, the fiscal years ended December 31, 2019 and 2018 can be found within “Item 7. Management's Discussion and Analysis of Financial Condition and Results of Operations” included in Part II of our annual report on Form 10-K for the fiscal year ended December 31, 2019, which is incorporated herein by reference.

63


Table of Contents

Comparison of the years ended December 31, 2020 and 2019

Year Ended


December 31, 

Net Change


2020


2019


Amount


%

(dollars in thousands)

Total investment income

$

222,614

$

243,373

$

(20,759)


(9)

%

Total expenses


(84,669)


(86,007)


1,338


(2)

%

Net investment income


137,945


157,366


(19,421)


(12)

%

Net realized loss from investments


(115,947)


(15,112)


(100,835)

NM

Net realized loss on extinguishment of debt

(534)

(5,689)

5,155

NM

Net unrealized appreciation (depreciation) from:

Portfolio investments


(6,082)


(10,204)


4,122

NM

SBIC debentures


460


4,450


(3,990)

NM

Total net unrealized appreciation (depreciation)


(5,622)


(5,754)


132

NM

Income tax benefit (provision)


13,541


(1,242)


14,783

NM

Net increase (decrease) in net assets resulting from operations

$

29,383

$

129,569

$

(100,186)


NM

Year Ended


December 31, 

Net Change


2020


2019


Amount


%

(dollars in thousands, except per share amounts)


Net investment income

$

137,945

$

157,366

$

(19,421)


(12)

%

Share‑based compensation expense


10,828


10,083


745


7

%

Distributable net investment income(a)

$

148,773

$

167,449

$

(18,676)


(11)

%

Net investment income per share—Basic and diluted

$

2.10

$

2.50

$

(0.40)


(16)

%

Distributable net investment income per share—Basic and diluted(a)

$

2.26

$

2.66

$

(0.40)


(15)

%


NM

Not Meaningful

(a)Distributable net investment income is net investment income as determined in accordance with U.S. GAAP, excluding the impact of share-based compensation expense which is non-cash in nature. We believe presenting distributable net investment income and related per share amounts is useful and appropriate supplemental disclosure of information for analyzing our financial performance since share-based compensation does not require settlement in cash. However, distributable net investment income is a non-U.S. GAAP measure and should not be considered as a replacement to net investment income and other earnings measures presented in accordance with U.S. GAAP. Instead, distributable net investment income should be reviewed only in connection with such U.S. GAAP measures in analyzing our financial performance. A reconciliation of net investment income in accordance with U.S. GAAP to distributable net investment income is presented in the table above.

Investment Income

Total investment income for the year ended December 31, 2020 was $222.6 million, a 9% decrease from the $243.4 million of total investment income for the prior year. The following table provides a summary of the changes in the comparable period activity.

Year Ended

December 31, 

Net Change

2020

2019

Amount

%

(dollars in thousands)

Interest Income

$

173,676

$

187,381

$

(13,705)

(7)

%

(a)

Dividend Income

36,373

49,782

(13,409)

(27)

%

(b)

Fee Income

12,565

6,210

6,355

102

%

(c)

Total Investment Income

$

222,614

$

243,373

$

(20,759)

(9)

%

(d)

64


Table of Contents


(a)The decrease in interest income was primarily due to lower floating interest rates on investment portfolio debt investments based upon the decline in the London Interbank Offered Rate (“LIBOR”) and an increase in the level non-accrual investments, partially offset by a $2.5 million increase resulting from increased prepayment, repricing and other activities considered less consistent or non-recurring involving existing Investment Portfolio debt investments.
(b)The decrease in dividend income was primarily the result of the negative impacts of the COVID-19 pandemic on certain of our portfolio companies’ operating results, financial condition and liquidity, as well as the uncertainty relative to the duration of the pandemic’s effects.
(c)The increase in fee income was primarily due to (i) a $4.6 million increase in fees from origination of debt investments resulting from higher new investment activity and (ii) a $1.7 million increase in fees from repayment and refinancing activity on existing portfolio investments.
(d)The decrease in total investment income includes the impact of a $4.2 million increase from accelerated prepayment, repricing and other income activity considered less consistent or non-recurring, which incorporates the $2.5 million increase in interest income from prepayment, repricing and other activities and the $1.7 million increase in fee income from repayment and repricing activity, both as described above.

Expenses

Total expenses for the year ended December 31, 2020 decreased to $84.7 million from $86.0 million in the prior year. The following table provides a summary of the changes in the comparable period activity.

Year Ended

December 31, 

Net Change

2020

2019

Amount

%

(dollars in thousands)

Employee Compensation Expenses

$

18,197

$

18,896

$

(700)

(4)

%

(a)

Deferred Compensation Plan Expense

784

896

(112)

(12)

%

Total Compensation Expense

18,981

19,792

(811)

(4)

%

G&A Expense

12,702

12,546

156

1

%

Interest Expense

49,587

50,258

(671)

(1)

%

Share Based Compensation Expense

10,828

10,083

745

7

%

Gross Expenses

92,098

92,679

(581)

(1)

%

Allocation of Expenses to the External Investment Manager

(7,429)

(6,672)

(757)

11

%

(b)

Total Expenses

$

84,669

$

86,007

$

(1,338)

(2)

%


(a)The decrease in employee compensation expenses was primarily due to a decline in incentive compensation, partially offset by an increase in base compensation expense.
(b)The increase in expenses allocated to the External Investment Manager was generally attributable to expenses incurred in connection with the transaction by with the External Investment Manager became the sole investment manager to MSC Income.

Net Investment Income

Net investment income for the year ended December 31, 2020 decreased 12% to $137.9 million, or $2.10 per share, compared to net investment income of $157.4 million, or $2.50 per share, for the prior year. The decrease in net investment income was principally attributable to the decrease in total investment income, partially offset by lower operating expenses, both as discussed above. The decrease in net investment income per share reflects these changes, as well as the 4.4% increase in weighted average shares outstanding to 65.7 million for the year ended December 31, 2020, primarily due to shares issued through the ATM Program (as defined in “—Liquidity and Capital Resources—Capital Resources” below), shares issued pursuant to our equity incentive plans and shares issued pursuant to our dividend

65


Table of Contents

reinvestment plan. The decline in net investment income on a per share basis includes the impacts of an increase of $0.06 per share due to the increase in investment income from accelerated prepayment, repricing and other income activity considered less consistent or non-recurring, as discussed above.

Distributable Net Investment Income

Distributable net investment income for the year ended December 31, 2020 decreased 11% to $148.8 million, or $2.26 per share, compared with $167.4 million, or $2.66 per share, in the prior year. The decline in distributable net investment income was primarily due to the decreased level of total investment income, partially offset by lower operating expenses, both as discussed above. The decline in distributable net investment income on a per share basis for the year ended December 31, 2020 also reflects a greater number of average shares outstanding compared to the prior year and the impacts of the increase in investment income from accelerated prepayment, repricing and other income activity considered less consistent or non-recurring, both as discussed above.

Net Realized Gain (Loss) from Investments

The following table provides a summary of the primary components of the total net realized loss on investments of $115.9 million for the year ended December 31, 2020:

Year Ended December 31, 2020

Full Exits

Partial Exits

Restructures

Total

Net Gain/(Loss)

# of Investments

Net Gain/(Loss)

# of Investments

Net Gain/(Loss)

# of Investments

Net Gain/(Loss)

# of Investments

(dollars in thousands)

LMM Portfolio

$

(5,937)

5

$

(12,880)

5

$

-

-

$

(18,817)

10

Middle Market Portfolio

(22,503)

6

-

-

(30,594)

4

(53,097)

10

Private Loan Portfolio

(29,075)

2

-

-

(14,914)

2

(43,989)

4

Total Net Realized Gain/(Loss)

$

(57,514)

13

$

(12,880)

5

$

(45,509)

6

$

(115,903)

24

The following table provides a summary of the primary components of the total net realized loss on investments of $15.1 million for the year ended December 31, 2019:

Year Ended December 31, 2019

Full Exits

Partial Exits

Restructures

Total

Net Gain/Loss

# of Investments

Net Gain/Loss

# of Investments

Net Gain/Loss

# of Investments

Net Gain/Loss

# of Investments

(dollars in thousands)

LMM Portfolio

$

13,788

4

$

-

-

$

-

-

$

13,788

4

Middle Market Portfolio

(12,216)

2

(7,012)

1

(9,880)

2

(29,107)

5

Private Loan Portfolio

616

4

-

-

-

-

616

4

Total Net Realized Gain/(Loss)

$

2,189

10

$

(7,012)

1

$

(9,880)

2

$

(14,703)

13

66


Table of Contents

Net Unrealized Appreciation (Depreciation)

The following table provides a summary of the total net unrealized depreciation of $5.6 million for the year ended December 31, 2020:

Year Ended December 31, 2020

Middle

Private


LMM(a)


Market (b)


Loan (c)


Other

Total


(dollars in millions)

Accounting reversals of net unrealized (appreciation) depreciation recognized in prior periods due to net realized (gains / income) losses recognized during the current period

$

11.0

$

50.0

$

48.4

$

0.0

$

109.4

Net unrealized depreciation relating to portfolio investments


(34.7)


(43.1)


(34.6)


(3.0)

(d)


(115.5)

Total net unrealized depreciation relating to portfolio investments

$

(23.7)

$

6.9

$

13.7

$

(3.0)

$

(6.1)

Unrealized appreciation relating to SBIC debentures (e)


0.5

Total net unrealized depreciation

$

(5.6)


(a)Includes unrealized appreciation on 31 LMM portfolio investments and unrealized depreciation on 34 LMM portfolio investments.
(b)Includes unrealized appreciation on 16 Middle Market portfolio investments and unrealized depreciation on 33 Middle Market portfolio investments.
(c)Includes unrealized appreciation on 20 Private Loan portfolio investments and unrealized depreciation on 41 Private Loan portfolio investments.
(d)Includes $16.5 million of net unrealized depreciation relating to the Other Portfolio, partially offset primarily by $12.7 million of unrealized appreciation relating to the External Investment Manager.
(e)Relates to unrealized depreciation on the SBIC debentures previously issued by MSC II, which were accounted for on a fair value basis.

The following table provides a summary of the total net unrealized depreciation of $5.8 million for the year ended December 31, 2019:

Year Ended December 31, 2019

Middle

Private


LMM(a)


Market (b)


Loan (c)


Other

Total


(dollars in millions)

Accounting reversals of net unrealized (appreciation) depreciation recognized in prior periods due to net
realized (gains / income) losses recognized during the current period

$

(14.0)

$

23.6

$

(2.3)

$

0.1

$

7.4

Net unrealized appreciation (depreciation) relating to portfolio investments


14.5


(42.0)


4.3


5.6

(d)


(17.6)

Total net unrealized appreciation (depreciation) relating to portfolio investments

$

0.5

$

(18.4)

$

2.0

$

5.7

$

(10.2)

Unrealized appreciation relating to SBIC debentures(e)


4.4

Total net unrealized depreciation

$

(5.8)

67


Table of Contents


(a)

Includes unrealized appreciation on 33 LMM portfolio investments and unrealized depreciation on 27 LMM portfolio investments.

(b)

Includes unrealized appreciation on 22 Middle Market portfolio investments and unrealized depreciation on 37 Middle Market portfolio investments.

(c)

Includes unrealized appreciation on 42 Private Loan portfolio investments and unrealized depreciation on 21 Private Loan portfolio investments.

(d)

Includes (i) $8.8 million of unrealized appreciation relating to the External Investment Manager and (ii) $0.9 million of unrealized appreciation relating to the investment assets in the Main Street Capital Corporation Deferred Compensation Plan (see “Related Party Transactions” below), partially offset by $4.0 million of net unrealized depreciation relating to the Other Portfolio.

(e)

Relates to $5.7 million of unrealized appreciation on the SBIC debentures previously issued by MSC II which are accounted for on a fair value basis and is primarily related to accounting reversals of previously recognized unrealized depreciation recorded since the date of the MSC II acquisition on the debentures repaid during the year ended December 31, 2019, partially offset by $1.2 million of unrealized depreciation on the SBIC debentures previously issued by MSC II, which are also accounted for on a fair value basis.

Income Tax Benefit (Provision)

The income tax benefit for the year ended December 31, 2020 of $13.5 million principally consisted of a deferred tax benefit of $14.1 million, which is primarily the result of the net activity relating to our portfolio investments held in our Taxable Subsidiaries, including changes in loss carryforwards, changes in net unrealized appreciation/depreciation and other temporary book-tax differences, partially offset by a current tax provision of $0.5 million related to a $1.6 million provision for excise tax on our estimated undistributed taxable income and a $1.1 million benefit for current U.S. federal and state income taxes.

The income tax provision for the year ended December 31, 2019 of $1.2 million principally consisted of a current tax expense of $3.5 million related to (i) a $2.4 million provision for current U.S. federal and state income taxes and (ii) a $1.1 million provision for excise tax on our estimated undistributed taxable income, partially offset by a deferred tax benefit of $2.3 million, which is primarily the result of the net activity relating to our portfolio investments held in our Taxable Subsidiaries, including changes in loss carryforwards, changes in net unrealized appreciation/depreciation and other temporary book-tax differences.

Net Increase (Decrease) in Net Assets Resulting from Operations

The net increase in net assets resulting from operations for the year ended December 31, 2020 was $29.4 million, or $0.45 per share, compared with $129.6 million, or $2.06 per share, during the year ended December 31, 2019. The tables above provide a summary of the reasons for the change in Net Increase in Net Assets Resulting from Operations for the year ended December 31, 2020 as compared to the year ended December 31, 2019.

Liquidity and Capital Resources

This “Liquidity and Capital Resources” section should be read in conjunction with the “COVID-19 Update” section above.

Cash Flows

For the year ended December 31, 2020, we experienced a net decrease in cash and cash equivalents in the amount of $23.3 million, which is the net result of $54.1 million of cash used in our operating activities and $30.8 million of cash provided by our financing activities.

68


Table of Contents

The $54.1 million of cash used in our operating activities resulted primarily from cash uses totaling $669.0 million for the funding of new and follow-on portfolio company investments, including the transaction pursuant to which the External Investment Manager became the sole investment adviser to MSC Income, and settlement of accruals for portfolio investments existing as of December 31, 2019, partially offset by (i) cash proceeds totaling $478.0 million from the sales and repayments of debt investments and sales of and return on capital of equity investments, (ii) cash flows we generated from the operating profits earned totaling $131.5 million, which is our distributable net investment income, excluding the non-cash effects of the accretion of unearned income, payment-in-kind interest income, cumulative dividends and the amortization expense for deferred financing costs, and (iii) cash proceeds of $5.4 million related to changes in other assets and liabilities.

The $30.8 million of cash provided by our financing activities principally consisted of (i) $125.0 million in proceeds from the follow-on issuance of the 5.20% Notes in July 2020, (ii) $84.4 million in net cash proceeds from our ATM Program (described below) and direct stock purchase plan, (iii) $40.0 million in cash proceeds from the issuance of SBIC debentures and (iv) $0.7 million for debt issuance premiums, net of payments of deferred debt issuance costs, SBIC debenture fees and other costs, partially offset by (i) $144.5 million in cash dividends paid to stockholders, (ii) $31.0 million in net repayments from the Credit Facility, (iii) $42.0 million in repayment of SBIC debentures, and (iv) $1.9 million for purchases of vested restricted stock from employees to satisfy their tax withholding requirements upon the vesting of such restricted stock.

For the year ended December 31, 2019, we experienced a net increase in cash and cash equivalents in the amount of $1.1 million, which is the net result of $33.8 million of cash used in our operating activities and $34.9 million of cash provided by our financing activities.

The $33.8 million of cash was used in our operating activities resulted primarily from cash uses totaling $664.1 million for the funding of new portfolio company investments and settlement of accruals for portfolio investments existing as of December 31, 2018, partially offset by (i) cash flows we generated from the operating profits earned totaling $151.6 million, which is our distributable net investment income, excluding the non-cash effects of the accretion of unearned income, payment-in-kind interest income, cumulative dividends and the amortization expense for deferred financing costs, (ii) cash proceeds totaling $477.9 million from the sales and repayments of debt investments and sales of and return on capital of equity investments and (iii) cash proceeds of $0.8 million related to changes in other assets and liabilities.

The $34.9 million of cash was used in our financing activities principally consisted of (i) $325.0 million in cash proceeds from the issuance of the 5.20% Notes and (ii) $89.3 million in net cash proceeds from the ATM Program (described below), partially offset by (i) $175.0 million cash used in repayment of 4.50% Notes due 2019, (ii) $164.3 million in cash dividends paid to stockholders, (iii) $34.0 million in repayment of SBIC debentures, (iv) $3.9 million for purchases of vested restricted stock from employees to satisfy their tax withholding requirements upon the vesting of such restricted stock, (v) $1.2 million for payment of deferred debt issuance costs, SBIC debenture fees and other costs and (vi) and $1.0 in net repayments on the Credit Facility.

Capital Resources

As of December 31, 2020, we had $31.9 million in cash and cash equivalents and $511.0 million of unused capacity under the Credit Facility, which we maintain to support our investment and operating activities. As of December 31, 2020, our net asset value totaled $1,514.8 million, or $22.35 per share.

The Credit Facility, which provides additional liquidity to support our investment and operational activities, includes total commitments of $780.0 million from a diversified group of 19 lenders. The Credit Facility matures in September 2023 and contains an accordion feature, which allows us to increase the total commitments under the facility to up to $800.0 million from new and existing lenders on the same terms and conditions as the existing commitments. Borrowings under the Credit Facility bear interest, subject to our election and resetting on a monthly basis on the first of each month, on a per annum basis at a rate equal to the applicable LIBOR rate (0.2% as of the most recent reset date for the period ended December 31, 2020) plus (i) 1.875% (or the applicable base rate (Prime Rate of 3.25% as of December 31, 2020) plus 0.875%) as long as we meet certain agreed upon excess collateral and maximum leverage

69


Table of Contents

requirements or (ii) 2.0% (or the applicable base rate plus 1.0%) otherwise. We pay unused commitment fees of 0.25% per annum on the unused lender commitments under the Credit Facility. The Credit Facility is secured by a first lien on the assets of MSCC and its subsidiaries, excluding the equity ownership or assets of the Funds and the External Investment Manager. The Credit Facility contains certain affirmative and negative covenants, including but not limited to: (i) maintaining a minimum availability of at least 10% of the borrowing base, (ii) maintaining an interest coverage ratio of at least 2.0 to 1.0, (iii) maintaining an asset coverage ratio (tangible net worth to Credit Facility borrowings) of at least 1.5 to 1.0 and (iv) maintaining a minimum tangible net worth. The Credit Facility is provided on a revolving basis through its final maturity date in September 2023, and contains two, one-year extension options which could extend the final maturity by up to two years, subject to certain conditions, including lender approval. As of December 31, 2020, we had $269.0 million in borrowings outstanding under the Credit Facility, the interest rate on the Credit Facility was 2.0% and we were in compliance with all financial covenants of the Credit Facility.

Through the Funds, we have the ability to issue SBIC debentures guaranteed by the SBA at favorable interest rates and favorable terms and conditions. Under existing SBIC regulations, SBA-approved SBICs under common control have the ability to issue debentures guaranteed by the SBA up to a regulatory maximum amount of $350.0 million. Under existing SBA-approved commitments, we had $309.8 million of outstanding SBIC debentures guaranteed by the SBA as of December 31, 2020 through our wholly owned SBICs, which bear a weighted-average annual fixed interest rate of approximately 3.4%, paid semiannually, and mature ten years from issuance. The first maturity related to our SBIC debentures occurs in 2021, and the weighted-average remaining duration is approximately 5.4 years as of December 31, 2020. During the year ended December 31, 2020, Main Street issued $40.0 million of SBIC debentures and prepaid $42.0 million of existing SBIC debentures that were scheduled to mature over the next year as part of an effort to manage the maturity dates of the oldest SBIC debentures. Debentures guaranteed by the SBA have fixed interest rates that equal prevailing 10-year Treasury Note rates plus a market spread and have a maturity of ten years with interest payable semiannually. The principal amount of the debentures is not required to be paid before maturity, but may be pre-paid at any time with no prepayment penalty. We expect to issue new SBIC debentures under the SBIC program in the future in an amount up to the regulatory maximum amount for affiliated SBIC funds.

In November 2017, we issued $185.0 million in aggregate principal amount of the 4.50% Notes at an issue price of 99.16%. The 4.50% Notes are scheduled to mature on December 1, 2022 and are unsecured obligations and rank pari passu with our current and future unsecured obligations and rank pari passu with our current and future unsecured indebtedness; senior to any of our future indebtedness that expressly provides it is subordinated to the 4.50% Notes; effectively subordinated to all of our existing and future secured indebtedness, to the extent of the value of the assets securing such indebtedness, including borrowings under our Credit Facility; and structurally subordinated to all existing and future indebtedness and other obligations of any of our subsidiaries, including without limitation, the indebtedness of the Funds. The 4.50% Notes may be redeemed in whole or in part at any time at our option subject to certain make-whole provisions. The 4.50% Notes bear interest at a rate of 4.50% per year payable semiannually on June 1 and December 1 of each year. We may from time to time repurchase the 4.50% Notes in accordance with the 1940 Act and the rules promulgated thereunder. As of December 31, 2020, the outstanding balance of the 4.50% Notes was $185.0 million.

The indenture governing the 4.50% Notes (the “4.50% Notes Indenture”) contains certain covenants, including covenants requiring our compliance with (regardless of whether we are subject to) the asset coverage requirements set forth in Section 18(a)(1)(A) as modified by Section 61(a)(1) of the 1940 Act, as well as covenants requiring us to provide financial information to the holders of the 4.50% Notes and the Trustee if we cease to be subject to the reporting requirements of the Exchange Act. These covenants are subject to limitations and exceptions that are described in the 4.50% Notes Indenture.

In April 2019, we issued $250.0 million in aggregate principal amount of the 5.20% Notes at an issue price of 99.125%. Subsequently, in December 2019, we issued an additional $75.0 million in aggregate principal amount of the 5.20% Notes at an issue price of 105.0%. Also, in July 2020, we issued an additional $125.0 million in aggregate principal amount of the 5.20% Notes at an issue price of 102.674% of par, resulting in net proceeds to us of approximately $127.3 million after underwriting discounts and estimated offering expenses payable by us. The 5.20% Notes issued in December 2019 and July 2020 have identical terms as, and are a part of a single series with, the 5.20% Notes issued in April 2019, all of which are scheduled to mature on May 1, 2024. The aggregate net proceeds from the

70


Table of Contents

5.20% Notes issuances were used to repay a portion of the borrowings outstanding under the Credit Facility. The 5.20% Notes are unsecured obligations and rank pari passu with our current and future unsecured indebtedness; senior to any of our future indebtedness that expressly provides it is subordinated to the 5.20% Notes; effectively subordinated to all of our existing and future secured indebtedness, to the extent of the value of the assets securing such indebtedness, including borrowings under our Credit Facility; and structurally subordinated to all existing and future indebtedness and other obligations of any of our subsidiaries, including without limitation, the indebtedness of the Funds. The 5.20% Notes may be redeemed in whole or in part at any time at our option subject to certain make-whole provisions. The 5.20% Notes bear interest at a rate of 5.20% per year payable semiannually on May 1 and November 1 of each year. We may from time to time repurchase the 5.20% Notes in accordance with the 1940 Act and the rules promulgated thereunder. As of December 31, 2020, the outstanding balance of the 5.20% Notes was $450.0 million.

The indenture governing the 5.20% Notes (the “5.20% Notes Indenture”) contains certain covenants, including covenants requiring our compliance with (regardless of whether we are subject to) the asset coverage requirements set forth in Section 18(a)(1)(A) as modified by Section 61(a)(1) of the 1940 Act, as well as covenants requiring us to provide financial information to the holders of the 5.20% Notes and the Trustee if we cease to be subject to the reporting requirements of the Exchange Act. These covenants are subject to limitations and exceptions that are described in the 5.20% Notes Indenture.

We maintain a program with certain selling agents through which we can sell shares of our common stock by means of at-the-market offerings from time to time (the “ATM Program”).

During the year ended December 31, 2020, we sold 2,645,778 shares of our common stock at a weighted-average price of $32.10 per share and raised $84.9 million of gross proceeds under the ATM Program. Net proceeds were $83.8 million after commissions to the selling agents on shares sold and offering costs. As of December 31, 2020, sales transactions representing 87,179 shares had not settled and are not included in shares issued and outstanding on the face of the consolidated balance sheet but are included in the weighted-average shares outstanding in the consolidated statement of operations and in the shares used to calculate net asset value per share. As of December 31, 2020, 5,713,372 shares remained available for sale under the ATM Program.

During the year ended December 31, 2019, we sold 2,247,187 shares of our common stock at a weighted-average price of $40.05 per share and raised $90.0 million of gross proceeds under the ATM Program. Net proceeds were $88.8 million after commissions to the selling agents on shares sold and offering costs.

We anticipate that we will continue to fund our investment activities through existing cash and cash equivalents, cash flows generated through our ongoing operating activities, utilization of available borrowings under our Credit Facility, and a combination of future issuances of debt and equity capital. Our primary uses of funds will be investments in portfolio companies, operating expenses and cash distributions to holders of our common stock.

We periodically invest excess cash balances into marketable securities and idle funds investments. The primary investment objective of marketable securities and idle funds investments is to generate incremental cash returns on excess cash balances prior to utilizing those funds for investment in our LMM, Middle Market and Private Loan portfolio investments. Marketable securities and idle funds investments generally consist of debt investments, independently rated debt investments, certificates of deposit with financial institutions, diversified bond funds and publicly traded debt and equity investments.

If our common stock trades below our net asset value per share, we will generally not be able to issue additional common stock at the market price, unless our stockholders approve such a sale and our Board of Directors makes certain determinations. We did not seek stockholder authorization to sell shares of our common stock below the then current net asset value per share of our common stock at our 2020 annual meeting of stockholders because our common stock price per share has generally traded significantly above the net asset value per share of our common stock since 2011. We would therefore need future approval from our stockholders to issue shares below the then current net asset value per share.

71


Table of Contents

In order to satisfy the Code requirements applicable to a RIC, we intend to distribute to our stockholders, after consideration and application of our ability under the Code to carry forward certain excess undistributed taxable income from one tax year into the next tax year, substantially all of our taxable income. In addition, as a BDC, we generally are required to meet a coverage ratio of total assets to total senior securities, which include borrowings and any preferred stock we may issue in the future, of at least 200% (or 150% if certain requirements are met). This requirement limits the amount that we may borrow. In January 2008, we received an exemptive order from the SEC to exclude SBA-guaranteed debt securities issued by MSMF and any other wholly owned subsidiaries of ours which operate as SBICs from the asset coverage requirements of the 1940 Act as applicable to us, which, in turn, enables us to fund more investments with debt capital.

Although we have been able to secure access to additional liquidity, including through the Credit Facility, public debt issuances, leverage available through the SBIC program and equity offerings, there is no assurance that debt or equity capital will be available to us in the future on favorable terms, or at all.

Recently Issued or Adopted Accounting Standards

From time to time, new accounting pronouncements are issued by the FASB or other standards setting bodies that are adopted by us as of the specified effective date. We believe that the impact of recently issued standards and any that are not yet effective will not have a material impact on our consolidated financial statements upon adoption. For a description of recently issued or adopted accounting standards, see Note B.13 to the consolidated financial statements included in “Item 8. Consolidated Financial Statements and Supplementary Data” of this Annual Report on Form 10-K.

Inflation

Inflation has not had a significant effect on our results of operations in any of the reporting periods presented herein. However, our portfolio companies have experienced, and may in the future experience, the impacts of inflation on their operating results, including periodic escalations in their costs for labor, raw materials and third-party services and required energy consumption.

Off-Balance Sheet Arrangements

We may be a party to financial instruments with off-balance sheet risk in the normal course of business to meet the financial needs of our portfolio companies. These instruments include commitments to extend credit and fund equity capital and involve, to varying degrees, elements of liquidity and credit risk in excess of the amount recognized in the balance sheet. At December 31, 2020, we had a total of $137.1 million in outstanding commitments comprised of (i) forty-three investments with commitments to fund revolving loans that had not been fully drawn or term loans with additional commitments not yet funded and (ii) nine investments with equity capital commitments that had not been fully called.

Contractual Obligations

As of December 31, 2020, the future fixed commitments for cash payments in connection with our SBIC debentures, the 4.50% Notes, the 5.20% Notes and rent obligations under our office lease for each of the next five years and thereafter are as follows (dollars in thousands):


2021


2022


2023


2024


2025


Thereafter


Total

SBIC debentures

$

40,000

$

-

$

16,000

$

63,800

$

-

$

190,000

$

309,800

Interest due on SBIC debentures

9,766

8,784

8,530

7,082

5,859

14,869

54,890

4.50% Notes due 2022

-

185,000

-

-

-

-

185,000

Interest due on 4.50% Notes due 2022

8,325

8,325

-

-

-

-

16,650

5.20% Notes due 2024

-

-

-

450,000

-

-

450,000

Interest due on 5.20% Notes due 2024

23,400

23,400

23,400

11,700

-

-

81,900

Operating Lease Obligation (1)

776

790

804

818

832

1,779

5,799

Total

$

82,267

$

226,299

$

48,734

$

533,400

$

6,691

$

206,648

$

1,104,039

72


Table of Contents


(1)Operating Lease Obligation means a rent payment obligation under a lease classified as an operating lease and disclosed pursuant to ASC 842, as may be modified or supplemented.

As of December 31, 2020, we had $269.0 million in borrowings outstanding under our Credit Facility, and the Credit Facility is currently scheduled to mature in September 2023. The Credit Facility contains two, one-year extension options which could extend the maturity to September 2025, subject to lender approval. See further discussion of the Credit Facility terms above in “—Liquidity and Capital Resources—Capital Resources.”

Related Party Transactions

As discussed further above, the External Investment Manager is treated as a wholly owned portfolio company of MSCC and is included as part of our Investment Portfolio. At December 31, 2020, we had a receivable of approximately $3.5 million due from the External Investment Manager, which included approximately $2.4 million related primarily to operating expenses incurred by us as required to support the External Investment Manager’s business and amounts due from the External Investment Manager to Main Street under a tax sharing agreement (see further discussion in Note D to the consolidated financial statements included in “Item 8. Consolidated Financial Statements and Supplementary Data” of this Annual Report on Form 10-K) and approximately $1.1 million of dividends declared but not paid by the External Investment Manager. We have entered into an agreement with the External Investment Manager to share employees in connection with its asset management business generally, and specifically for the External Investment Manager’s relationship with MSC Income and its other clients. See Note A.1 and Note D to the consolidated financial statements included in “Item 8. Consolidated Financial Statements and Supplementary Data” of this Annual Report on Form 10-K for more information regarding the External Investment Manager.

In November 2015, our Board of Directors approved and adopted the Main Street Capital Corporation Deferred Compensation Plan (the “2015 Deferred Compensation Plan”). The 2015 Deferred Compensation Plan became effective on January 1, 2016 and replaced the Deferred Compensation Plan for Non-Employee Directors previously adopted by the Board of Directors in June 2013 (the “2013 Deferred Compensation Plan”). Under the 2015 Deferred Compensation Plan, non-employee directors and certain key employees may defer receipt of some or all of their cash compensation and directors’ fees, subject to certain limitations. Individuals participating in the 2015 Deferred Compensation Plan receive distributions of their respective balances based on predetermined payout schedules or other events as defined by the plan and are also able to direct investments made on their behalf among investment alternatives permitted from time to time under the plan, including phantom Main Street stock units. As of December 31, 2020, $11.9 million of compensation and dividend reinvestments net of unrealized gains and losses and distributions had been deferred under the 2015 Deferred Compensation Plan (including amounts previously deferred under the 2013 Deferred Compensation Plan).  Of this amount, $5.2 million had been deferred into phantom Main Street stock units, representing 160,352 shares of our common stock. Any amounts deferred under the plan represented by phantom Main Street stock units will not be issued or included as outstanding on the consolidated statements of changes in net assets until such shares are actually distributed to the participant in accordance with the plan, but the related phantom stock units are included in weighted-average shares outstanding with the related dollar amount of the deferral included in total expenses in Main Street’s consolidated statements of operations as earned. The dividend amounts related to additional phantom stock units are included in the statements of changes in net assets as an increase to dividends to stockholders offset by a corresponding increase to additional paid-in capital.

In December 2020, the External Investment Manager entered into an Investment Management Agreement with the Private Loan Fund, pursuant to which the External Investment Manager provides investment advisory and management services to the Private Loan Fund in exchange for an asset-based fee and certain incentive fees. The Private Loan Fund is a private investment fund exempt from registration under the 1940 Act that invests in debt investments in middle market companies generally with EBITDA between $7.5 million and $50 million and generally owned by a private equity sponsor, which we generally refer to as “Private Loan” investments. In connection with the Private Loan Fund’s initial closing in December 2020, we committed to contribute up to $10.0 million as a limited partner and will be entitled to distributions on such interest. In addition, certain of our officers and employees (and certain of their immediate family members) made capital commitments to the Private Loan Fund as limited partners and therefore have direct pecuniary interest in the Private Loan Fund.

73


Table of Contents

From time to time, we may make investments in clients of the External Investment Manager in the form of debt capital on terms approved by our Board of Directors. In January 2021, we entered into a Term Loan Agreement with MSC Income (the “Term Loan Agreement”). The Term Loan Agreement was unanimously approved by our Board, including each director who is not an “interested person,” as such term is defined in Section 2(a)(19) of the 1940 Act and the board of directors of MSC Income, including each director who is not an “interested person” of MSC Income or the External Investment Manager. The Term Loan Agreement provides for a term loan of $40.0 million to MSC Income, bearing interest at a fixed rate of 5.00% per annum, and matures in January 2026. Borrowings under the Term Loan Agreement are expressly subordinated and junior in right of payment to all secured indebtedness of MSC Income and are subject to a two-year no-call period that expires on January 27, 2023. Additionally, we have provided the Private Loan Fund with a revolving line of credit pursuant to an Unsecured Revolving Promissory Note, dated February 5, 2021 (the “Private Loan Fund Loan”), in an aggregate amount equal to the amount of limited partner capital commitments to the Private Loan Fund up to $50.0 million. Borrowings under the Private Loan Fund Loan bear interest at a fixed rate of 5.00% per annum and will mature on the earlier of June 30, 2022 and the date of the Private Loan Fund’s final closing.

Recent Developments

In January 2021, we issued $300.0 million in aggregate principal amount of 3.00% unsecured notes due July 14, 2026 (the “3.00% Notes”) at an issue price of 99.004%. The total net proceeds from the 3.00% Notes, resulting from the issue price and after underwriting discounts and estimated offering expenses payable, were approximately $294.8 million.

During February 2021, we declared monthly dividends of $0.205 per share for each month of April, May and June 2021. These monthly dividends equal a total of $0.615 per share for the second quarter of 2021, unchanged from the monthly dividends paid in the second quarter of 2020. Including the monthly dividends declared for the second quarter of 2021, we will have paid $30.830 per share in cumulative dividends since our October 2007 initial public offering.

Item 7A. Quantitative and Qualitative Disclosures about Market Risk

We are subject to financial market risks, including changes in interest rates, and changes in interest rates may affect both our interest expense on the debt outstanding under our Credit Facility and our interest income from portfolio investments. Our risk management systems and procedures are designed to identify and analyze our risk, to set appropriate policies and limits and to continually monitor these risks. Our investment income will be affected by changes in various interest rates, including LIBOR and prime rates, to the extent that any debt investments include floating interest rates. See “Risk Factors — Risks Relating to Our Investments — Changes relating to the LIBOR calculation process, the phase-out of LIBOR and the use of replacement rates for LIBOR may adversely affect the value of our portfolio securities.” and “Risk Factors — Risks Relating to Our Investments — Changes in interest rates may affect our cost of capital, net investment income and value of our investments.” for more information regarding risks associated with our debt investments and borrowings that utilize LIBOR as a reference rate.

The majority of our debt investments are made with either fixed interest rates or floating rates that are subject to contractual minimum interest rates for the term of the investment. As of December 31, 2020, approximately 71% of our debt investment portfolio (at cost) bore interest at floating rates, 87% of which were subject to contractual minimum interest rates. Our interest expense will be affected by changes in the published LIBOR rate in connection with our Credit Facility; however, the interest rates on our outstanding SBIC debentures, and the outstanding Notes, which collectively comprise the majority of our outstanding debt, are fixed for the life of such debt. As of December 31, 2020, we had not entered into any interest rate hedging arrangements. Due to our limited use of derivatives, we have claimed an exclusion from the definition of the term “commodity pool operator” under the Commodity Exchange Act and, therefore, are not subject to registration or regulation as a pool operator under such Act. The following table shows the

74


Table of Contents

approximate annualized increase or decrease in the components of net investment income due to hypothetical base rate changes in interest rates, assuming no changes in our investments and borrowings as of December 31, 2020.


Increase


(Increase)


Increase


Increase

(Decrease)

Decrease

(Decrease) in Net

(Decrease) in Net

in Interest

in Interest

Investment

Investment

Basis Point Change


Income


Expense


Income


Income per Share

(dollars in thousands, except per share amounts)

(150)

$

(397)

$

416

$

19

$

(125)


(397)


416


19


(100)


(388)


416


28


(75)


(380)


416


36


(50)


(371)


416


45


(25)


(363)


416


53


25


477


(673)


(196)


50


985


(1,345)


(360)


(0.01)

75

1,647

(2,018)

(371)

(0.01)

100


4,009


(2,690)


1,319


0.02

125

6,845

(3,363)

3,482

0.05

150

10,024

(4,035)

5,989

0.09

The hypothetical results assume that all LIBOR and prime rate changes would be effective on the first day of the period. However, the contractual LIBOR and prime rate reset dates would vary throughout the period, on either a monthly or quarterly basis, for both our investments and our Credit Facility. The hypothetical results would also be impacted by the changes in the amount of debt outstanding under our Credit Facility (with an increase (decrease) in the debt outstanding under the Credit Facility resulting in an (increase) decrease in the hypothetical interest expense).

75


Table of Contents

Item 8. Consolidated Financial Statements and Supplementary Data

Index to Consolidated Financial Statements

Reports of Independent Registered Public Accounting Firm

77

Consolidated Balance Sheets—As of December 31, 2020 and December 31, 2019

82

Consolidated Statements of Operations—For the years ended December 31, 2020, 2019 and 2018

83

Consolidated Statements of Changes in Net Assets—For the years ended December 31, 2020, 2019 and 2018

84

Consolidated Statements of Cash Flows— For the years ended December 31, 2020, 2019 and 2018

85

Consolidated Schedule of Investments—December 31, 2020

86

Consolidated Schedule of Investments—December 31, 2019

108

Notes to Consolidated Financial Statements

129

Consolidated Schedules of Investments in and Advances to Affiliates— For the years ended December 31, 2020 and 2019

169

76


Table of Contents

Report of Independent Registered Public Accounting Firm

Board of Directors and Stockholders

Main Street Capital Corporation

Opinion on the financial statements

We have audited the accompanying consolidated balance sheets of Main Street Capital Corporation (a Maryland corporation) and subsidiaries (the “Company”), including the consolidated schedule of investments, as of December 31, 2020 and 2019, the related consolidated statements of operations, changes in net assets, and cash flows for each of the three years in the period ended December 31, 2020, and the related notes (collectively referred to as the “financial statements”) and the financial highlights for each of the five years in the period ended December 31, 2020. In our opinion, the financial statements present fairly, in all material respects, the financial position of the Company as of December 31, 2020 and 2019, and the results of its operations, changes in net assets and its cash flows for each of the three years in the period ended December 31, 2020, and the financial highlights for each of the five years in the period ended December 31, 2020, in conformity with accounting principles generally accepted in the United States of America.

We also have audited, in accordance with the standards of the Public Company Accounting Oversight Board (United States) (“PCAOB”), the Company’s internal control over financial reporting as of December 31, 2020, based on criteria established in the 2013 Internal Control — Integrated Framework issued by the Committee of Sponsoring Organizations of the Treadway Commission (“COSO”), and our report dated February 26, 2021 expressed an unqualified opinion.

Basis for opinion

These financial statements are the responsibility of the Company’s management. Our responsibility is to express an opinion on the Company’s financial statements based on our audits. We are a public accounting firm registered with the PCAOB and are required to be independent with respect to the Company in accordance with the U.S. federal securities laws and the applicable rules and regulations of the Securities and Exchange Commission and the PCAOB.

We conducted our audits in accordance with the standards of the PCAOB. Those standards require that we plan and perform the audit to obtain reasonable assurance about whether the financial statements are free of material misstatement, whether due to error or fraud. Our audits included performing procedures to assess the risks of material misstatement of the financial statements, whether due to error or fraud, and performing procedures that respond to those risks. Such procedures included examining, on a test basis, evidence regarding the amounts and disclosures in the financial statements. Our audits also included evaluating the accounting principles used and significant estimates made by management, as well as evaluating the overall presentation of the financial statements. Our procedures included verification by confirmation of securities as of December 31, 2020 and 2019, by correspondence with custodians, portfolio companies or agents, or by other appropriate auditing procedures where replies were not received. We believe that our audits provide a reasonable basis for our opinion.

Critical audit matters

The critical audit matter communicated below is a matter arising from the current period audit of the financial statements that was communicated or required to be communicated to the audit committee and that: (1) relates to accounts or disclosures that are material to the financial statements and (2) involved our especially challenging, subjective, or complex judgments. The communication of critical audit matters does not alter in any way our opinion on the financial statements, taken as a whole, and we are not, by communicating the critical audit matter below, providing a separate opinion on the critical audit matter or on the accounts or disclosures to which it relates.

77


Table of Contents

Fair Value Investments

As described further in Note C to the financial statements, the Company’s investments at fair value were $2,684,866 thousand at December 31, 2020 and were measured using significant unobservable inputs and assumptions, categorized as Level 3 investments within the fair value hierarchy. Investment values are generally based on prices or valuation techniques, such as the income and market approach, that require inputs that are significant to the overall fair value measurement, and are observable in non-active markets or unobservable. The significant unobservable inputs disclosed by management include, among others, weighted-average cost of capital (“WACC”) inputs and market multiples for equity investments, and risk adjusted discount rates, percentage of expected principal recovery and third-party quotes for debt investments. Changes in these assumptions could have a significant impact on the determination of fair value. As such, we identified fair value of investments as a critical audit matter.

The principal considerations for our determination that fair value of Level 3 investments are a critical audit matter are the significant management judgements used in developing complex valuation techniques and inherent estimation uncertainty. Auditing these investments requires a high degree of auditor judgement and subjectivity, in addition to the use of valuation professionals with specialized skills and knowledge, to evaluate the reasonableness of unobservable inputs and assumptions.

The primary procedures we performed to address this critical audit matter included:

Testing the design and operating effectiveness of controls over management’s process to determine investment fair value. Specifically, we identified and tested key attributes of management’s fair value determination review. These attributes addressed the relevance, adequacy and appropriateness of the data, assumptions, valuation methods, and mathematical accuracy used to determine investment fair value as of the reporting date.
With the assistance of internal valuation specialists to evaluate and test management’s process to develop the valuation estimates or develop an independent expectation, we performed substantive audit procedures to determine mathematical accuracy and to determine that the data, valuation methods, and significant unobservable inputs and assumptions used to determine investment fair value as of the Company’s reporting date were reasonable. Certain key inputs/assumptions tested by us for a sample of investments, included the following:
enterprise values,
weighted average cost of capital (“WACC”),
discount rates,
forecasted cash flows and long-term growth rates,
discount for lack of marketability,
market multiples,
weighting between valuation techniques,
risk adjusted discount factor,
percentage of expected principal recovery,
third party quotes, in conjunction with other inputs, and
78

Table of Contents
third-party appraisals.
In testing the above, we considered available third-party market information and published studies, current economic conditions and subsequent events, and other information that could be corroborated to source information.

/s/ GRANT THORNTON LLP

We have served as the Company’s auditor since 2007.

Houston, Texas

February 26, 2021

79


Table of Contents

Report of Independent Registered Public Accounting Firm

Board of Directors and Stockholders

Main Street Capital Corporation

Opinion on internal control over financial reporting

We have audited the internal control over financial reporting of Main Street Capital Corporation (a Maryland corporation) and subsidiaries (the “Company”) as of December 31, 2020, based on criteria established in the 2013 Internal Control — Integrated Framework issued by the Committee of Sponsoring Organizations of the Treadway Commission (“COSO”). In our opinion, the Company maintained, in all material respects, effective internal control over financial reporting as of December 31, 2020, based on criteria established in the 2013 Internal Control — Integrated Framework issued by COSO.

We also have audited, in accordance with the standards of the Public Company Accounting Oversight Board (United States) (“PCAOB”), the consolidated financial statements of the Company as of and for the year ended December 31, 2019, and our report dated February 26, 2021 expressed an unqualified opinion on those financial statements.

Basis for opinion

The Company’s management is responsible for maintaining effective internal control over financial reporting and for its assessment of the effectiveness of internal control over financial reporting, included in the accompanying Management’s Report on Internal Control over Financial Reporting. Our responsibility is to express an opinion on the Company’s internal control over financial reporting based on our audit. We are a public accounting firm registered with the PCAOB and are required to be independent with respect to the Company in accordance with the U.S. federal securities laws and the applicable rules and regulations of the Securities and Exchange Commission and the PCAOB.

We conducted our audit in accordance with the standards of the PCAOB. Those standards require that we plan and perform the audit to obtain reasonable assurance about whether effective internal control over financial reporting was maintained in all material respects. Our audit included obtaining an understanding of internal control over financial reporting, assessing the risk that a material weakness exists, testing and evaluating the design and operating effectiveness of internal control based on the assessed risk, and performing such other procedures as we considered necessary in the circumstances. We believe that our audit provides a reasonable basis for our opinion.

Definition and limitations of internal control over financial reporting

A company’s internal control over financial reporting is a process designed to provide reasonable assurance regarding the reliability of financial reporting and the preparation of financial statements for external purposes in accordance with generally accepted accounting principles. A company’s internal control over financial reporting includes those policies and procedures that (1) pertain to the maintenance of records that, in reasonable detail, accurately and fairly reflect the transactions and dispositions of the assets of the company; (2) provide reasonable assurance that transactions are recorded as necessary to permit preparation of financial statements in accordance with generally accepted accounting principles, and that receipts and expenditures of the company are being made only in accordance with authorizations of management and directors of the company; and (3) provide reasonable assurance regarding prevention or timely detection of unauthorized acquisition, use, or disposition of the company’s assets that could have a material effect on the financial statements.

80


Table of Contents

Because of its inherent limitations, internal control over financial reporting may not prevent or detect misstatements. Also, projections of any evaluation of effectiveness to future periods are subject to the risk that controls may become inadequate because of changes in conditions, or that the degree of compliance with the policies or procedures may deteriorate.

/s/ GRANT THORNTON LLP

Houston, Texas

February 26, 2021

81


Table of Contents

MAIN STREET CAPITAL CORPORATION

Consolidated Balance Sheets

(dollars in thousands, except shares and per share amounts)

December 31, 

December 31, 


2020


2019

ASSETS


Investments at fair value:


Control investments (cost: $831,490 and $778,367 as of December 31, 2020 and December 31, 2019, respectively)

$

1,113,725

$

1,032,721

Affiliate investments (cost: $416,479 and $351,764 as of December 31, 2020 and December 31, 2019, respectively)


366,301


330,287

Non‑Control/Non‑Affiliate investments (cost: $1,268,740 and $1,297,587 as of December 31, 2020 and December 31, 2019, respectively)


1,204,840


1,239,316

Total investments (cost: $2,516,709 and $2,427,718 as of December 31, 2020 and December 31, 2019, respectively)


2,684,866


2,602,324

Cash and cash equivalents


31,919


55,246

Interest receivable and other assets


49,761


50,458

Deferred financing costs (net of accumulated amortization of $8,477 and $7,501 as of December 31, 2020 and December 31, 2019, respectively)


2,818


3,521

Total assets

$

2,769,364

$

2,711,549

LIABILITIES


Credit facility

$

269,000

$

300,000

SBIC debentures (par: $309,800 ($40,000 due within one year) and $311,800 as of December 31, 2020 and December 31, 2019, respectively)


303,972


306,188

5.20% Notes due 2024 (par: $450,000 and $325,000 as of December 31, 2020 and December 31, 2019, respectively)


451,817


324,595

4.50% Notes due 2022 (par: $185,000 as of both December 31, 2020 and December 31, 2019)


183,836


183,229

Accounts payable and other liabilities


20,833


24,532

Interest payable


8,658


7,292

Dividend payable


13,889


13,174

Deferred tax liability, net


2,592


16,149

Total liabilities


1,254,597


1,175,159

Commitments and contingencies (Note K)


NET ASSETS


Common stock, $0.01 par value per share (150,000,000 shares authorized; 67,674,853 and 64,241,341 shares issued and outstanding as of December 31, 2020 and December 31, 2019, respectively)


677


643

Additional paid‑in capital


1,615,940


1,512,435

Total undistributed (overdistributed) earnings


(101,850)


23,312

Total net assets


1,514,767


1,536,390

Total liabilities and net assets

$

2,769,364

$

2,711,549

NET ASSET VALUE PER SHARE

$

22.35

$

23.91

The accompanying notes are an integral part of these consolidated financial statements

82


Table of Contents

MAIN STREET CAPITAL CORPORATION

Consolidated Statements of Operations

(dollars in thousands, except shares and per share amounts)


Twelve Months Ended December 31, 

2020


2019


2018

INVESTMENT INCOME:


Interest, fee and dividend income:


Control investments

$

81,155

$

92,414

$

85,853

Affiliate investments


32,435


34,732


36,800

Non‑Control/Non‑Affiliate investments


109,024


116,227


110,702

Total investment income


222,614


243,373


233,355

EXPENSES:


Interest


(49,587)


(50,258)


(43,493)

Compensation


(18,981)


(19,792)


(18,966)

General and administrative


(12,702)


(12,546)


(11,868)

Share‑based compensation


(10,828)


(10,083)


(9,151)

Expenses allocated to the External Investment Manager


7,429


6,672


6,768

Total expenses


(84,669)


(86,007)


(76,710)

NET INVESTMENT INCOME


137,945


157,366


156,645

NET REALIZED GAIN (LOSS):


Control investments


(59,594)


4,797


4,681

Affiliate investments


2,203


(565)


20

Non‑Control/Non‑Affiliate investments


(58,556)


(19,344)


(3,360)

Realized loss on extinguishment of debt


(534)


(5,689)


(2,896)

Total net realized loss


(116,481)


(20,801)


(1,555)

NET UNREALIZED APPRECIATION (DEPRECIATION):


Control investments


37,924


(980)


37,826

Affiliate investments


(29,038)


990


12,062

Non‑Control/Non‑Affiliate investments


(14,968)


(10,214)


(31,907)

SBIC debentures


460


4,450


1,294

Total net unrealized appreciation (depreciation)


(5,622)


(5,754)


19,275

INCOME TAXES:


Federal and state income, excise and other taxes


(590)


(3,546)


(319)

Deferred taxes


14,131


2,304


(5,833)

Income tax benefit (provision)


13,541


(1,242)


(6,152)

NET INCREASE (DECREASE) IN NET ASSETS RESULTING FROM OPERATIONS

$

29,383

$

129,569

$

168,213

NET INVESTMENT INCOME PER SHARE—BASIC AND DILUTED

$

2.10

$

2.50

$

2.60

NET INCREASE (DECREASE) IN NET ASSETS RESULTING FROM OPERATIONS PER
SHARE—BASIC AND DILUTED

$

0.45

$

2.06

$

2.80

WEIGHTED AVERAGE SHARES
OUTSTANDING—BASIC AND DILUTED


65,705,963


62,960,591


60,176,843

The accompanying notes are an integral part of these consolidated financial statements

83


Table of Contents

MAIN STREET CAPITAL CORPORATION

Consolidated Statements of Changes in Net Assets

(dollars in thousands, except shares)

Common Stock

Additional

Total

Number of

Par

PaidIn

Undistributed

Total Net


Shares


Value


Capital


Earnings


Asset Value

Balances at December 31, 2017


58,660,680

$

586

$

1,310,780

$

69,002

$

1,380,368

Public offering of common stock, net of offering costs


2,069,103


21


78,373


78,394

Share‑based compensation


9,151


9,151

Purchase of vested stock for employee payroll tax withholding


(109,693)


(1)


(4,076)


(4,077)

Dividend reinvestment


394,403


4


14,870


14,874

Amortization of directors’ deferred compensation


850


850

Issuance of restricted stock, net of forfeited shares


250,368


3


(3)


Dividends to stockholders


(171,724)


(171,724)

Net increase resulting from operations


168,213


168,213

Balances at December 31, 2018


61,264,861

$

613

$

1,409,945

$

65,491

$

1,476,049

Public offering of common stock, net of offering costs


2,259,729


23


89,246


89,269

Share‑based compensation


10,083


10,083

Purchase of vested stock for employee payroll tax withholding


(103,730)


(1)


(3,941)


(3,942)

Dividend reinvestment


441,927


4


18,081


18,085

Amortization of directors’ deferred compensation


866


866

Issuance of restricted stock, net of forfeited shares


390,150


4


(4)


Dividends to stockholders


401


(183,990)


(183,589)

Reclassification for certain permanent book-to-tax differences

(12,242)

12,242

Net increase resulting from operations


129,569


129,569

Balances at December 31, 2019


64,252,937

$

643

$

1,512,435

$

23,312

$

1,536,390

Public offering of common stock, net of offering costs


2,662,777


27


84,354


84,381

Share‑based compensation


10,828


10,828

Purchase of vested stock for employee payroll tax withholding


(89,447)


(1)


(1,890)


(1,891)

Dividend reinvestment


517,796


4


16,230


16,234

Amortization of directors’ deferred compensation


853


853

Issuance of restricted stock, net of forfeited shares


417,969


4


(4)


Dividends to stockholders


385


(161,796)


(161,411)

Reclassification for certain permanent book-to-tax differences


(7,251)


7,251


Net increase resulting from operations


29,383


29,383

Balances at December 31, 2020


67,762,032

$

677

$

1,615,940

$

(101,850)

$

1,514,767

The accompanying notes are an integral part of these consolidated financial statements

84


Table of Contents

MAIN STREET CAPITAL CORPORATION

Consolidated Statements of Cash Flows

(dollars in thousands)

Year Ended


December 31, 

2020


2019


2018

CASH FLOWS FROM OPERATING ACTIVITIES

Net increase in net assets resulting from operations

$

29,383

$

129,569

$

168,213

Adjustments to reconcile net increase (decrease) in net assets resulting from operations to net cash provided by (used in) operating activities:

Investments in portfolio companies

(669,007)

(664,062)

(962,456)

Proceeds from sales and repayments of debt investments in portfolio companies

443,573

439,363

626,059

Proceeds from sales and return of capital of equity investments in portfolio companies

34,439

38,536

77,103

Net unrealized (appreciation) depreciation

5,622

5,754

(19,275)

Net realized loss

116,481

20,801

1,555

Accretion of unearned income

(11,756)

(12,070)

(14,724)

Payment-in-kind interest

(6,225)

(5,018)

(2,304)

Cumulative dividends

(1,791)

(2,382)

(2,301)

Share-based compensation expense

10,828

10,083

9,151

Amortization of deferred financing costs

2,513

3,717

3,299

Deferred tax (benefit) provision

(14,131)

(2,304)

5,833

Changes in other assets and liabilities:

Interest receivable and other assets

4,599

(6,680)

(2,276)

Interest payable

1,366

1,251

768

Accounts payable and other liabilities

(2,846)

7,436

(1,356)

Deferred fees and other

2,868

2,172

3,645

Net cash used in operating activities

(54,084)

(33,834)

(109,066)

CASH FLOWS FROM FINANCING ACTIVITIES

Proceeds from public offering of common stock, net of offering costs

84,381

89,269

78,394

Proceeds from public offering of 5.20% Notes due 2024

125,000

325,000

-

Dividends paid

(144,462)

(164,278)

(156,048)

Proceeds from issuance of SBIC debentures

40,000

-

54,000

Repayments of SBIC debentures

(42,000)

(34,000)

(4,000)

Redemption of 6.125% Notes

-

-

(90,655)

Redemption of 4.50% Notes due 2019

-

(175,000)

-

Proceeds from credit facility

399,000

639,000

632,000

Repayments on credit facility

(430,000)

(640,000)

(395,000)

Debt issuance premiums (costs), net

729

(1,150)

(2,895)

Purchases of vested stock for employee payroll tax withholding

(1,891)

(3,942)

(4,077)

Net cash provided by financing activities

30,757

34,899

111,719

Net increase (decrease) in cash and cash equivalents

(23,327)

1,065

2,653

CASH AND CASH EQUIVALENTS AT BEGINNING OF PERIOD

55,246

54,181

51,528

CASH AND CASH EQUIVALENTS AT END OF PERIOD

$

31,919

$

55,246

$

54,181

Supplemental cash flow disclosures:

Interest paid

$

45,582

$

45,167

$

39,300

Taxes paid

$

3,136

$

2,300

$

5,112

Operating non-cash activities:

Right-of-use assets obtained in exchange for operating lease liabilities

$

-

$

5,240

$

-

Non-cash financing activities:

Shares issued pursuant to the DRIP

$

16,234

$

18,085

$

14,874

The accompanying notes are an integral part of these consolidated financial statements

85


Table of Contents

MAIN STREET CAPITAL CORPORATION

Consolidated Schedule of Investments

December 31, 2020

(dollars in thousands)

Portfolio Company (1) (20)

Investment
Date (24)

Business
Description

Type of
Investment (2)
 (3) (15)

Shares/Units

Rate

Maturity
Date

Principal (4)

Cost (4)

Fair
Value (18)

Control Investments (5)

ASC Interests, LLC

August 1, 2013

Recreational and Educational Shooting Facility

Secured Debt

13.00%

7/31/2022

$

1,750

$

1,715

$

1,715

Member Units

1,500

1,500

1,120

3,215

2,835

Analytical Systems Keco, LLC

August 16, 2019

Manufacturer of Liquid and Gas Analyzers

Secured Debt

12.00% (L+10.00%, Floor 2.00%)

8/16/2024

5,155

4,874

4,874

(9)

Preferred Member Units

3,200

3,200

3,200

Warrants

420

8/16/2029

316

10

(27)

8,390

8,084

ATS Workholding, LLC

(10)

March 10, 2014

Manufacturer of Machine Cutting Tools and Accessories

Secured Debt

5.00%

11/16/2021

4,982

4,824

3,347

(14)

Preferred Member Units

3,725,862

3,726

-

8,550

3,347

Project BarFly, LLC

(10)

August 31, 2015

Casual Restaurant Group

Secured Debt

7.00%

10/31/2024

343

343

343

Member Units

37

1,584

1,584

1,927

1,927

Bolder Panther Group, LLC

December 31, 2020

Consumer Goods and Fuel Retailer

Secured Debt

10.50% (L+9.00%, Floor 1.50%)

12/31/2025

27,500

27,225

27,225

(9)

Class A Preferred Member Units

14.00%

10,194

10,194

(30)

Class B Preferred Member Units

140,000

14,000

14,000

(30)

51,419

51,419

Bond-Coat, Inc.

December 28, 2012

Casing and Tubing Coating Services

Common Stock

57,508

6,350

2,040

Brewer Crane Holdings, LLC

January 9, 2018

Provider of Crane Rental and Operating Services

Secured Debt

11.00% (L+10.00%, Floor 1.00%)

1/9/2023

8,556

8,513

8,513

(9)

Preferred Member Units

2,950

4,280

5,850

(8)

12,793

14,363

Bridge Capital Solutions Corporation

April 18, 2012

Financial Services and Cash Flow Solutions Provider

Secured Debt

13.00%

12/11/2024

8,813

8,403

8,403

Warrants

82

7/25/2026

2,132

3,220

(27)

Secured Debt

13.00%

12/11/2024

1,000

998

998

(30)

Preferred Member Units

17,742

1,000

1,000

(8) (30)

12,533

13,621

Café Brazil, LLC

April 20, 2004

Casual Restaurant Group

Member Units

1,233

1,742

2,030

(8)

86


Table of Contents

MAIN STREET CAPITAL CORPORATION

Consolidated Schedule of Investments (Continued)

December 31, 2020

(dollars in thousands)

Portfolio Company (1) (20)

Investment
Date (24)

Business
Description

Type of
Investment (2)
 (3) (15)

Shares/Units

Rate

Maturity
Date

Principal (4)

Cost (4)

Fair
Value (18)

California Splendor Holdings LLC

March 30, 2018

Processor of Frozen Fruits

Secured Debt

9.00% (L+8.00%, Floor 1.00%)

3/30/2023

8,100

8,014

8,043

(9)

Secured Debt

11.00% (L+10.00%, Floor 1.00%)

3/30/2023

28,000

27,854

27,789

(9)

Preferred Member Units

6,725

8,255

8,255

(8)

Preferred Member Units

6,157

10,775

6,241

(8)

54,898

50,328

CBT Nuggets, LLC

June 1, 2006

Produces and Sells IT Training Certification Videos

Member Units

416

1,300

46,080

(8)

Centre Technologies Holdings, LLC

January 4, 2019

Provider of IT Hardware Services and Software Solutions

Secured Debt

12.00% (L+10.00%, Floor 2.00%)

1/4/2024

11,628

11,549

11,549

(9)

Preferred Member Units

12,696

5,840

6,160

17,389

17,709

Chamberlin Holding LLC

February 26, 2018

Roofing and Waterproofing Specialty Contractor

Secured Debt

9.00% (L+8.00%, Floor 1.00%)

2/26/2023

15,212

15,136

15,212

(9)

Member Units

4,347

11,440

28,070

(8)

Member Units

1,047,146

1,322

1,270

(8) (30)

27,898

44,552

Charps, LLC

February 3, 2017

Pipeline Maintenance and Construction

Unsecured Debt

10.00% (8.67% Cash, 1.33% PIK)

1/31/2024

9,388

7,641

8,475

(19)

Secured Debt

15.00%

6/5/2022

669

669

669

Preferred Member Units

1,600

400

10,520

(8)

8,710

19,664

Clad-Rex Steel, LLC

December 20, 2016

Specialty Manufacturer of Vinyl-Clad Metal

Secured Debt

10.50% (L+9.50%, Floor 1.00%)

12/20/2021

10,880

10,853

10,853

(9)

Member Units

717

7,280

8,610

(8)

Secured Debt

10.00%

12/20/2036

1,111

1,100

1,100

(30)

Member Units

800

210

530

(30)

19,443

21,093

CMS Minerals Investments

January 30, 2015

Oil & Gas Exploration & Production

Member Units

100

2,179

1,624

(30)

Cody Pools, Inc.

March 6, 2020

Designer of Residential and Commercial Pools

Secured Debt

12.25% (L+10.50%, Floor 1.75%)

3/6/2025

14,216

14,092

14,216

(9)

Preferred Member Units

587

8,317

14,940

22,409

29,156

CompareNetworks Topco, LLC

January 29, 2019

Internet Publishing and Web Search Portals

Secured Debt

12.00% (L+11.00%, Floor 1.00%)

1/29/2024

7,954

7,910

7,953

(9)

Preferred Member Units

1,975

1,975

6,780

(8)

9,885

14,733

87


Table of Contents

MAIN STREET CAPITAL CORPORATION

Consolidated Schedule of Investments (Continued)

December 31, 2020

(dollars in thousands)

Portfolio Company (1) (20)

Investment
Date (24)

Business
Description

Type of
Investment (2)
 (3) (15)

Shares/Units

Rate

Maturity
Date

Principal (4)

Cost (4)

Fair
Value (18)

Copper Trail Fund Investments

(12) (13)

July 17, 2017

Investment Partnership

LP Interests (CTMH, LP)

38.8%

747

747

(31)

Datacom, LLC

May 30, 2014

Technology and Telecommunications Provider

Secured Debt

8.00%

5/31/2021

1,800

1,800

1,615

(14)

Secured Debt

10.50% PIK

5/31/2021

12,507

12,475

10,531

(14) (19)

Class A Preferred Member Units

-

1,294

-

Class B Preferred Member Units

6,453

6,030

-

21,599

12,146

Digital Products Holdings LLC

April 1, 2018

Designer and Distributor of Consumer Electronics

Secured Debt

11.00% (L+10.00%, Floor 1.00%)

4/1/2023

18,173

18,077

18,077

(9)

Preferred Member Units

3,857

9,501

9,835

(8)

27,578

27,912

Direct Marketing Solutions, Inc.

February 13, 2018

Provider of Omni-Channel Direct Marketing Services

Secured Debt

12.00% (L+11.00%, Floor 1.00%)

2/13/2023

15,090

15,007

15,007

(9)

Preferred Stock

8,400

8,400

19,380

23,407

34,387

Gamber-Johnson Holdings, LLC ("GJH")

June 24, 2016

Manufacturer of Ruggedized Computer Mounting Systems

Secured Debt

9.00% (L+7.00%, Floor 2.00%)

6/24/2021

19,838

19,807

19,838

(9)

Member Units

8,619

14,844

52,490

(8)

34,651

72,328

Garreco, LLC

July 15, 2013

Manufacturer and Supplier of Dental Products

Secured Debt

9.00% (L+8.00%, Floor 1.00%, Ceiling 1.50%)

1/31/2021

4,519

4,519

4,519

(9)

Member Units

1,200

1,200

1,410

5,719

5,929

GRT Rubber Technologies LLC ("GRT")

December 19, 2014

Manufacturer of Engineered Rubber Products

Secured Debt

7.15% (L+7.00%)

12/31/2023

16,775

16,775

16,775

Member Units

5,879

13,065

44,900

(8)

29,840

61,675

Gulf Manufacturing, LLC

August 31, 2007

Manufacturer of Specialty Fabricated Industrial Piping Products

Member Units

438

2,980

4,510

(8)

Gulf Publishing Holdings, LLC

April 29, 2016

Energy Industry Focused Media and Publishing

Secured Debt

10.50% (5.25% Cash, 5.25% PIK) (L+9.50%, Floor 1.00%)

9/30/2020

250

250

250

(9) (17) (19)

Secured Debt

12.50% (6.25% Cash, 6.25% PIK)

4/29/2021

13,147

13,135

12,044

(19)

Member Units

3,681

3,681

-

17,066

12,294

88


Table of Contents

MAIN STREET CAPITAL CORPORATION

Consolidated Schedule of Investments (Continued)

December 31, 2020

(dollars in thousands)

Portfolio Company (1) (20)

Investment
Date (24)

Business
Description

Type of
Investment (2)
 (3) (15)

Shares/Units

Rate

Maturity
Date

Principal (4)

Cost (4)

Fair
Value (18)

Harris Preston Fund Investments

(12) (13)

October 1, 2017

Investment Partnership

LP Interests (2717 MH, L.P.)

49.3%

2,599

2,702

(31)

LP Interests (2717 HPP-MS, L.P.)

49.3%

250

250

(31)

2,849

2,952

Harrison Hydra-Gen, Ltd.

June 4, 2010

Manufacturer of Hydraulic Generators

Common Stock

107,456

718

5,450

(8)

Jensen Jewelers of Idaho, LLC

November 14, 2006

Retail Jewelry Store

Secured Debt

10.00% (Prime+6.75%, Floor 2.00%)

11/14/2023

3,400

3,374

3,400

(9)

Member Units

627

811

7,620

(8)

4,185

11,020

J&J Services, Inc.

October 31, 2019

Provider of Dumpster and Portable Toilet Rental Services

Secured Debt

11.50%

10/31/2024

12,800

12,697

12,800

Preferred Stock

2,814

7,085

12,680

19,782

25,480

KBK Industries, LLC

January 23, 2006

Manufacturer of Specialty Oilfield and Industrial Products

Member Units

325

783

13,200

(8)

Kickhaefer Manufacturing Company, LLC

October 31, 2018

Precision Metal Parts Manufacturing

Secured Debt

11.50%

10/31/2023

22,415

22,269

22,269

Member Units

581

12,240

12,240

Secured Debt

9.00%

10/31/2048

3,948

3,909

3,909

Member Units

800

992

1,160

(8) (30)

39,410

39,578

Market Force Information, LLC

July 28, 2017

Provider of Customer Experience Management Services

Secured Debt

12.00% (L+11.00%, Floor 1.00%)

7/28/2023

1,600

1,600

1,600

(9)

Secured Debt

12.00% PIK

7/28/2023

26,079

25,952

13,562

(14) (19)

Member Units

743,921

16,642

-

44,194

15,162

MH Corbin Holding LLC

August 31, 2015

Manufacturer and Distributor of Traffic Safety Products

Secured Debt

13.00% (10.00% Cash, 3.00% PIK)

3/31/2022

8,570

8,527

8,280

(19)

Preferred Member Units

66,000

4,400

2,370

Preferred Member Units

4,000

6,000

-

18,927

10,650

MSC Adviser I, LLC

(16)

November 22, 2013

Third Party Investment
Advisory Services

Member Units

29,500

116,760

(8) (31)

Mystic Logistics Holdings, LLC

August 18, 2014

Logistics and Distribution Services Provider for Large Volume Mailers

Secured Debt

12.00%

1/17/2022

6,733

6,723

6,723

Common Stock

5,873

2,720

8,990

(8)

9,443

15,713

NAPCO Precast, LLC

January 31, 2008

Precast Concrete Manufacturing

Member Units

2,955

2,975

16,100

(8)

89


Table of Contents

MAIN STREET CAPITAL CORPORATION

Consolidated Schedule of Investments (Continued)

December 31, 2020

(dollars in thousands)

Portfolio Company (1) (20)

Investment
Date (24)

Business
Description

Type of
Investment (2)
 (3) (15)

Shares/Units

Rate

Maturity
Date

Principal (4)

Cost (4)

Fair
Value (18)

Nebraska Vet AcquireCo, LLC (NVS)

December 31, 2020

Mixed-Animal Veterinary and Animal Health Product Provider

Secured Debt

12.00%

12/31/2025

10,500

10,395

10,395

Preferred Member Units

6,500

6,500

6,500

16,895

16,895

NexRev LLC

February 28, 2018

Provider of Energy Efficiency Products & Services

Secured Debt

11.00%

2/28/2023

17,097

17,016

16,726

Preferred Member Units

86,400,000

6,880

1,470

(8)

23,896

18,196

NRI Clinical Research, LLC

September 8, 2011

Clinical Research Service Provider

Secured Debt

9.00%

6/8/2022

5,620

5,572

5,620

Warrants

251,723

6/8/2027

252

1,490

(27)

Member Units

1,454,167

765

5,600

(8)

6,589

12,710

NRP Jones, LLC

December 22, 2011

Manufacturer of Hoses, Fittings and Assemblies

Secured Debt

12.00%

3/20/2023

2,080

2,080

2,080

Member Units

65,962

3,717

2,821

(8)

5,797

4,901

NuStep, LLC

January 31, 2017

Designer, Manufacturer and Distributor of Fitness Equipment

Secured Debt

12.00%

1/31/2022

17,240

17,193

17,193

Preferred Member Units

406

10,200

10,780

27,393

27,973

OMi Holdings, Inc.

April 1, 2008

Manufacturer of Overhead Cranes

Common Stock

1,500

1,080

20,380

(8)

Pearl Meyer Topco LLC

April 27, 2020

Provider of Executive Compensation Consulting Services

Secured Debt

12.00%

4/27/2025

37,513

37,202

37,202

Member Units

13,800

13,000

15,940

(8)

50,202

53,142

Pegasus Research Group, LLC

January 6, 2011

Provider of Telemarketing and Data Services

Member Units

460

1,290

8,830

(8)

PPL RVs, Inc.

June 10, 2010

Recreational Vehicle Dealer

Secured Debt

7.50% (L+7.00%, Floor 0.50%)

11/15/2022

11,855

11,781

11,806

(9)

Common Stock

2,000

2,150

11,500

(8)

13,931

23,306

Principle Environmental, LLC (d/b/a TruHorizon Environmental Solutions)

February 1, 2011

Noise Abatement Service Provider

Secured Debt

13.00%

4/30/2023

6,397

6,335

6,397

Preferred Member Units

19,631

4,600

10,500

(8)

Warrants

1,018

1/31/2021

1,200

870

(27)

12,135

17,767

Quality Lease Service, LLC

June 8, 2015

Provider of Rigsite Accommodation Unit Rentals and Related Services

Member Units

1,000

11,063

4,460

90


Table of Contents

MAIN STREET CAPITAL CORPORATION

Consolidated Schedule of Investments (Continued)

December 31, 2020

(dollars in thousands)

Portfolio Company (1) (20)

Investment
Date (24)

Business
Description

Type of
Investment (2)
 (3) (15)

Shares/Units

Rate

Maturity
Date

Principal (4)

Cost (4)

Fair
Value (18)

River Aggregates, LLC

March 30, 2011

Processor of Construction Aggregates

Member Units

1,500

369

3,240

(30)

Tedder Industries, LLC

August 31, 2018

Manufacturer of Firearm Holsters and Accessories

Secured Debt

12.00%

8/31/2023

16,400

16,301

16,301

Preferred Member Units

479

8,136

8,136

24,437

24,437

Trantech Radiator Topco, LLC

May 31, 2019

Transformer Cooling Products and Services

Secured Debt

12.00%

5/31/2024

8,720

8,644

8,644

Common Stock

615

4,655

6,030

(8)

13,299

14,674

UnionRock Energy Fund II, LP

(12) (13)

June 15, 2020

Oil & Gas Exploration & Production

LP Interests

49.6%

2,894

2,894

(31)

Vision Interests, Inc.

June 5, 2007

Manufacturer / Installer of Commercial Signage

Secured Debt

13.00%

9/30/2019

2,028

2,028

2,028

(17)

Series A Preferred Stock

3,000,000

3,000

3,160

5,028

5,188

Ziegler's NYPD, LLC

October 1, 2008

Casual Restaurant Group

Secured Debt

6.50%

10/1/2022

1,000

1,000

979

Secured Debt

12.00%

10/1/2022

625

625

625

Secured Debt

14.00%

10/1/2022

2,750

2,750

2,750

Warrants

587

10/1/2025

600

-

(27)

Preferred Member Units

10,072

2,834

1,780

7,809

6,134

Subtotal Control Investments (73.5% of net assets at fair value)

$

831,490

$

1,113,725

91


Table of Contents

MAIN STREET CAPITAL CORPORATION

Consolidated Schedule of Investments (Continued)

December 31, 2020

(dollars in thousands)

Portfolio Company (1) (20)

Investment
Date (24)

Business
Description

Type of
Investment (2) (3) (15)

Shares/Units

Rate

Maturity
Date

Principal (4)

Cost (4)

Fair
Value (18)

Affiliate Investments (6)

AAC Holdings, Inc.

(11)

June 30, 2017

Substance Abuse Treatment Service Provider

Secured Debt

18.00% (10.00% Cash, 8.00% PIK)

6/25/2025

9,406

9,187

9,187

(19)

Common Stock

593,928

3,148

3,148

Warrants

554,353

12/11/2025

-

2,938

(27)

12,335

15,273

AFG Capital Group, LLC

November 7, 2014

Provider of Rent-to-Own Financing Solutions and Services

Secured Debt

10.00%

5/25/2022

491

491

491

Preferred Member Units

186

1,200

5,810

1,691

6,301

American Trailer Rental Group LLC

June 7, 2017

Provider of Short-term Trailer and Container Rental

Member Units

73,493

8,596

16,010

(30)

BBB Tank Services, LLC

April 8, 2016

Maintenance, Repair and Construction Services to the Above-Ground Storage Tank Market

Unsecured Debt

12.00% (L+11.00%, Floor 1.00%)

4/8/2021

4,800

4,773

4,722

(9)

Preferred Stock (non-voting)

15.00% PIK

151

151

(8) (19)

Member Units

800,000

800

280

5,724

5,153

Boccella Precast Products LLC

June 30, 2017

Manufacturer of Precast Hollow Core Concrete

Member Units

2,160,000

2,256

6,040

(8)

Buca C, LLC

June 30, 2015

Casual Restaurant Group

Secured Debt

10.25% (L+9.25%, Floor 1.00%)

6/30/2020

19,004

19,004

14,256

(9) (17)

Preferred Member Units

6

6.00% PIK

4,770

-

(8) (19)

23,774

14,256

CAI Software LLC

October 10, 2014

Provider of Specialized Enterprise Resource Planning Software

Secured Debt

12.50%

12/7/2023

47,474

47,133

47,474

Member Units

77,960

2,095

7,190

(8)

49,228

54,664

Chandler Signs Holdings, LLC

(10)

January 4, 2016

Sign Manufacturer

Class A Units

1,500,000

1,500

1,460

Charlotte Russe, Inc

(11)

May 28, 2013

Fast-Fashion Retailer to Young Women

Common Stock

19,041

3,141

-

Classic H&G Holdings, LLC

March 12, 2020

Provider of Engineered Packaging Solutions

Secured Debt

12.00%

3/12/2025

24,800

24,583

24,800

Preferred Member Units

154

5,760

9,510

(8)

30,343

34,310

92


Table of Contents

MAIN STREET CAPITAL CORPORATION

Consolidated Schedule of Investments (Continued)

December 31, 2020

(dollars in thousands)

Portfolio Company (1) (20)

Investment
Date (24)

Business
Description

Type of
Investment (2) (3) (15)

Shares/Units

Rate

Maturity
Date

Principal (4)

Cost (4)

Fair
Value (18)

Congruent Credit Opportunities Funds

(12) (13)

January 24, 2012

Investment Partnership

LP Interests (Congruent Credit Opportunities Fund
II, LP)

19.8%

4,449

94

(31)

LP Interests (Congruent Credit Opportunities Fund
III, LP)

17.4%

11,741

11,540

(8) (31)

16,190

11,634

Copper Trail Fund Investments

(12) (13)

July 17, 2017

Investment Partnership

LP Interests (Copper Trail Energy Fund I, LP)

12.4%

2,161

1,782

(8) (31)

Dos Rios Partners

(12) (13)

April 25, 2013

Investment Partnership

LP Interests (Dos Rios Partners, LP)

20.2%

6,605

5,417

(31)

LP Interests (Dos Rios Partners - A, LP)

6.4%

2,097

1,720

(31)

8,702

7,137

East Teak Fine Hardwoods, Inc.

April 13, 2006

Distributor of Hardwood Products

Common Stock

6,250

480

300

EIG Fund Investments

(12) (13)

November 6, 2015

Investment Partnership

LP Interests (EIG Global Private Debt Fund-A, L.P.)

11.1%

739

526

(8) (31)

Freeport Financial Funds

(12) (13)

June 13, 2013

Investment Partnership

LP Interests (Freeport Financial SBIC Fund LP)

9.3%

5,974

5,264

(31)

LP Interests (Freeport First Lien Loan Fund III LP)

6.0%

10,785

10,321

(8) (31)

16,759

15,585

Harris Preston Fund Investments

(12) (13)

August 9, 2017

Investment Partnership

LP Interests (HPEP 3, L.P.)

8.2%

3,071

3,258

(31)

Hawk Ridge Systems, LLC

(13)

December 2, 2016

Value-Added Reseller of Engineering Design and Manufacturing Solutions

Secured Debt

11.00%

12/2/2023

18,400

18,366

18,400

Preferred Member Units

226

2,850

8,030

(8)

Preferred Member Units

226

150

420

(30)

21,366

26,850

Houston Plating and Coatings, LLC

January 8, 2003

Provider of Plating and Industrial Coating Services

Unsecured Convertible Debt

8.00%

5/1/2022

3,000

3,000

2,900

Member Units

322,297

2,352

5,080

(8)

5,352

7,980

I-45 SLF LLC

(12) (13)

October 20, 2015

Investment Partnership

Member Units (Fully diluted 20.0%; 24.40% profits
interest) (8)

20.00% Fully Diluted, 24.40% Profits Interest

20,200

15,789

(8) (31)

93


Table of Contents

MAIN STREET CAPITAL CORPORATION

Consolidated Schedule of Investments (Continued)

December 31, 2020

(dollars in thousands)

Portfolio Company (1) (20)

Investment
Date (24)

Business
Description

Type of
Investment (2) (3) (15)

Shares/Units

Rate

Maturity
Date

Principal (4)

Cost (4)

Fair
Value (18)

L.F. Manufacturing Holdings, LLC

(10)

December 23, 2013

Manufacturer of Fiberglass Products

Preferred Member Units (non-voting)

14.00% PIK

93

93

(8) (19)

Member Units

2,179,001

2,019

2,050

2,112

2,143

OnAsset Intelligence, Inc.

April 18, 2011

Provider of Transportation Monitoring / Tracking Products and Services

Secured Debt

12.00% PIK

6/30/2021

7,301

7,301

7,301

(19)

Unsecured Debt

10.00% PIK

6/30/2021

64

64

64

(19)

Preferred Stock

912

1,981

-

Warrants

5,333

4/18/2021

1,919

-

(27)

11,265

7,365

PCI Holding Company, Inc.

December 18, 2012

Manufacturer of Industrial Gas Generating Systems

Preferred Stock

1,500,000

3,927

4,130

Rocaceia, LLC (Quality Lease and Rental Holdings, LLC)

January 8, 2013

Provider of Rigsite Accommodation Unit Rentals and Related Services

Secured Debt

12.00%

1/8/2018

30,369

29,865

-

(14) (32)

Preferred Member Units

250

2,500

-

32,365

-

Salado Stone Holdings, LLC

(10)

June 27, 2016

Limestone and Sandstone Dimension Cut Stone Mining Quarries

Class A Preferred Units

2,000,000

2,000

1,250

(30)

Slick Innovations, LLC

September 13, 2018

Text Message Marketing Platform

Secured Debt

13.00%

9/13/2023

5,720

5,605

5,719

Common Stock

70,000

700

1,330

Warrants

18,084

9/13/2028

181

360

(27)

6,486

7,409

SI East, LLC

August 31, 2018

Rigid Industrial Packaging Manufacturing

Secured Debt

9.50%

8/31/2023

32,963

32,760

32,962

Preferred Member Units

157

6,000

9,780

(8)

38,760

42,742

Superior Rigging & Erecting Co.

August 31, 2020

Provider of Steel Erecting, Crane Rental & Rigging Services

Secured Debt

12.00%

8/31/2025

21,500

21,298

21,298

Preferred Member Units

1,473

4,500

4,500

25,798

25,798

UniTek Global Services, Inc.

(11)

April 15, 2011

Provider of Outsourced Infrastructure Services

Secured Debt

7.50% (L+6.50% Floor 1.00%)

8/20/2024

2,708

2,687

2,426

(9)

Preferred Stock

1,133,102

20.00% PIK

1,441

2,832

(8) (19)

Preferred Stock

1,521,122

20.00% PIK

2,188

375

(8) (19)

Preferred Stock

2,281,682

19.00% PIK

3,667

-

(19)

Preferred Stock

4,336,866

13.50% PIK

7,924

-

(19)

Common Stock

945,507

-

-

17,907

5,633

94


Table of Contents

MAIN STREET CAPITAL CORPORATION

Consolidated Schedule of Investments (Continued)

December 31, 2020

(dollars in thousands)

Portfolio Company (1) (20)

Investment
Date (24)

Business
Description

Type of
Investment (2) (3) (15)

Shares/Units

Rate

Maturity
Date

Principal (4)

Cost (4)

Fair
Value (18)

Universal Wellhead Services Holdings, LLC

(10)

October 30, 2014

Provider of Wellhead Equipment, Designs, and Personnel to the Oil & Gas Industry

Preferred Member Units

716,949

14.00% PIK

1,032

-

(19) (30)

Member Units

4,000,000

4,000

-

(30)

5,032

-

Volusion, LLC

January 26, 2015

Provider of Online Software-as-a-Service eCommerce Solutions

Secured Debt

11.50%

1/26/2020

20,234

20,234

19,242

(17)

Unsecured Convertible Debt

8.00%

11/16/2023

409

409

291

Preferred Member Units

4,876,670

14,000

5,990

Warrants

1,831,355

1/26/2025

2,576

-

(27)

37,219

25,523

Subtotal Affiliate Investments (24.2% of net assets at fair value)

$

416,479

$

366,301

95


Table of Contents

MAIN STREET CAPITAL CORPORATION

Consolidated Schedule of Investments (Continued)

December 31, 2020

(dollars in thousands)

Portfolio Company (1) (20)

Investment
Date (24)

Business
Description

Type of
Investment (2) (3) (15)

Shares/Units

Rate

Maturity
Date

Principal (4)

Cost (4)

Fair
Value (18)

Non-Control/Non-Affiliate Investments (7)

Acousti Engineering Company of Florida, Inc.

(10)

November 2, 2020

Interior Subcontractor Providing Acoustical Walls and Ceilings

Secured Debt

10.00% (L+8.50%, Floor 1.50%)

10/31/2025

13,000

12,858

12,858

(9)

Adams Publishing Group, LLC

(10)

November 19, 2015

Local Newspaper Operator

Secured Debt

8.75% (L+7.00%, Floor 1.75%)

7/3/2023

5,863

5,745

5,813

(9)

ADS Tactical, Inc.

(10)

March 7, 2017

Value-Added Logistics and Supply Chain Provider to the Defense Industry

Secured Debt

7.00% (L+6.25%, Floor 0.75%)

7/26/2023

19,633

19,529

19,633

(9)

Aethon United BR LP

(10)

September 8, 2017

Oil & Gas Exploration & Production

Secured Debt

7.75% (L+6.75%, Floor 1.00%)

9/8/2023

9,750

9,659

9,544

(9)

Affordable Care Holding Corp.

(10)

May 9, 2019

Dental Support Organization

Secured Debt

5.75% (L+4.75%, Floor 1.00%)

10/22/2022

14,246

14,066

14,044

(9)

ALKU, LLC.

(11)

October 18, 2019

Specialty National Staffing Operator

Secured Debt

5.75% (L+5.50%)

7/29/2026

9,466

9,385

9,478

American Nuts, LLC

(10)

April 10, 2018

Roaster, Mixer and Packager of Bulk Nuts and Seeds

Secured Debt

9.00% (L+8.00%, Floor 1.00%)

4/10/2023

12,130

11,954

12,111

(9)

American Teleconferencing Services, Ltd.

(11)

May 19, 2016

Provider of Audio Conferencing and Video Collaboration Solutions

Secured Debt

7.50% (L+6.50%, Floor 1.00%)

6/8/2023

17,358

16,634

8,071

(9)

APTIM Corp.

(11)

August 17, 2018

Engineering, Construction & Procurement

Secured Debt

7.75%

6/15/2025

12,452

11,063

9,734

Arcus Hunting LLC

(10)

January 6, 2015

Manufacturer of Bowhunting and Archery Products and Accessories

Secured Debt

11.00% (L+10.00%, Floor 1.00%)

3/31/2021

11,009

11,009

11,009

(9)

Arrow International, Inc

(10)

December 21, 2020

Manufacturer and Distributor of Charitable Gaming Supplies

Secured Debt

9.23% (L+7.98%, Floor 1.25%)

12/21/2025

10,000

9,901

9,901

(9) (23)

ASC Ortho Management Company, LLC

(10)

August 31, 2018

Provider of Orthopedic Services

Secured Debt

8.50% (L+7.50%, Floor 1.00%)

8/31/2023

5,206

5,148

5,149

(9)

Secured Debt

13.25% PIK

12/1/2023

2,116

2,091

2,116

(19)

7,239

7,265

96


Table of Contents

MAIN STREET CAPITAL CORPORATION

Consolidated Schedule of Investments (Continued)

December 31, 2020

(dollars in thousands)

Portfolio Company (1) (20)

Investment
Date (24)

Business
Description

Type of
Investment (2) (3) (15)

Shares/Units

Rate

Maturity
Date

Principal (4)

Cost (4)

Fair
Value (18)

ATX Networks Corp.

(11) (13) (21)

June 30, 2015

Provider of Radio Frequency Management Equipment

Secured Debt

8.75% (7.25% Cash, 1.50% PIK) (1.50% PIK + L+6.25%, Floor 1.00%)

12/31/2023

13,402

13,342

12,263

(9) (19)

Berry Aviation, Inc.

(10)

July 6, 2018

Charter Airline Services

Secured Debt

12.00% (10.50% Cash, 1.5% PIK)

1/6/2024

4,624

4,595

4,624

(19)

Preferred Member Units

122,416

16.00% PIK

145

145

(8) (19) (30)

Preferred Member Units

1,548,387

8.00% PIK

1,671

904

(19) (30)

6,411

5,673

BigName Commerce, LLC

(10)

May 11, 2017

Provider of Envelopes and Complimentary Stationery Products

Secured Debt

8.25% (L+7.25%, Floor 1.00%)

5/11/2022

2,044

2,037

2,011

(9)

Binswanger Enterprises, LLC

(10)

March 10, 2017

Glass Repair and Installation Service Provider

Secured Debt

9.50% (L+8.50%, Floor 1.00%)

3/9/2022

12,958

12,798

12,958

(9)

Member Units

1,050,000

1,050

670

13,848

13,628

BLST Operating Company, LLC.

(11)

December 19, 2013

Multi-Channel Retailer of General Merchandise

Secured Debt

10.00% (L+8.50%, Floor 1.50%)

8/28/2025

5,879

5,879

5,879

(9)

Common Stock

653

-

-

Warrants

70

8/28/2030

-

-

(27)

5,879

5,879

Brainworks Software, LLC

(10)

August 12, 2014

Advertising Sales and Newspaper Circulation Software

Secured Debt

12.50% (Prime+9.25%, Floor 3.25%)

7/22/2019

7,817

7,817

5,332

(9) (14) (17)

Brightwood Capital Fund Investments

(12) (13)

July 21, 2014

Investment Partnership

LP Interests (Brightwood Capital Fund III, LP)

1.6%

10,800

8,459

(8) (31)

LP Interests (Brightwood Capital Fund IV, LP)

0.6%

5,000

4,745

(8) (31)

15,800

13,204

Cadence Aerospace LLC

(10)

November 14, 2017

Aerostructure Manufacturing

Secured Debt

9.50% (4.25% Cash, 5.25% PIK) (5.25% PIK + L+3.25%, Floor 1.00%)

11/14/2023

27,703

27,484

26,359

(9) (19)

97


Table of Contents

MAIN STREET CAPITAL CORPORATION

Consolidated Schedule of Investments (Continued)

December 31, 2020

(dollars in thousands)

Portfolio Company (1) (20)

Investment
Date (24)

Business
Description

Type of
Investment (2) (3) (15)

Shares/Units

Rate

Maturity
Date

Principal (4)

Cost (4)

Fair
Value (18)

California Pizza Kitchen, Inc.

(11)

August 29, 2016

Casual Restaurant Group

Secured Debt

11.50% (L+10.00%, Floor 1.50%)

11/23/2024

7,700

7,288

7,315

(9)

Secured Debt

13.50% (1.00% Cash, 12.50% PIK) (1.00% Cash, L+11.00% PIK, Floor 1.50%)

11/23/2024

2,657

2,590

2,524

(9) (19)

Secured Debt

15.00% (1.00% Cash, 14.00% PIK) (1.00% Cash + L+12.50% PIK, Floor 1.50%)

5/23/2025

2,291

2,291

1,833

(9) (19)

Common Stock

169,088

949

1,860

13,118

13,532

Central Security Group, Inc.

(11)

December 4, 2017

Security Alarm Monitoring Service Provider

Secured Debt

7.00% (L+6.00%, Floor 1.00%)

10/16/2025

6,891

6,891

5,823

(9)

Common Stock

329,084

1,481

1,645

8,372

7,468

Cenveo Corporation

(11)

September 4, 2015

Provider of Digital Marketing Agency Services

Secured Debt

10.50% (L+9.50%, Floor 1.00%)

6/7/2023

5,250

5,129

4,909

(9)

Common Stock

177,130

5,309

2,613

10,438

7,522

Chisholm Energy Holdings, LLC

(10)

May 15, 2019

Oil & Gas Exploration & Production

Secured Debt

7.75% (L+6.25%, Floor 1.50%)

5/15/2026

3,571

3,498

3,274

(9)

Clarius BIGS, LLC

(10)

September 23, 2014

Prints & Advertising Film Financing

Secured Debt

15.00% PIK

1/5/2015

2,832

2,832

31

(14) (17) (19)

Clickbooth.com, LLC

(10)

December 5, 2017

Provider of Digital Advertising Performance Marketing Solutions

Secured Debt

9.50% (L+8.50%, Floor 1.00%)

1/31/2025

7,850

7,750

7,850

(9)

Construction Supply Investments, LLC

(10)

December 29, 2016

Distribution Platform of Specialty Construction Materials to Professional Concrete and Masonry Contractors

Member Units

5,637

8,617

Copper Trail Fund Investments

(12) (13)

July 17, 2017

Investment Partnership

LP Interests (CTEF I, LP)

375

-

67

Corel Corporation

(11) (13) (21)

July 24, 2019

Publisher of Desktop and Cloud-based Software

Secured Debt

5.23% (L+5.00%)

7/2/2026

19,403

18,580

19,124

Darr Equipment LP

(10)

April 15, 2014

Heavy Equipment Dealer

Secured Debt

12.50% (11.50% Cash, 1.00% PIK)

6/22/2023

5,959

5,959

5,959

(19)

Warrants

915,734

12/23/2023

474

-

(29)

6,433

5,959

98


Table of Contents

MAIN STREET CAPITAL CORPORATION

Consolidated Schedule of Investments (Continued)

December 31, 2020

(dollars in thousands)

Portfolio Company (1) (20)

Investment
Date (24)

Business
Description

Type of
Investment (2) (3) (15)

Shares/Units

Rate

Maturity
Date

Principal (4)

Cost (4)

Fair
Value (18)

Digital River, Inc.

(11)

February 24, 2015

Provider of Outsourced e-Commerce Solutions and Services

Secured Debt

8.00% (L+7.00%, Floor 1.00%)

2/12/2023

13,628

13,422

13,560

(9)

DTE Enterprises, LLC

(10)

April 13, 2018

Industrial Powertrain Repair and Services

Secured Debt

10.00% (L+8.50%, Floor 1.50%)

4/13/2023

9,324

9,213

9,004

(9)

Class AA Preferred Member Units (non-voting)

10.00% PIK

951

951

(8) (19)

Class A Preferred Member Units

776,316

776

880

10,940

10,835

Dynamic Communities, LLC

(10)

July 17, 2018

Developer of Business Events and Online Community Groups

Secured Debt

12.50% (6.25% Cash, 6.25% PIK) (L+11.50%, Floor 1.00%)

7/17/2023

5,320

5,256

4,921

(9) (19)

Eastern Wholesale Fence LLC

(10)

November 19, 2020

Manufacturer and Distributor of Residential and Commercial Fencing Solutions

Secured Debt

7.50%, (L+6.50%, Floor 1.00%)

10/30/2025

11,857

11,523

11,523

(9)

Echo US Holdings, LLC.

(10)

November 12, 2019

Developer and Manufacturer of PVC and Polypropylene Materials

Secured Debt

7.88% (L+6.25%, Floor 1.63%)

10/25/2024

22,190

22,090

22,190

(9)

Electronic Transaction Consultants, LLC

(10)

July 24, 2020

Technology Service Provider for Toll Road and Infrastructure Operators

Secured Debt

8.50% (L+7.50%, Floor 1.00%)

7/24/2025

10,000

9,829

9,829

(9)

EnCap Energy Fund Investments

(12) (13)

December 28, 2010

Investment Partnership

LP Interests (EnCap Energy Capital Fund VIII, L.P.)

0.1%

3,813

959

(31)

LP Interests (EnCap Energy Capital Fund VIII Co-
Investors, L.P.)

0.4%

2,097

465

(31)

LP Interests (EnCap Energy Capital Fund IX, L.P.)

0.1%

4,366

1,291

(8) (31)

LP Interests (EnCap Energy Capital Fund X, L.P.)

0.1%

8,720

6,426

(8) (31)

LP Interests (EnCap Flatrock Midstream Fund II, L.P.)

0.8%

6,706

2,546

(8) (31)

LP Interests (EnCap Flatrock Midstream Fund III, L.P.)

0.2%

6,982

5,793

(8) (31)

32,684

17,480

Encino Acquisition Partners Holdings, Inc.

(11)

November 16, 2018

Oil & Gas Exploration & Production

Secured Debt

7.75% (L+6.75%, Floor 1.00%)

10/29/2025

9,000

8,932

8,297

(9)

99


Table of Contents

MAIN STREET CAPITAL CORPORATION

Consolidated Schedule of Investments (Continued)

December 31, 2020

(dollars in thousands)

Portfolio Company (1) (20)

Investment
Date (24)

Business
Description

Type of
Investment (2) (3) (15)

Shares/Units

Rate

Maturity
Date

Principal (4)

Cost (4)

Fair
Value (18)

EPIC Y-Grade Services, LP

(11)

June 22, 2018

NGL Transportation & Storage

Secured Debt

7.00% (L+6.00%, Floor 1.00%)

6/30/2027

6,944

6,854

5,799

(9)

Fortna, Inc.

(10)

July 23, 2019

Process, Physical Distribution and Logistics Consulting Services

Secured Debt

5.15% (L+5.00%)

4/8/2025

7,673

7,553

7,486

Fuse, LLC

(11)

June 30, 2019

Cable Networks Operator

Secured Debt

12.00%

6/28/2024

1,810

1,810

1,472

Common Stock

10,429

256

-

2,066

1,472

GeoStabilization International (GSI)

(11)

December 31, 2018

Geohazard Engineering Services & Maintenance

Secured Debt

5.40% (L+5.25%)

12/19/2025

11,224

11,137

11,196

GoWireless Holdings, Inc.

(11)

December 31, 2017

Provider of Wireless Telecommunications Carrier Services

Secured Debt

7.50% (L+6.50%, Floor 1.00%)

12/22/2024

17,113

16,988

16,976

(9)

Grupo Hima San Pablo, Inc.

(11)

March 7, 2013

Tertiary Care Hospitals

Secured Debt

9.25% (L+7.00%, Floor 1.50%)

4/30/2019

4,504

4,504

3,375

(9) (17)

Secured Debt

13.75%

10/15/2018

2,055

2,040

49

(17)

6,544

3,424

GS HVAM Intermediate, LLC

(10)

October 18, 2019

Specialized Food Distributor

Secured Debt

6.75% (L+5.75%, Floor 1.00%)

10/2/2024

11,053

10,952

11,007

(9)

Gexpro Services

(10)

February 24, 2020

Distributor of Industrial and Specialty Parts

Secured Debt

8.00% (L+6.50%, Floor 1.50%)

2/24/2025

29,180

28,692

28,953

(9)

HDC/HW Intermediate Holdings

(10)

December 21, 2018

Managed Services and Hosting Provider

Secured Debt

8.50% (L+7.50%, Floor 1.00%)

12/21/2023

3,474

3,429

3,351

(9)

Heartland Dental, LLC

(10)

September 9, 2020

Dental Support Organization

Secured Debt

7.50% (L+6.50%, Floor 1.00%)

4/30/2025

14,925

14,501

14,501

(9)

Hunter Defense Technologies, Inc.

(10)

March 29, 2018

Provider of Military and Commercial Shelters and Systems

Secured Debt

8.00% (L+7.00%, Floor 1.00%)

3/29/2023

35,246

34,820

35,246

(9)

HW Temps LLC

July 2, 2015

Temporary Staffing Solutions

Secured Debt

12.00%

3/29/2023

9,801

9,698

8,994

Hyperion Materials & Technologies, Inc.

(11) (13)

September 12, 2019

Manufacturer of Cutting and Machine Tools & Specialty Polishing Compounds

Secured Debt

6.50% (L+5.50%, Floor 1.00%)

8/28/2026

22,275

21,894

20,813

(9)

100


Table of Contents

MAIN STREET CAPITAL CORPORATION

Consolidated Schedule of Investments (Continued)

December 31, 2020

(dollars in thousands)

Portfolio Company (1) (20)

Investment
Date (24)

Business
Description

Type of
Investment (2) (3) (15)

Shares/Units

Rate

Maturity
Date

Principal (4)

Cost (4)

Fair
Value (18)

Ian, Evan & Alexander Corporation (EverWatch)

(10)

July 31, 2020

Cybersecurity, Software and Data Analytics provider to the Intelligence Community

Secured Debt

9.50% (L+8.50%, Floor 1.00%)

7/31/2025

16,529

16,158

16,158

(9)

Implus Footcare, LLC

(10)

June 1, 2017

Provider of Footwear and Related Accessories

Secured Debt

8.75% (L+7.75%, Floor 1.00%)

4/30/2024

18,890

18,566

17,172

(9)

Independent Pet Partners Intermediate Holdings, LLC

(10)

November 20, 2018

Omnichannel Retailer of Specialty Pet Products

Secured Debt

6.31% PIK (L+6.00% PIK)

12/22/2022

6,111

6,111

6,111

(19)

Secured Debt

6.00% PIK

11/20/2023

16,670

15,086

15,086

(19)

Preferred Stock (non-voting)

3,235

3,235

Preferred Stock (non-voting)

-

-

Member Units

1,558,333

1,558

-

25,990

24,432

Industrial Services Acquisition, LLC

(10)

June 17, 2016

Industrial Cleaning Services

Unsecured Debt

13.00% (6.00% Cash, 7.00% PIK)

12/17/2022

5,624

5,579

5,624

(19)

Preferred Member Units

144

10.00% PIK

112

112

(8) (19) (30)

Preferred Member Units

80

20.00% PIK

71

71

(8) (19) (30)

Member Units

900

900

530

(30)

6,662

6,337

Inn of the Mountain Gods Resort and Casino

(11)

October 30, 2013

Hotel & Casino Owner & Operator

Secured Debt

9.25%

11/30/2023

6,677

6,677

6,677

Interface Security Systems, L.L.C

(10)

August 7, 2019

Commercial Security & Alarm Services

Secured Debt

11.75% (8.75% Cash, 3.00% PIK) (3.00% PIK + L+7.00%, Floor 1.75%)

8/7/2023

7,245

7,145

7,245

(9) (19)

Intermedia Holdings, Inc.

(11)

August 3, 2018

Unified Communications as a Service

Secured Debt

7.00% (L+6.00%, Floor 1.00%)

7/19/2025

20,839

20,755

20,823

(9)

Invincible Boat Company, LLC.

(10)

August 28, 2019

Manufacturer of Sport Fishing Boats

Secured Debt

8.00% (L+6.50%, Floor 1.50%)

8/28/2025

8,876

8,793

8,876

(9)

Isagenix International, LLC

(11)

June 21, 2018

Direct Marketer of Health & Wellness Products

Secured Debt

6.75% (L+5.75%, Floor 1.00%)

6/14/2025

5,572

5,541

3,130

(9)

Jackmont Hospitality, Inc.

(10)

May 26, 2015

Franchisee of Casual Dining Restaurants

Secured Debt

7.75% (L+6.75%, Floor 1.00%)

5/26/2021

3,954

3,953

3,157

(9)

101


Table of Contents

MAIN STREET CAPITAL CORPORATION

Consolidated Schedule of Investments (Continued)

December 31, 2020

(dollars in thousands)

Portfolio Company (1) (20)

Investment
Date (24)

Business
Description

Type of
Investment (2) (3) (15)

Shares/Units

Rate

Maturity
Date

Principal (4)

Cost (4)

Fair
Value (18)

Joerns Healthcare, LLC

(11)

April 3, 2013

Manufacturer and Distributor of Health Care Equipment & Supplies

Secured Debt

7.00% (L+6.00%, Floor 1.00%)

8/21/2024

4,016

3,955

4,016

(9)

Common Stock

472,579

4,429

2,795

8,384

6,811

Kemp Technologies Inc.

(10)

June 27, 2019

Provider of Application Delivery Controllers

Secured Debt

7.50% (L+6.50%, Floor 1.00%)

3/29/2024

17,387

17,088

17,387

(9)

Common Stock

1,000,000

1,550

1,550

18,638

18,937

Klein Hersh, LLC

(10)

November 13, 2020

Executive and C-Suite Placement for the Life Sciences and Healthcare Industries

Secured Debt

8.75% (L+8.00%, Floor 0.75%)

11/13/2025

35,000

34,098

34,098

(9)

Kore Wireless Group Inc.

(11)

December 31, 2018

Mission Critical Software Platform

Secured Debt

5.75% (L+5.50%)

12/20/2024

19,090

19,003

18,828

Larchmont Resources, LLC

(11)

August 13, 2013

Oil & Gas Exploration & Production

Secured Debt

11.00% PIK (L+10.00% PIK, Floor 1.00%)

8/9/2021

2,185

2,185

983

(9) (19)

Member Units

2,828

353

113

(30)

2,538

1,096

Laredo Energy VI, LP

(10)

January 15, 2019

Oil & Gas Exploration & Production

Member Units

1,155,952

11,560

10,238

Lightbox Holdings, L.P.

(11)

May 23, 2019

Provider of Commercial Real Estate Software

Secured Debt

5.15% (L+5.00%)

5/9/2026

14,813

14,623

14,368

LKCM Headwater Investments I, L.P.

(12) (13)

January 25, 2013

Investment Partnership

LP Interests

2.3%

1,746

3,524

(31)

LL Management, Inc.

(10)

May 2, 2019

Medical Transportation Service Provider

Secured Debt

8.25% (L+7.25%, Floor 1.00%)

9/25/2023

16,504

16,337

16,504

(9)

Logix Acquisition Company, LLC

(10)

June 24, 2016

Competitive Local Exchange Carrier

Secured Debt

6.75% (L+5.75%, Floor 1.00%)

12/22/2024

26,131

24,550

24,171

(9)

Looking Glass Investments, LLC

(12) (13)

July 1, 2015

Specialty Consumer
Finance

Member Units

3

125

25

LSF9 Atlantis Holdings, LLC

(11)

May 17, 2017

Provider of Wireless Telecommunications Carrier Services

Secured Debt

7.00% (L+6.00%, Floor 1.00%)

5/1/2023

9,206

9,206

9,177

(9)

102


Table of Contents

MAIN STREET CAPITAL CORPORATION

Consolidated Schedule of Investments (Continued)

December 31, 2020

(dollars in thousands)

Portfolio Company (1) (20)

Investment
Date (24)

Business
Description

Type of
Investment (2) (3) (15)

Shares/Units

Rate

Maturity
Date

Principal (4)

Cost (4)

Fair
Value (18)

Lulu's Fashion Lounge, LLC

(10)

August 31, 2017

Fast Fashion E-Commerce Retailer

Secured Debt

10.50% (8.00% Cash, 2.50% PIK) (2.50% PIK + L+7.00%, Floor 1.00%)

8/28/2022

11,152

10,983

9,535

(9) (19)

Lynx FBO Operating LLC

(10)

September 30, 2019

Fixed Based Operator in the General Aviation Industry

Secured Debt

7.25% (L+5.75%, Floor 1.50%)

9/30/2024

13,613

13,369

13,521

(9)

Member Units

4,872

687

780

14,056

14,301

Mac Lean-Fogg Company

(10)

April 22, 2019

Manufacturer and Supplier for Auto and Power Markets

Secured Debt

5.63% (L+5.00%, Floor 0.625%)

12/22/2025

17,251

17,149

17,251

(9)

Preferred Stock

13.75% (4.50% Cash, 9.25% PIK)

1,870

1,870

1,841

(8) (19)

19,019

19,092

MHVC Acquisition Corp.

(11)

May 8, 2017

Provider of Differentiated Information Solutions, Systems Engineering, and Analytics

Secured Debt

6.25% (L+5.25%, Floor 1.00%)

4/29/2024

19,797

19,716

19,846

(9)

Mills Fleet Farm Group, LLC

(10)

October 24, 2018

Omnichannel Retailer of Work, Farm and Lifestyle Merchandise

Secured Debt

7.00% (L+6.00%, Floor 1.00%)

10/24/2024

13,860

13,595

13,609

(9)

NBG Acquisition Inc

(11)

April 28, 2017

Wholesaler of Home Décor Products

Secured Debt

6.50% (L+5.50%, Floor 1.00%)

4/26/2024

4,070

4,034

3,399

(9)

NinjaTrader, LLC

(10)

December 18, 2019

Operator of Futures Trading Platform

Secured Debt

8.25% (L+6.75%, Floor 1.50%)

12/18/2024

16,875

16,543

16,849

(9)

NNE Partners, LLC

(10)

March 2, 2017

Oil & Gas Exploration & Production

Secured Debt

9.48% (4.75% Cash, 4.50% PIK) (4.50% PIK + L+4.75%)

12/31/2023

23,683

23,572

21,025

(19)

Project Eagle Holdings, LLC

(10)

July 6, 2020

Provider of Secure Business Collaboration Software

Secured Debt

9.25% (L+8.25%, Floor 1.00%)

7/6/2026

14,963

14,583

14,583

(9)

Novetta Solutions, LLC

(11)

June 21, 2017

Provider of Advanced Analytics Solutions for Defense Agencies

Secured Debt

6.00% (L+5.00%, Floor 1.00%)

10/17/2022

22,912

22,629

22,864

(9)

103


Table of Contents

MAIN STREET CAPITAL CORPORATION

Consolidated Schedule of Investments (Continued)

December 31, 2020

(dollars in thousands)

Portfolio Company (1) (20)

Investment
Date (24)

Business
Description

Type of
Investment (2) (3) (15)

Shares/Units

Rate

Maturity
Date

Principal (4)

Cost (4)

Fair
Value (18)

NTM Acquisition Corp.

(11)

July 12, 2016

Provider of B2B Travel Information Content

Secured Debt

8.25% (7.25% Cash, 1.00% PIK) (1.00%PIK + L+6.25%, Floor 1.00%)

6/7/2024

4,694

4,694

4,224

(9) (19)

Ospemifene Royalty Sub LLC (QuatRx)

(10)

July 8, 2013

Estrogen-Deficiency Drug Manufacturer and Distributor

Secured Debt

11.50%

11/15/2026

4,765

4,765

121

(14)

PaySimple, Inc.

(10)

September 9, 2019

Leading Technology Services Commerce Platform

Secured Debt

5.65% (L+5.50%)

8/23/2025

24,448

24,225

23,959

PricewaterhouseCoopers Public Sector LLP

(11)

May 24, 2018

Provider of Consulting Services to Governments

Secured Debt

8.15% (L+8.00%)

5/1/2026

9,000

8,969

9,000

PT Network, LLC

(10)

November 1, 2013

Provider of Outpatient Physical Therapy and Sports Medicine Services

Secured Debt

8.73% (6.73% Cash, 2.00% PIK) (2.00% PIK + L+5.50%, Floor 1.00%)

11/30/2023

8,601

8,601

8,601

(9) (19)

Research Now Group, Inc. and Survey Sampling International, LLC

(11)

December 31, 2017

Provider of Outsourced Online Surveying

Secured Debt

6.50% (L+5.50%, Floor 1.00%)

12/20/2024

17,930

17,497

17,715

(9)

RM Bidder, LLC

(10)

November 12, 2015

Scripted and Unscripted TV and Digital Programming Provider

Warrants

187,161

10/20/2025

425

-

(26)

Member Units

2,779

46

26

471

26

RTIC Subsidiary Holdings, LLC

(10)

September 1, 2020

Direct-To-Consumer eCommerce Provider of Outdoor Products

Secured Debt

9.00% (L+7.75%, Floor 1.25%)

9/1/2025

17,260

17,026

17,026

(9)

SAFETY Investment Holdings, LLC

April 29, 2016

Provider of Intelligent Driver Record Monitoring Software and Services

Member Units

2,000,000

2,000

2,350

Salient Partners L.P.

(11)

June 25, 2015

Provider of Asset Management Services

Secured Debt

7.00% (L+6.00%, Floor 1.00%)

8/31/2021

6,450

6,443

4,542

(9)

Staples Canada ULC

(10) (13) (21)

September 14, 2017

Office Supplies Retailer

Secured Debt

8.00% (L+7.00%, Floor 1.00%)

9/12/2024

13,032

12,896

12,382

(9) (22)

TEAM Public Choices, LLC

(10)

October 28, 2019

Home-Based Care Employment Service Provider

Secured Debt

6.00% (L+5.00%, Floor 1.00%)

12/18/2027

12,500

12,126

12,406

(9)

104


Table of Contents

MAIN STREET CAPITAL CORPORATION

Consolidated Schedule of Investments (Continued)

December 31, 2020

(dollars in thousands)

Portfolio Company (1) (20)

Investment
Date (24)

Business
Description

Type of
Investment (2) (3) (15)

Shares/Units

Rate

Maturity
Date

Principal (4)

Cost (4)

Fair
Value (18)

Tectonic Financial, Inc.

May 15, 2017

Financial Services Organization

Common Stock

200,000

2,000

2,800

TGP Holdings III LLC

(11)

September 30, 2017

Outdoor Cooking & Accessories

Secured Debt

9.50% (L+8.50%, Floor 1.00%)

9/25/2025

5,500

5,448

5,307

(9)

The Pasha Group

(11)

February 2, 2018

Diversified Logistics and Transportation Provided

Secured Debt

9.00% (L+8.00%, Floor 1.00%)

1/26/2023

10,162

9,585

9,323

(9)

USA DeBusk LLC

(10)

October 22, 2019

Provider of Industrial Cleaning Services

Secured Debt

6.75% (L+5.75%, Floor 1.00%)

10/22/2024

24,948

24,561

24,591

(9)

U.S. TelePacific Corp.

(11)

September 14, 2016

Provider of Communications and Managed Services

Secured Debt

6.50% (L+5.50%, Floor 1.00%)

5/2/2023

17,088

16,913

15,486

(9)

Veregy Consolidated, Inc.

(11)

November 9, 2020

Energy Service Company

Secured Debt

7.00% (L+6.00%, Floor 1.00%)

11/3/2027

15,000

14,587

14,888

(9)

Vida Capital, Inc

(11)

October 10, 2019

Alternative Asset Manager

Secured Debt

6.15% (L+6.00%)

10/1/2026

17,853

17,626

17,272

Vistar Media, Inc.

(10)

February 17, 2017

Operator of Digital Out-of-Home Advertising Platform

Secured Debt

12.00% (8.50% Cash, 3.50% PIK) (3.50% PIK + L+7.50%, Floor 1.00%)

4/3/2023

4,636

4,513

4,636

(9) (19)

Preferred Stock

70,207

767

910

Warrants

69,675

4/3/2029

-

920

(25)

5,280

6,466

YS Garments, LLC

(11)

August 22, 2018

Designer and Provider of Branded Activewear

Secured Debt

7.00% (L+6.00%, Floor 1.00%)

8/9/2024

13,997

13,902

12,911

(9)

Zilliant Incorporated

June 15, 2012

Price Optimization and Margin Management Solutions

Preferred Stock

186,777

154

260

Warrants

952,500

6/15/2022

1,071

1,190

(28)

1,225

1,450

Subtotal Non-Control/Non-Affiliate Investments (79.5% of net assets at fair value)

1,268,740

1,204,840

Total Portfolio Investments, December 31, 2020 (177.2% of net assets at fair value)

$

2,516,709

$

2,684,866

105


Table of Contents

MAIN STREET CAPITAL CORPORATION

Consolidated Schedule of Investments (Continued)

December 31, 2020

(dollars in thousands)

(1)

All investments are Lower Middle Market portfolio investments, unless otherwise noted. See Note B for a description of Lower Middle Market portfolio investments. All of the Company’s investments, unless otherwise noted, are encumbered either as security for the Company’s Credit Facility or in support of the SBA-guaranteed debentures issued by the Funds.

(2)

Debt investments are income producing, unless otherwise noted. Equity and warrants are non-income producing, unless otherwise noted.

(3)

See Note C and Schedule 12-14 for a summary of geographic location of portfolio companies.

(4)

Principal is net of repayments. Cost is net of repayments and accumulated unearned income.

(5)

Control investments are defined by the Investment Company Act of 1940, as amended ("1940 Act"), as investments in which more than 25% of the voting securities are owned or where the ability to nominate greater than 50% of the board representation is maintained.

(6)

Affiliate investments are defined by the 1940 Act as investments in which between 5% and 25% (inclusive) of the voting securities are owned and the investments are not classified as Control investments.

(7)

Non-Control/Non-Affiliate investments are defined by the 1940 Act as investments that are neither Control investments nor Affiliate investments.

(8)

Income producing through dividends or distributions.

(9)

Index based floating interest rate is subject to contractual minimum interest rate. A majority of the variable rate loans in the Company’s investment portfolio bear interest at a rate that may be determined by reference to either LIBOR or an alternate Base Rate (commonly based on the Federal Funds Rate or the Prime Rate), which typically resets semi-annually, quarterly, or monthly at the borrower’s option. The borrower may also elect to have multiple interest reset periods for each loan. For each such loan, the Company has provided the weighted average annual stated interest rate in effect at December 31, 2020. As noted in this schedule, 61% of the loans (based on the par amount) contain LIBOR floors which range between 0.50% and 2.00%, with a weighted-average LIBOR floor of approximately 1.11%.

(10)

Private Loan portfolio investment. See Note B for a description of Private Loan portfolio investments.

(11)

Middle Market portfolio investment. See Note B for a description of Middle Market portfolio investments.

(12)

Other Portfolio investment. See Note B for a description of Other Portfolio investments.

(13)

Investment is not a qualifying asset as defined under Section 55(a) of the 1940 Act. Qualifying assets must represent at least 70% of total assets at the time of acquisition of any additional non-qualifying assets.

(14)

Non-accrual and non-income producing investment.

(15)

All of the Company’s portfolio investments are generally subject to restrictions on resale as “restricted securities.”

(16)

External Investment Manager. Investment is not encumbered as security for the Company's Credit Facility or in support of the SBA-guaranteed debentures issued by the Funds.

(17)

Maturity date is under on-going negotiations with the portfolio company and other lenders, if applicable.

(18)

Investment fair value was determined using significant unobservable inputs, unless otherwise noted. See Note C for further discussion.

(19)

PIK interest income and cumulative dividend income represent income not paid currently in cash.

(20)

All portfolio company headquarters are based in the United States, unless otherwise noted.

(21)

Portfolio company headquarters are located outside of the United States.

(22)

In connection with the Company's debt investment in Staples Canada ULC and in an attempt to mitigate any potential adverse change in foreign exchange rates during the term of the Company's investment, the Company maintains a forward foreign currency contract with Cadence Bank to lend $15.8 million Canadian Dollars and receive $12.0 million U.S. Dollars with a settlement date of September 14, 2021. The unrealized appreciation on the forward foreign currency contract is $0.4 million as of December 31, 2020.

106


Table of Contents

MAIN STREET CAPITAL CORPORATION

Consolidated Schedule of Investments (Continued)

December 31, 2020

(dollars in thousands)

(23)

The Company has entered into an intercreditor agreement that entitles the Company to the "last out" tranche of the first lien secured loans, whereby the "first out" tranche will receive priority as to the "last out" tranche with respect to payments of principal, interest, and any other amounts due thereunder. Therefore, the Company receives a higher interest rate than the contractual stated interest rate of LIBOR plus 7.25% (Floor 1.25%) per the credit agreement and the Consolidated Schedule of Investments above reflects such higher rate.

(24)

Investment date represents the date of initial investment in the portfolio company.

(25)

Warrants are presented in equivalent shares with a strike price of $10.92 per share.

(26)

Warrants are presented in equivalent units with a strike price of $14.28 per unit.

(27)

Warrants are presented in equivalent shares/units with a strike price of $0.01 per share/unit.

(28)

Warrants are presented in equivalent shares with a strike price of $0.001 per share.

(29)

Warrants are presented in equivalent units with a strike price of $1.50 per unit.

(30)

Shares/Units represent ownership in an underlying Real Estate or HoldCo entity.

(31)

Investment is not unitized. Presentation is made in percent of fully diluted ownership unless otherwise indicated.

(32)

Portfolio company is in a bankruptcy process and, as such, the maturity date of our debt investment in this portfolio company will not be finally determined until such process is complete. As noted in footnote (14), our debt investment in this portfolio company is on non-accrual status.

107


Table of Contents

MAIN STREET CAPITAL CORPORATION

Consolidated Schedule of Investments

December 31, 2019

(dollars in thousands)

Portfolio Company (1) (20)

Investment
Date (24)

Business
Description

Type of
Investment (2) (3) (15)

Shares/Units

Rate

Maturity
Date

Principal (4)

Cost (4)

Fair
Value (18)

Control Investments(5)


Access Media Holdings, LLC

(10)

7/22/2015

Private Cable Operator

Secured Debt

10.00% PIK

7/22/2020

23,828

23,828

6,387

(14) (19)

Preferred Member Units

9,481,500

9,375

(284)

(27)

Member Units

45

1

-

33,204

6,103

ASC Interests, LLC

8/1/2013

Recreational and
Educational Shooting
Facility

Secured Debt

11.00%

7/31/2020

1,650

1,639

1,639

Member Units

1,500

1,500

1,290

3,139

2,929

Analytical Systems Keco, LLC

8/16/2019

Manufacturer of Liquid and
Gas Analyzers

Secured Debt

12.13% (L+10.00%, Floor 2.00%)

8/16/2024

5,565

5,210

5,210

(9)

Preferred Member Units

3,200

3,200

3,200

Warrants

420

8/16/2029

316

316

(29)

8,726

8,726

ATS Workholding, LLC

(10)

3/10/2014

Manufacturer of Machine
Cutting Tools and
Accessories

Secured Debt

5.00%

11/16/2021

4,919

4,666

4,521

Preferred Member Units

3,725,862

3,726

939

8,392

5,460

Bond-Coat, Inc.

12/28/2012

Casing and Tubing
Coating Services

Secured Debt

15.00%

12/28/2020

11,596

11,473

11,473

Common Stock

57,508

6,350

8,300

17,823

19,773

Brewer Crane Holdings, LLC

1/9/2018

Provider of Crane Rental
and Operating Services

Secured Debt

11.71% (L+10.00%, Floor 1.00%)

1/9/2023

9,052

8,989

8,989

(9)

Preferred Member Units

2,950

4,280

4,280

(8)

13,269

13,269

Bridge Capital Solutions Corporation

4/18/2012

Financial Services
and Cash Flow
Solutions Provider

Secured Debt

13.00%

12/11/2024

8,813

7,797

7,797

Warrants

82

7/25/2026

2,132

3,500

(29)

Secured Debt

13.00%

12/11/2024

1,000

996

996

(34)

Preferred Member Units

17,742

1,000

1,000

(8) (34)

11,925

13,293

Café Brazil, LLC

4/20/2004

Casual Restaurant
Group

Member Units

1,233

1,742

2,440

(8)

California Splendor Holdings LLC

3/30/2018

Processor of Frozen Fruits

Secured Debt

10.13% (L+8.00%, Floor 1.00%)

3/30/2023

7,229

7,104

7,104

(9)

Secured Debt

12.13% (L+10.00%, Floor 1.00%)

3/30/2023

28,000

27,801

27,801

(9)

Preferred Member Units

6,725

7,163

7,163

(8)

Preferred Member Units

6,157

10,775

7,382

(8)

52,843

49,450

108


MAIN STREET CAPITAL CORPORATION

Consolidated Schedule of Investments (Continued)

December 31, 2019

(dollars in thousands)

Portfolio Company (1) (20)

Investment
Date (24)

Business
Description

Type of
Investment (2) (3) (15)

Shares/Units

Rate

Maturity
Date

Principal (4)

Cost (4)

Fair
Value (18)

CBT Nuggets, LLC ("CBT")

6/1/2006

Produces and Sells IT
Training Certification
Videos

Member Units

416

1,300

50,850

(8)

Centre Technologies Holdings, LLC

1/4/2019

Provider of IT Hardware Services and Software Solutions

Secured Debt

10.75% (L+9.00%, Floor 2.00%)

1/4/2024

12,240

12,136

12,136

(9)

Preferred Member Units

12,696

5,840

5,840

17,976

17,976

Chamberlin Holding LLC

2/26/2018

Roofing and Waterproofing
Specialty Contractor

Secured Debt

12.00% (L+10.00%, Floor 1.00%)

2/26/2023

17,773

17,649

17,773

(9)

Member Units

4,347

11,440

24,040

(8)

Member Units

1,047,146

1,047

1,450

(8) (34)

30,136

43,263

Charps, LLC

2/3/2017

Pipeline Maintenance
and Construction

Secured Debt

15.00%

6/5/2022

2,000

2,000

2,000

Preferred Member Units

1,600

400

6,920

(8)

2,400

8,920

Clad-Rex Steel, LLC

12/20/2016

Specialty Manufacturer
of Vinyl-Clad Metal

Secured Debt

10.71% (L+9.00%, Floor 1.00%)

12/20/2021

10,880

10,830

10,781

(9)

Member Units

717

7,280

9,630

(8)

Secured Debt

10.00%

12/20/2036

1,137

1,126

1,137

(34)

Member Units

800

210

460

(34)

19,446

22,008

CMS Minerals Investments

1/30/2015

Oil & Gas
Exploration
& Production

Member Units

100

2,386

1,900

(8) (34)

CompareNetworks Topco, LLC

1/29/2019

Internet Publishing and Web Search Portals

Secured Debt

12.75% (L+11.00%, Floor 1.00%)

1/29/2024

8,364

8,288

8,288

(9)

Preferred Member Units

1,975

1,975

3,010

10,263

11,298

Copper Trail Fund Investments

(12) (13)

7/17/2017

Investment Partnership

LP Interests

38.8%

872

872

(35) (36)

Datacom, LLC

5/30/2014

Technology and
Telecommunications
Provider

Secured Debt

8.00%

5/31/2021

1,800

1,800

1,615

(14)

Secured Debt

10.50% PIK

5/31/2021

12,507

12,475

10,142

(14) (19)

Class A Preferred Member Units

1,294

-

Class B Preferred Member Units

6,453

6,030

-

21,599

11,757

Digital Products Holdings LLC

4/1/2018

Designer and Distributor
of Consumer Electronics

Secured Debt

11.75% (L+10.00%, Floor 1.00%)

4/1/2023

19,620

19,478

18,452

(9)

Preferred Member Units

3,857

9,501

5,174

(8)

28,979

23,626

109


MAIN STREET CAPITAL CORPORATION

Consolidated Schedule of Investments (Continued)

December 31, 2019

(dollars in thousands)

Portfolio Company (1) (20)

Investment
Date (24)

Business
Description

Type of
Investment (2) (3) (15)

Shares/Units

Rate

Maturity
Date

Principal (4)

Cost (4)

Fair
Value (18)

Direct Marketing Solutions, Inc.

2/13/2018

Provider of Omni-Channel
Direct Marketing Services

Secured Debt

12.75% (L+11.00%, Floor 1.00%)

2/13/2023

15,717

15,597

15,707

(9)

Preferred Stock

8,400

8,400

20,200

23,997

35,907

Gamber-Johnson Holdings, LLC ("GJH")

6/24/2016

Manufacturer of
Ruggedized Computer
Mounting Systems

Secured Debt

8.50% (L+6.50%, Floor 2.00%)

6/24/2021

19,022

18,949

19,022

(9)

Member Units

8,619

14,844

53,410

(8)

33,793

72,432

Garreco, LLC

7/15/2013

Manufacturer and
Supplier of Dental
Products

Secured Debt

9.50% (L+8.00%, Floor 1.00%, Ceiling 1.50%)

3/31/2020

4,519

4,515

4,515

(9)

Member Units

1,200

1,200

2,560

5,715

7,075

GRT Rubber Technologies LLC ("GRT")

12/19/2014

Manufacturer of
Engineered Rubber
Products

Secured Debt

8.71% (L+7.00%)

12/31/2023

15,016

15,016

15,016

Member Units

5,879

13,065

47,450

28,081

62,466

Guerdon Modular Holdings, Inc.

8/13/2014

Multi-Family and
Commercial Modular
Construction Company

Secured Debt

10.60% (L+8.50%, Floor 1.00%)

10/1/2019

1,010

1,010

-

(9) (14) (17)

Secured Debt

16.00%

10/1/2019

12,588

12,588

-

(14) (17)

Preferred Stock

404,998

1,140

-

Common Stock

212,033

2,983

-

Warrants

6,208,877

4/25/2028

-

-

(30)

17,721

-

Gulf Manufacturing, LLC

8/31/2007

Manufacturer of
Specialty Fabricated
Industrial Piping
Products

Member Units

438

2,980

7,430

(8)

Gulf Publishing Holdings, LLC

4/29/2016

Energy Industry Focused
Media and Publishing

Secured Debt

11.21% (L+9.50%, Floor 1.00%)

9/30/2020

280

280

280

(9)

Secured Debt

12.50%

4/29/2021

12,535

12,493

12,493

Member Units

3,681

3,681

2,420

16,454

15,193

Harborside Holdings, LLC

3/20/2017

Real Estate Holding
Company

Member units

100

6,506

9,560

Harris Preston Fund Investments

(12) (13)

10/1/2017

Investment Partnership

LP Interests

49.3%

2,735

3,157

(35) (36)

Harrison Hydra-Gen, Ltd.

6/4/2010

Manufacturer of
Hydraulic Generators

Common Stock

107,456

718

7,970

(8)

110


MAIN STREET CAPITAL CORPORATION

Consolidated Schedule of Investments (Continued)

December 31, 2019

(dollars in thousands)

Portfolio Company (1) (20)

Investment
Date (24)

Business
Description

Type of
Investment (2) (3) (15)

Shares/Units

Rate

Maturity
Date

Principal (4)

Cost (4)

Fair
Value (18)

IDX Broker, LLC

11/15/2013

Provider of Marketing
and CRM Tools for
the Real Estate
Industry

Secured Debt

11.50%

11/15/2020

13,400

13,358

13,400

Preferred Member Units

5,607

5,952

15,040

(8)

19,310

28,440

Jensen Jewelers of Idaho, LLC

11/14/2006

Retail Jewelry Store

Secured Debt

11.50% (Prime+6.75%, Floor 2.00%)

11/14/2023

4,000

3,960

4,000

(9)

Member Units

627

811

8,270

(8)

4,771

12,270

J&J Services, Inc.

10/31/2019

Provider of Dumpster and
Portable Toilet Rental
Services

Secured Debt

11.50%

10/31/2024

17,600

17,430

17,430

Preferred Stock

2,814

7,160

7,160

24,590

24,590

KBK Industries, LLC

1/23/2006

Manufacturer of Specialty
Oilfield and Industrial
Products

Member Units

325

783

15,470

(8)

Kickhaefer Manufacturing Company, LLC

10/31/2018

Precision Metal Parts Manufacturing

Secured Debt

11.50%

10/31/2023

25,200

24,982

24,982

Member Units

581

12,240

12,240

Secured Debt

9.00%

10/31/2048

3,978

3,939

3,939

Member Units

800

992

1,160

(8) (34)

42,153

42,321

Market Force Information, LLC

7/28/2017

Provider of Customer
Experience Management
Services

Secured Debt

8.00%

7/28/2022

2,786

2,786

2,695

Secured Debt

12.00% (6.00% Current, 6.00% PIK)

7/28/2022

23,292

23,157

22,621

(19)

Member Units

743,921

16,642

5,280

42,585

30,596

MH Corbin Holding LLC

8/31/2015

Manufacturer and
Distributor of Traffic
Safety Products

Secured Debt

10.00% (5.00% Current, 5.00% PIK)

3/31/2022

8,890

8,815

8,890

(19)

Preferred Member Units

66,000

4,400

4,770

Preferred Member Units

4,000

6,000

20

19,215

13,680

Mid-Columbia Lumber Products, LLC

12/18/2006

Manufacturer of
Finger-Jointed
Lumber Products

Secured Debt

10.00%

1/15/2020

1,750

1,750

1,602

Secured Debt

12.00%

1/15/2020

3,900

3,898

3,644

Member Units

7,874

3,239

-

Secured Debt

9.50%

5/13/2025

701

701

701

(34)

Member Units

500

790

1,640

(8) (34)

10,378

7,587

MSC Adviser I, LLC

(16)

11/22/2013

Third Party Investment
Advisory Services

Member Units

1

-

74,520

(8) (35)

111


MAIN STREET CAPITAL CORPORATION

Consolidated Schedule of Investments (Continued)

December 31, 2019

(dollars in thousands)

Portfolio Company (1) (20)

Investment
Date (24)

Business
Description

Type of
Investment (2) (3) (15)

Shares/Units

Rate

Maturity
Date

Principal (4)

Cost (4)

Fair
Value (18)

Mystic Logistics Holdings, LLC

8/18/2014

Logistics and Distribution
Services Provider for
Large Volume Mailers

Secured Debt (Maturity -

12.00%

8/15/2019

6,253

6,253

6,253

(17)

Common Stock

5,873

2,720

8,410

(8)

8,973

14,663

NAPCO Precast, LLC

1/31/2008

Precast Concrete
Manufacturing

Member Units

2,955

2,975

14,760

(8)

NexRev LLC

2/28/2018

Provider of Energy
Efficiency Products &
Services

Secured Debt

11.00%

2/28/2023

17,586

17,469

17,469

Preferred Member Units

86,400,000

6,880

6,310

(8)

24,349

23,779

NRI Clinical Research, LLC

9/8/2011

Clinical Research
Service Provider

Secured Debt

14.00%

6/8/2022

5,981

5,885

5,981

Warrants

251,723

6/8/2027

252

1,230

(29)

Member Units

1,454,167

765

4,988

(8)

6,902

12,199

NRP Jones, LLC

12/22/2011

Manufacturer of
Hoses, Fittings and
Assemblies

Secured Debt

12.00%

3/20/2023

6,376

6,376

6,376

Member Units

65,962

3,717

4,710

(8)

10,093

11,086

NuStep, LLC

1/31/2017

Designer, Manufacturer
and Distributor of Fitness
Equipment

Secured Debt

12.00%

1/31/2022

19,800

19,703

19,703

Preferred Member Units

406

10,200

10,200

29,903

29,903

OMi Holdings, Inc.

4/1/2008

Manufacturer of
Overhead Cranes

Common Stock

1,500

1,080

16,950

(8)

Pegasus Research Group, LLC

1/6/2011

Provider of
Telemarketing
and Data Services

Member Units

460

1,290

8,170

PPL RVs, Inc.

6/10/2010

Recreational Vehicle
Dealer

Secured Debt

10.85% (L+8.75%, Floor 0.50%)

11/15/2022

12,245

12,118

12,118

(9)

Common Stock

1,962

2,150

9,930

14,268

22,048

Principle Environmental, LLC
(d/b/a TruHorizon
Environmental Solutions)

2/1/2011

Noise Abatement
Service Provider

Secured Debt

13.00%

4/30/2020

6,397

6,379

6,397

Preferred Member Units

19,631

4,600

13,390

(8)

Warrants

1,018

1/31/2021

1,200

1,090

(29)

12,179

20,877

Quality Lease Service, LLC

6/8/2015

Provider of Rigsite
Accommodation Unit
Rentals and Related
Services

Member Units

1,000

11,013

9,289

112


MAIN STREET CAPITAL CORPORATION

Consolidated Schedule of Investments (Continued)

December 31, 2019

(dollars in thousands)

Portfolio Company (1) (20)

Investment
Date (24)

Business
Description

Type of
Investment (2) (3) (15)

Shares/Units

Rate

Maturity
Date

Principal (4)

Cost (4)

Fair
Value (18)

River Aggregates, LLC

3/30/2011

Processor of Construction
Aggregates

Zero Coupon Secured Debt

6/30/2018

750

750

722

(17)

Member Units

1,150

1,150

4,990

Member Units

1,500

369

3,169

(34)

2,269

8,881

Tedder Industries, LLC

8/31/2018

Manufacturer of Firearm
Holsters and Accessories

Secured Debt

12.00%

8/31/2020

640

640

640

Secured Debt

12.00%

8/31/2023

16,400

16,272

16,272

Preferred Member Units

479

8,136

8,136

25,048

25,048

The MPI Group, LLC

10/2/2007

Manufacturer of
Custom Hollow
Metal Doors, Frames
and Accessories

Secured Debt

9.00%

12/31/2019

2,924

2,924

2,924

(17)

Series A Preferred Units

2,500

2,500

-

Warrants

1,424

7/1/2024

1,096

-

(29)

Member Units

100

2,300

1,640

(8) (34)

8,820

4,564

Trantech Radiator Topco, LLC

5/31/2019

Transformer Cooling
Products and Services

Secured Debt

12.00%

5/31/2024

9,200

9,102

9,102

Common Stock

615

4,655

4,655

(8)

13,757

13,757

Vision Interests, Inc.

6/5/2007

Manufacturer / Installer
of Commercial Signage

Secured Debt

13.00%

9/30/2019

2,028

2,028

2,028

(17)

Series A Preferred Stock

3,000,000

3,000

4,089

Common Stock

1,126,242

3,706

409

8,734

6,526

Ziegler's NYPD, LLC

10/1/2008

Casual Restaurant
Group

Secured Debt

6.50%

10/1/2020

1,000

1,000

1,000

Secured Debt

12.00%

10/1/2020

625

625

625

Secured Debt

14.00%

10/1/2020

2,750

2,750

2,750

Warrants

587

10/1/2020

600

-

(29)

Preferred Member Units

10,072

2,834

1,269

7,809

5,644

Subtotal Control Investments (67.2% of net assets at fair value)

$

778,367

$

1,032,721

113


MAIN STREET CAPITAL CORPORATION

Consolidated Schedule of Investments (Continued)

December 31, 2019

(dollars in thousands)

Portfolio Company (1) (20)

Investment
Date (24)

Business
Description

Type of
Investment (2) (3) (15)

Shares/Units

Rate

Maturity
Date

Principal (4)

Cost (4)

Fair
Value (18)

Affiliate Investments (6)

AFG Capital Group, LLC

11/7/2014

Provider of Rent-to-Own
Financing Solutions and
Services

Secured Debt

10.00%

5/25/2022

838

838

838

Preferred Member Units

186

1,200

5,180

2,038

6,018

American Trailer Rental Group LLC

6/7/2017

Provider of Short-term
Trailer and Container
Rental

Secured Debt

9.34% (L+7.25%, Floor 1.00%)

6/7/2022

27,087

26,905

27,087

(9)

Member Units

48,555

4,855

8,540

(34)

31,760

35,627

BBB Tank Services, LLC

4/8/2016

Maintenance, Repair and
Construction Services to
the Above-Ground
Storage Tank Market

Secured Debt

12.71% (L+11.00%, Floor 1.00%)

4/8/2021

4,800

4,698

4,698

(9)

Preferred Stock (non-voting)

131

131

(8)

Member Units

800,000

800

290

5,629

5,119

Boccella Precast Products LLC

6/30/2017

Manufacturer of Precast
Hollow Core Concrete

Secured Debt

14.10% (L+12.00%, Floor 1.00%)

6/30/2022

13,244

13,106

13,244

(9)

Member Units

2,160,000

2,256

6,270

(8)

15,362

19,514

Buca C, LLC

6/30/2015

Casual Restaurant
Group

Secured Debt

10.94% (L+9.25%, Floor 1.00%)

6/30/2020

19,004

18,981

18,794

(9)

Preferred Member Units

6

6.00% PIK

4,701

4,701

(8) (19)

23,682

23,495

CAI Software LLC

10/10/2014

Provider of Specialized
Enterprise Resource
Planning Software

Secured Debt

11.00%

12/7/2023

9,160

9,077

9,160

Member Units

66,968

751

5,210

(8)

9,828

14,370

Chandler Signs Holdings, LLC

(10)

1/4/2016

Sign Manufacturer

Class A Units

1,500,000

1,500

2,740

(8)

Charlotte Russe, Inc

(11)

5/28/2013

Fast-Fashion Retailer to
Young Women

Common Stock

19,041

3,141

-

Congruent Credit Opportunities
Funds

(12) (13)

1/24/2012

Investment Partnership

LP Interests

19.8%

5,210

855

(35) (36)

LP Interests

17.4%

13,601

13,915

(8) (35) (36)

18,811

14,770

Copper Trail Fund Investments

(12) (13)

7/17/2017

Investment Partnership

LP Interests

12.4%

1,997

2,362

(8) (35) (36)

Dos Rios Partners

(12) (13)

4/25/2013

Investment Partnership

LP Interests

20.2%

5,846

7,033

(35) (36)

LP Interests

6.4%

1,856

2,233

(35) (36)

7,702

9,266

114


MAIN STREET CAPITAL CORPORATION

Consolidated Schedule of Investments (Continued)

December 31, 2019

(dollars in thousands)

Portfolio Company (1) (20)

Investment
Date (24)

Business
Description

Type of
Investment (2) (3) (15)

Shares/Units

Rate

Maturity
Date

Principal (4)

Cost (4)

Fair
Value (18)

East Teak Fine Hardwoods, Inc.

4/13/2006

Distributor of
Hardwood Products

Common Stock

6,250

480

400

(8)

EIG Fund Investments

(12) (13)

11/6/2015

Investment Partnership

LP Interests

11.1%

768

720

(8) (35) (36)

Freeport Financial Funds

(12) (13)

6/13/2013

Investment Partnership

LP Interests

9.3%

5,974

5,778

(35) (36)

LP Interests

6.0%

9,956

9,696

(8) (35) (36)

15,930

15,474

Fuse, LLC

(11)

6/30/2019

Cable Networks Operator

Secured Debt

12.00%

6/28/2024

1,939

1,939

1,939

Common Stock

10,429

256

256

2,195

2,195

Harris Preston Fund Investments

(12) (13)

8/9/2017

Investment Partnership

LP Interests

8.2%

2,474

2,474

(35) (36)

Hawk Ridge Systems, LLC (13)

12/2/2016

Value-Added Reseller of
Engineering Design and
Manufacturing Solutions

Secured Debt

7.71% (L+6.00%, Floor 1.00%)

12/2/2021

600

600

600

(9)

Secured Debt

11.00%

12/2/2021

13,400

13,335

13,400

Preferred Member Units

226

2,850

7,900

(8)

Preferred Member Units

226

150

420

(34)

16,935

22,320

Houston Plating and Coatings, LLC

1/8/2003

Provider of Plating and
Industrial Coating
Services

Unsecured Convertible Debt

8.00%

5/1/2022

3,000

3,000

4,260

Member Units

322,297

2,352

10,330

(8)

5,352

14,590

I-45 SLF LLC

(12) (13)

10/20/2015

Investment Partnership

Member Units

20.0% (24.4% profits interest)

17,000

14,407

(8)

L.F. Manufacturing Holdings,
LLC

(10)

12/23/2013

Manufacturer of
Fiberglass Products

Preferred Member Units (non-voting)

14.00% PIK

81

81

(8) (19)

Member Units

2,179,001

2,019

2,050

2,100

2,131

OnAsset Intelligence, Inc.

4/18/2011

Provider of Transportation
Monitoring / Tracking
Products and Services

Secured Debt

12.00% PIK

6/30/2021

6,474

6,474

6,474

(19)

Unsecured Debt

10.00% PIK

6/30/2021

58

58

58

(19)

Preferred Stock

912

1,981

-

Warrants

5,333

4/18/2021

1,919

-

(29)

10,432

6,532

PCI Holding Company, Inc.

12/18/2012

Manufacturer of Industrial
Gas Generating Systems

Secured Debt

12.00%

3/31/2020

11,356

11,356

11,356

Preferred Stock (non-voting)

1,740,000

1,740

4,350

Preferred Stock

1,500,000

3,927

2,680

17,023

18,386

115


MAIN STREET CAPITAL CORPORATION

Consolidated Schedule of Investments (Continued)

December 31, 2019

(dollars in thousands)

Portfolio Company (1) (20)

Investment
Date (24)

Business
Description

Type of
Investment (2) (3) (15)

Shares/Units

Rate

Maturity
Date

Principal (4)

Cost (4)

Fair
Value (18)

Rocaceia, LLC (Quality Lease and Rental Holdings, LLC)

1/8/2013

Provider of Rigsite
Accommodation Unit
Rentals and Related
Services

Secured Debt

12.00%

1/8/2018

30,369

29,865

-

(14) (15)

Preferred Member Units

250

2,500

-

32,365

-

Salado Stone Holdings, LLC

(10)

6/27/2016

Limestone and Sandstone
Dimension Cut Stone
Mining Quarries

Class A Preferred Units

2,000,000

2,000

570

(34)

SI East, LLC

8/31/2018

Rigid Industrial Packaging
Manufacturing

Secured Debt

9.50%

8/31/2023

32,963

32,687

32,963

Preferred Member Units

157

6,000

8,200

(8)

38,687

41,163

Slick Innovations, Inc.

9/13/2018

Text Message Marketing
Platform

Secured Debt

14.00%

9/13/2023

6,360

6,197

6,197

Common Stock

70,000

700

1,080

(8)

Warrants

18,084

9/13/2028

181

290

(29)

7,078

7,567

UniTek Global Services, Inc.

(11)

4/15/2011

Provider of Outsourced
Infrastructure Services

Secured Debt

8.41% (L+6.50%, Floor 1.00%)

8/20/2024

2,963

2,940

2,962

(9)

Preferred Stock

755,401

20.00% PIK

809

1,889

(8) (19)

Preferred Stock

1,521,122

19.00% PIK

1,976

2,282

(8) (19)

Preferred Stock

2,281,682

19.00% PIK

3,667

3,667

(8) (19)

Preferred Stock

4,336,866

13.50% PIK

7,924

2,684

(8) (19)

Common Stock

945,507

-

-

17,316

13,484

Universal Wellhead Services Holdings, LLC

(10)

10/30/2014

Provider of Wellhead
Equipment, Designs,
and Personnel to the
Oil & Gas Industry

Preferred Member Units

716,949

14.00% PIK

1,032

800

(8) (19) (34)

Member Units

4,000,000

4,000

-

(34)

5,032

800

Volusion, LLC

1/26/2015

Provider of Online
Software-as-a-Service
eCommerce Solutions

Secured Debt

11.50%

1/26/2020

20,234

20,162

19,352

Unsecured Convertible Debt

8.00%

11/16/2023

409

409

291

Preferred Member Units

4,876,670

14,000

14,000

Warrants

1,831,355

1/26/2025

2,576

150

(29)

37,147

33,793

Subtotal Affiliate Investments (21.5% of net assets at fair value)

$

351,764

$

330,287

116


MAIN STREET CAPITAL CORPORATION

Consolidated Schedule of Investments (Continued)

December 31, 2019

(dollars in thousands)

Portfolio Company (1) (20)

Investment
Date (24)

Business
Description

Type of
Investment (2) (3) (15)

Shares/Units

Rate

Maturity
Date

Principal (4)

Cost (4)

Fair
Value (18)

Non-Control/Non-Affiliate Investments (7)

AAC Holdings, Inc.

(11)

6/30/2017

Substance Abuse
Treatment Service
Provider

Secured Debt

13.03% (L+11.00%, Floor 1.00%)

4/15/2020

2,227

2,068

2,172

(9) (14)

Secured Debt

16.50% (L+12.75%, Floor 1.00%)

6/30/2023

14,396

14,030

9,358

(9) (14)

16,098

11,530

Adams Publishing Group, LLC

(10)

11/19/2015

Local Newspaper
Operator

Secured Debt

8.75% (Prime+5.00%, Floor 1.50%)

7/3/2023

5,000

4,930

5,000

(9)

Secured Debt

9.44% (L+7.50%, Floor 1.50%)

7/3/2023

6,158

6,058

6,158

(9)

Secured Debt

9.50% (L+7.50%, Floor 1.50%)

7/3/2023

197

197

197

(9)

11,185

11,355

ADS Tactical, Inc.

(10)

3/7/2017

Value-Added Logistics
and Supply Chain
Provider to the Defense
Industry

Secured Debt

8.03% (L+6.25%, Floor 0.75%)

7/26/2023

19,843

19,703

19,843

(9)

Aethon United BR LP

(10)

9/8/2017

Oil & Gas Exploration &
Production

Secured Debt

8.46% (L+6.75%, Floor 1.00%)

9/8/2023

9,750

9,630

9,531

(9)

Affordable Care Holding Corp.

(10)

5/9/2019

Dental Service
Organization

Secured Debt

6.59% (L+4.75%, Floor 1.00%)

10/22/2022

14,396

14,126

14,036

(9)

ALKU, LLC.

(11)

10/18/2019

Specialty National
Staffing Operator

Secured Debt

7.44% (L+5.50%, Floor 1.00%)

7/29/2026

10,000

9,902

9,883

(9)

Allen Media, LLC.

(11)

9/18/2018

Operator of Cable
Television Networks

Secured Debt

8.48% (L+6.50%, Floor 1.00%)

8/30/2023

16,270

15,894

15,863

(9)

Allen Media Broadcasting LLC

(10)

7/3/2019

Operator of Television
Broadcasting Networks

Secured Debt

8.21% (L+6.25%, Floor 1.00%)

7/3/2024

14,906

14,565

14,565

(9)

American Nuts, LLC

(10)

4/10/2018

Roaster, Mixer and
Packager of Bulk Nuts
and Seeds

Secured Debt

11.60% (L+9.50%, Floor 1.00%)

4/10/2023

12,243

12,002

12,233

(9)

American Teleconferencing Services, Ltd.

(11)

5/19/2016

Provider of Audio
Conferencing and Video
Collaboration Solutions

Secured Debt

8.36% (L+6.50%, Floor 1.00%)

6/8/2023

17,389

16,421

10,460

(9)

APTIM Corp.

(11)

8/17/2018

Engineering, Construction
& Procurement

Secured Debt

7.75%

6/15/2025

12,452

10,836

7,471

117


MAIN STREET CAPITAL CORPORATION

Consolidated Schedule of Investments (Continued)

December 31, 2019

(dollars in thousands)

Portfolio Company (1) (20)

Investment
Date (24)

Business
Description

Type of
Investment (2) (3) (15)

Shares/Units

Rate

Maturity
Date

Principal (4)

Cost (4)

Fair
Value (18)

Arcus Hunting LLC

(10)

1/6/2015

Manufacturer of
Bowhunting and Archery
Products and Accessories

Secured Debt

12.10% (L+10.00%, Floor 1.00%)

1/13/2020

13,857

13,856

13,856

(9)

ASC Ortho Management Company, LLC

(10)

8/31/2018

Provider of Orthopedic
Services

Secured Debt

9.60% (L+7.50%, Floor 1.00%)

8/31/2023

4,543

4,465

4,490

(9)

Secured Debt

13.25% PIK

12/1/2023

1,854

1,821

1,854

(19)

6,286

6,344

ATI Investment Sub, Inc.

(11)

7/11/2016

Manufacturer of Solar
Tracking Systems

Secured Debt

9.01% (L+7.25%, Floor 1.00%)

6/22/2021

2,885

2,859

2,853

(9)

ATX Networks Corp.

(11) (13) (21)

6/30/2015

Provider of Radio
Frequency Management
Equipment

Secured Debt

8.94% (7.94% Current,
1.00% PIK) (L+6.00%, Floor 1.00%)

6/11/2021

13,593

13,414

12,743

(9) (19)

Barfly Ventures, LLC

(10)

8/31/2015

Casual Restaurant
Group

Secured Debt

12.00%

8/31/2020

10,185

10,073

7,736

Options

3

607

-

Warrants

2

8/31/2025

473

-

(37)

11,153

7,736

Berry Aviation, Inc.

(10)

7/6/2018

Charter Airline Services

Secured Debt

12.00% (10.50% Current, 1.50% PIK)

1/6/2024

4,554

4,518

4,554

(19)

Preferred Member Units

122,416

16.00% PIK

125

125

(8) (19) (34)

Preferred Member Units

1,548,387

8.00% PIK

1,671

776

(8) (19) (34)

6,314

5,455

BigName Commerce, LLC

(10)

5/11/2017

Provider of Envelopes
and Complimentary
Stationery Products

Secured Debt

9.35% (L+7.25%, Floor 1.00%)

5/11/2022

2,233

2,218

2,233

(9)

Binswanger Enterprises, LLC

(10)

3/10/2017

Glass Repair and
Installation Service
Provider

Secured Debt

10.41% (L+8.50%, Floor 1.00%)

3/9/2022

13,731

13,443

13,731

(9)

Member Units

1,050,000

1,050

950

14,493

14,681

Bluestem Brands, Inc.

(11)

12/19/2013

Multi-Channel Retailer of
General Merchandise

Secured Debt

9.31% (L+7.50%, Floor 1.00%)

11/6/2020

10,622

10,571

7,973

(9)

Bojangles', Inc.

(11)

2/5/2019

Quick Service Restaurant
Group

Secured Debt

6.50% (L+4.75%)

1/28/2026

7,782

7,642

7,827

Secured Debt

10.25% (L+8.50%)

1/28/2027

5,000

4,907

5,012

12,549

12,839

Brainworks Software, LLC

(10)

8/12/2014

Advertising Sales and
Newspaper Circulation
Software

Secured Debt

4.00%

7/22/2019

6,733

6,733

5,955

(9) (17)

118


MAIN STREET CAPITAL CORPORATION

Consolidated Schedule of Investments (Continued)

December 31, 2019

(dollars in thousands)

Portfolio Company (1) (20)

Investment
Date (24)

Business
Description

Type of
Investment (2) (3) (15)

Shares/Units

Rate

Maturity
Date

Principal (4)

Cost (4)

Fair
Value (18)

Brightwood Capital Fund Investments

(12) (13)

7/21/2014

Investment Partnership

LP Interests

1.6%

11,160

9,005

(8) (35) (36)

LP Interests

0.6%

4,500

4,504

(8) (35) (36)

15,660

13,509

Cadence Aerospace LLC

(10)

11/14/2017

Aerostructure
Manufacturing

Secured Debt

8.40% (L+6.50%, Floor 1.00%)

11/14/2023

25,287

25,089

25,287

(9)

California Pizza Kitchen, Inc.

(11)

8/29/2016

Casual Restaurant Group

Secured Debt

7.91% (L+6.00%, Floor 1.00%)

8/23/2022

14,599

14,501

12,739

(9)

Central Security Group, Inc.

(11)

12/4/2017

Security Alarm Monitoring
Service Provider

Secured Debt

7.38% (L+5.63%, Floor 1.00%)

10/6/2021

13,776

13,734

11,985

(9)

Cenveo Corporation

(11)

9/4/2015

Provider of Digital
Marketing Agency
Services

Secured Debt

11.45% (L+9.50%, Floor 1.00%)

6/7/2023

5,674

5,498

5,674

(9)

Common Stock

177,130

5,309

2,923

10,807

8,597

Chisholm Energy Holdings, LLC

(10)

5/15/2019

Oil & Gas Exploration &
Production

Secured Debt

8.16% (L+6.25%, Floor 1.50%)

5/15/2026

3,571

3,488

3,488

(9)

Clarius BIGS, LLC

(10)

9/23/2014

Prints & Advertising
Film Financing

Secured Debt

15.00% PIK

1/5/2015

2,846

2,846

40

(14) (17)

Clickbooth.com, LLC

(10)

12/5/2017

Provider of Digital
Advertising Performance
Marketing Solutions

Secured Debt

10.59% (L+8.50%, Floor 1.00%)

12/5/2022

2,663

2,625

2,663

(9)

Construction Supply Investments, LLC

(10)

12/29/2016

Distribution Platform of
Specialty Construction
Materials to
Professional Concrete
and Masonry Contractors

Member Units

46,152

4,866

7,667

Corel Corporation

(11) (13) (21)

7/24/2019

Publisher of Desktop and
Cloud-based Software

Secured Debt

6.91% (L+5.00%, Floor 1.00%)

7/2/2026

15,000

14,293

14,531

(9)

CTVSH, PLLC

(10)

8/3/2017

Emergency Care and
Specialty Service Animal
Hospital

Secured Debt

9.91% (L+8.00%, Floor 1.00%)

8/3/2022

10,099

10,039

10,099

(9)

Darr Equipment LP

(10)

4/15/2014

Heavy Equipment Dealer

Secured Debt

12.50% (11.50% Current, 1.00% PIK)

6/22/2023

5,899

5,899

5,899

(19)

Warrants

915,734

12/23/2023

474

300

(31)

6,373

6,199

Digital River, Inc.

(11)

2/24/2015

Provider of Outsourced
e-Commerce Solutions
and Services

Secured Debt

7.90% (L+6.00%, Floor 1.00%)

2/12/2021

15,876

15,771

15,837

(9)

119


MAIN STREET CAPITAL CORPORATION

Consolidated Schedule of Investments (Continued)

December 31, 2019

(dollars in thousands)

Portfolio Company (1) (20)

Investment
Date (24)

Business
Description

Type of
Investment (2) (3) (15)

Shares/Units

Rate

Maturity
Date

Principal (4)

Cost (4)

Fair
Value (18)

DTE Enterprises, LLC

(10)

4/13/2018

Industrial Powertrain
Repair and Services

Secured Debt

9.24% (L+7.50%, Floor 1.50%)

4/13/2023

10,992

10,827

10,982

(9)

Class AA Preferred Member Units (non-voting)

10.00% PIK

860

860

(8) (19)

Class A Preferred Member Units

776,316

776

1,490

12,463

13,332

Dynamic Communities, LLC

(10)

7/17/2018

Developer of Business
Events and Online
Community Groups

Secured Debt

9.75% (L+8.00%, Floor 1.00%)

7/17/2023

5,460

5,375

5,458

(9)

Echo US Holdings, LLC.

(10)

11/12/2019

Developer and
Manufacturer of PVC and
Polypropylene Materials

Secured Debt

7.96% (L+6.25%, Floor 1.63%)

10/25/2024

22,414

22,292

22,292

(9)

EnCap Energy Fund Investments

(12) (13)

12/28/2010

Investment Partnership

LP Interests

0.1%

3,617

1,354

(8) (35) (36)

LP Interests

0.4%

2,097

703

(35) (36)

LP Interests

0.1%

4,360

2,780

(8) (35) (36)

LP Interests

0.1%

8,427

8,822

(8) (35) (36)

LP Interests

0.8%

7,337

5,669

(8) (35) (36)

LP Interests

0.2%

6,674

6,677

(8) (35) (36)

32,512

26,005

Encino Acquisition Partners Holdings, Inc.

(11)

11/16/2018

Oil & Gas Exploration &
Production

Secured Debt

8.50% (L+6.75%, Floor 1.00%)

10/29/2025

9,000

8,921

6,795

(9)

EPIC Y-Grade Services, LP

(11)

6/22/2018

NGL Transportation &
Storage

Secured Debt

8.04% (L+6.00%)

6/13/2024

10,275

10,116

10,050

Evergreen Skills Lux S.á r.l.
(d/b/a Skillsoft)

(11) (13)

5/5/2014

Technology-based
Performance Support
Solutions

Secured Debt

10.45% (L+8.25%, Floor 1.00%)

4/28/2022

6,999

6,928

1,965

(9)

Felix Investments Holdings II

(10)

8/9/2017

Oil & Gas Exploration &
Production

Secured Debt

8.40% (L+6.50%, Floor 1.00%)

8/9/2022

5,000

4,944

5,000

(9)

Flavors Holdings Inc.

(11)

10/15/2014

Global Provider of
Flavoring and
Sweetening Products

Secured Debt

7.77% (L+5.75%, Floor 1.00%)

4/3/2020

11,297

11,247

10,619

(9)

Fortna, Inc.

(10)

7/23/2019

Process, Physical Distribution
and Logistics Consulting
Services

Secured Debt

6.75% (L+5.00%)

4/8/2025

7,751

7,577

7,577

GeoStabilization International (GSI)

(11)

12/31/2018

Geohazard Engineering
Services & Maintenance

Secured Debt

7.05% (L+5.25%)

12/19/2025

16,376

16,230

16,335

GoWireless Holdings, Inc.

(11)

12/31/2017

Provider of Wireless
Telecommunications
Carrier Services

Secured Debt

8.25% (L+6.50%, Floor 1.00%)

12/22/2024

18,120

17,964

17,471

(9)

120


MAIN STREET CAPITAL CORPORATION

Consolidated Schedule of Investments (Continued)

December 31, 2019

(dollars in thousands)

Portfolio Company (1) (20)

Investment
Date (24)

Business
Description

Type of
Investment (2) (3) (15)

Shares/Units

Rate

Maturity
Date

Principal (4)

Cost (4)

Fair
Value (18)

Grupo Hima San Pablo, Inc.

(11)

3/7/2013

Tertiary Care Hospitals

Secured Debt

8.91% (L+7.00%, Floor 1.50%)

4/30/2019

4,504

4,504

3,343

(9) (17)

Secured Debt

13.75%

10/15/2018

2,055

2,040

167

(17)

6,544

3,510

GS HVAM Intermediate, LLC

(10)

10/18/2019

Specialized Food
Distributor

Secured Debt

7.51% (L+5.75%, Floor 1.00%)

10/2/2024

11,364

11,233

11,233

(9)

HDC/HW Intermediate Holdings

(10)

12/21/2018

Managed Services and
Hosting Provider

Secured Debt

9.53% (L+7.50%, Floor 1.00%)

12/21/2023

3,498

3,440

3,493

(9)

Hoover Group, Inc.

(10) (13)

10/21/2016

Provider of Storage
Tanks and Related
Products to the Energy
and Petrochemical
Markets

Secured Debt

9.26% (L+7.25%, Floor 1.00%)

1/28/2021

20,764

20,119

19,206

(9)

Hunter Defense Technologies, Inc.

(10)

3/29/2018

Provider of Military
and Commercial Shelters
and Systems

Secured Debt

9.02% (L+7.00%, Floor 1.00%)

3/29/2023

29,097

28,659

29,097

(9)

HW Temps LLC

7/2/2015

Temporary Staffing
Solutions

Secured Debt

8.00%

3/29/2023

10,181

10,025

8,913

Hydrofarm Holdings LLC

(10)

5/18/2017

Wholesaler of
Horticultural Products

Secured Debt

11.80% (3.54% Current, 8.26% PIK) (L+10.00%)

5/12/2022

7,660

7,547

6,414

(19)

Hyperion Materials & Technologies, Inc.

(11) (13)

9/12/2019

Manufacturer of Cutting
and Machine Tools &
Speciality Polishing
Compounds

Secured Debt

7.25% (L+5.50%, Floor 1.00%)

8/28/2026

22,500

22,066

22,275

(9)

iEnergizer Limited

(10) (13) (21)

4/17/2019

Provider of Business
Outsourcing Solutions

Secured Debt

7.79% (L+6.00%, Floor 1.00%)

4/17/2024

12,963

12,848

12,962

(9)

Implus Footcare, LLC

(10)

6/1/2017

Provider of Footwear and
Related Accessories

Secured Debt

8.27% (L+6.25%, Floor 1.00%)

4/30/2024

18,577

18,178

18,217

(9)

Independent Pet Partners Intermediate
Holdings, LLC

(10)

11/20/2018

Omnichannel Retailer of Specialty Pet Products

Secured Debt

11.28% (L+9.00%, Floor 1.00%)

11/19/2023

18,799

18,487

18,799

(9)

Member Units

1,558,333

1,558

1,260

20,045

20,059

Industrial Services Acquisition, LLC

(10)

6/17/2016

Industrial Cleaning
Services

Unsecured Debt

13.00% (6.00% Current, 7.00% PIK)

12/17/2022

5,242

5,174

5,242

(19)

Preferred Member Units

144

10.00% PIK

103

103

(8) (19) (34)

Preferred Member Units

80

20.00% PIK

60

60

(8) (19) (34)

Member Units

900

900

510

(34)

6,237

5,915

121


MAIN STREET CAPITAL CORPORATION

Consolidated Schedule of Investments (Continued)

December 31, 2019

(dollars in thousands)

Portfolio Company (1) (20)

Investment
Date (24)

Business
Description

Type of
Investment (2) (3) (15)

Shares/Units

Rate

Maturity
Date

Principal (4)

Cost (4)

Fair
Value (18)

Inn of the Mountain Gods Resort
and Casino

(11)

10/30/2013

Hotel & Casino Owner &
Operator

Secured Debt

9.25%

11/30/2020

7,762

7,584

7,684

Interface Security Systems, L.L.C

(10)

8/7/2019

Commercial Security &
Alarm Services

Secured Debt

8.77% (L+7.00%, Floor 1.75%)

8/7/2023

7,500

7,363

7,363

(9)

Intermedia Holdings, Inc.

(11)

8/3/2018

Unified Communications
as a Service

Secured Debt

7.75% (L+6.00%, Floor 1.00%)

7/19/2025

20,130

20,033

20,180

(9)

Invincible Boat Company, LLC.

(10)

8/28/2019

Manufacturer of Sport
Fishing Boats

Secured Debt

8.53% (L+6.50%, Floor 1.00%)

8/28/2025

9,872

9,773

9,773

(9)

Isagenix International, LLC

(11)

6/21/2018

Direct Marketer of Health
& Wellness Products

Secured Debt

7.77% (L+5.75%, Floor 1.00%)

6/14/2025

5,943

5,893

4,273

(9)

JAB Wireless, Inc.

(10)

5/2/2018

Fixed Wireless
Broadband Provider

Secured Debt

9.74% (L+8.00%, Floor 1.00%)

5/2/2023

14,775

14,669

14,775

(9)

Jackmont Hospitality, Inc.

(10)

5/26/2015

Franchisee of Casual
Dining Restaurants

Secured Debt

8.45% (L+6.75%, Floor 1.00%)

5/26/2021

4,059

4,055

4,059

(9)

Joerns Healthcare, LLC

(11)

4/3/2013

Manufacturer and
Distributor of Health
Care Equipment &
Supplies

Secured Debt

7.91% (L+6.00%, Floor 1.00%)

8/21/2024

4,016

3,942

3,942

(9)

Common Stock

472,579

4,429

4,429

8,371

8,371

Kemp Technologies Inc.

(10)

6/27/2019

Provider of Application
Delivery Controllers

Secured Debt

8.00% (L+6.25%, Floor 1.00%)

3/29/2024

7,462

7,326

7,463

(9)

Kore Wireless Group Inc.

(11)

12/31/2018

Mission Critical Software
Platform

Secured Debt

7.52% (L+5.50%)

12/20/2024

19,285

19,189

19,164

Larchmont Resources, LLC

(11)

8/13/2013

Oil & Gas Exploration
& Production

Secured Debt

8.89% (L+7.00%, (Floor 1.00%)

8/7/2020

2,145

2,145

1,990

(9)

Member Units

2,828

353

707

(34)

2,498

2,697

Laredo Energy VI, LP

(10)

1/15/2019

Oil & Gas Exploration &
Production

Secured Debt

11.64% (5.38% Current, 6.26% PIK) (L+9.63%, Floor 2.00%)

11/19/2021

11,312

11,166

10,638

(9) (19)

Lightbox Holdings, L.P.

(11)

5/23/2019

Provider of Commercial
Real Estate Software

Secured Debt

6.74% (L+5.00%)

5/9/2026

14,925

14,713

14,738

LKCM Headwater Investments I, L.P.

(12) (13)

1/25/2013

Investment Partnership

LP Interests

2.3%

1,746

3,682

(8) (35) (36)

122


MAIN STREET CAPITAL CORPORATION

Consolidated Schedule of Investments (Continued)

December 31, 2019

(dollars in thousands)

Portfolio Company (1) (20)

Investment
Date (24)

Business
Description

Type of
Investment (2) (3) (15)

Shares/Units

Rate

Maturity
Date

Principal (4)

Cost (4)

Fair
Value (18)

LL Management, Inc.

(10)

5/2/2019

Medical Transportation
Service Provider

Secured Debt

8.56% (L+6.50%, Floor 1.00%)

9/25/2023

13,754

13,625

13,751

(9)

Logix Acquisition Company, LLC

(10)

6/24/2016

Competitive Local
Exchange Carrier

Secured Debt

7.50% (L+5.75%, Floor 1.00%)

12/22/2024

18,381

18,199

18,197

(9)

Looking Glass Investments, LLC

(12) (13)

7/1/2015

Specialty Consumer
Finance

Member Units

3

125

25

Member Units

190,712

49

16

(34)

174

41

LSF9 Atlantis Holdings, LLC

(11)

5/17/2017

Provider of Wireless
Telecommunications
Carrier Services

Secured Debt

7.74% (L+6.00%, Floor 1.00%)

5/1/2023

9,458

9,458

8,761

(9)

Lulu's Fashion Lounge, LLC

(10)

8/31/2017

Fast Fashion E-Commerce
Retailer

Secured Debt

10.75% (L+9.00%, Floor 1.00%)

8/28/2022

11,335

11,070

11,109

(9)

Lynx FBO Operating LLC

(10)

9/30/2019

Fixed Based Operator in
the General Aviation
Industry

Secured Debt

7.86% (L+5.75%, Floor 1.00%)

9/30/2024

13,750

13,451

13,451

(9)

Member Units

3,704

500

500

13,951

13,951

Mac Lean-Fogg Company

(10)

4/22/2019

Manufacturer and
Supplier for Auto and
Power Markets

Secured Debt

6.75% (L+5.00%)

12/22/2025

16,648

16,528

16,643

Preferred Stock

1,516

13.75% (4.50% Cash, 9.25% PIK)

1,775

1,775

1,775

(8) (19)

18,303

18,418

MHVC Acquisition Corp.

(11)

5/8/2017

Provider of differentiated
information solutions,
systems engineering,
and analytics

Secured Debt

7.01% (L+5.25%, Floor 1.00%)

4/29/2024

19,950

19,855

19,950

(9)

Mills Fleet Farm Group, LLC

(10)

10/24/2018

Omnichannel Retailer of
Work, Farm and Lifestyle
Merchandise

Secured Debt

9.04% (8.29% Current,
0.75% PIK) (L+6.25%, Floor 1.00%)

10/24/2024

14,879

14,556

14,187

(9) (19)

NBG Acquisition Inc

(11)

4/28/2017

Wholesaler of Home
Décor Products

Secured Debt

7.52% (L+5.50%, Floor 1.00%)

4/26/2024

4,181

4,134

3,247

(9)

NinjaTrader, LLC

(10)

12/18/2019

Operator of Futures Trading Platform

Secured Debt

7.90% (L+6.00%, Floor 1.50%)

12/18/2024

9,675

9,490

9,490

(9)

NNE Partners, LLC

(10)

3/2/2017

Oil & Gas Exploration
& Production

Secured Debt

9.91% (L+8.00%)

3/2/2022

23,417

23,268

23,147

123


MAIN STREET CAPITAL CORPORATION

Consolidated Schedule of Investments (Continued)

December 31, 2019

(dollars in thousands)

Portfolio Company (1) (20)

Investment
Date (24)

Business
Description

Type of
Investment (2) (3) (15)

Shares/Units

Rate

Maturity
Date

Principal (4)

Cost (4)

Fair
Value (18)

North American Lifting Holdings, Inc.

(11)

2/26/2015

Crane Service Provider

Secured Debt

6.52% (L+4.50%, Floor 1.00%)

11/27/2020

7,584

7,300

6,417

(9)

Novetta Solutions, LLC

(11)

6/21/2017

Provider of Advanced
Analytics Solutions for
Defense Agencies

Secured Debt

6.76% (L+5.00%, Floor 1.00%)

10/17/2022

21,060

20,673

20,749

(9)

NTM Acquisition Corp.

(11)

7/12/2016

Provider of B2B Travel
Information Content

Secured Debt

8.00% (L+6.25% ,Floor 1.00%)

6/7/2022

4,879

4,874

4,879

(9)

Ospemifene Royalty Sub LLC (QuatRx)

(10)

7/8/2013

Estrogen-Deficiency
Drug Manufacturer and
Distributor

Secured Debt

11.50%

11/15/2026

4,868

4,868

463

(14)

PaySimple, Inc.

(10)

9/9/2019

Leading technology services commerce platform

Secured Debt

7.28% (L+5.50%, Floor 1.00%)

8/23/2025

15,845

15,586

15,766

(9)

Permian Holdco 2, Inc.

(11)

2/12/2013

Storage Tank Manufacturer

Unsecured Debt

14.00% PIK

10/15/2021

456

456

341

(19)

Unsecured Debt

18.00% PIK

6/30/2022

319

319

319

(19)

Preferred Stock

154,558

799

100

(34)

1,574

760

Point.360

(10)

7/8/2015

Fully Integrated Provider
of Digital Media Services

Warrants

65,463

7/7/2020

69

-

(38)

Common Stock

163,658

273

-

342

-

PricewaterhouseCoopers Public Sector LLP

(11)

5/24/2018

Provider of Consulting
Services to Governments

Secured Debt

9.75% (L+8.00%)

5/1/2026

9,000

8,965

8,865

PT Network, LLC

(10)

11/1/2013

Provider of Outpatient
Physical Therapy and
Sports Medicine Services

Secured Debt

9.44% (7.44% Current,
2.00% PIK) (L+5.50%, Floor 1.00%)

11/30/2023

8,491

8,491

8,414

(9) (19)

Research Now Group, Inc. and Survey Sampling International, LLC

(11)

12/31/2017

Provider of Outsourced
Online Surveying

Secured Debt

7.41% (L+5.50%, Floor 1.00%)

12/20/2024

18,115

17,590

18,140

(9)

RM Bidder, LLC

(10)

11/12/2015

Scripted and Unscripted
TV and Digital
Programming Provider

Warrants

327,532

10/20/2025

425

-

(32)

Member Units

2,779

46

18

471

18

SAFETY Investment Holdings, LLC

4/29/2016

Provider of Intelligent
Driver Record
Monitoring Software
and Services

Member Units

2,000,000

2,000

2,380

Salient Partners L.P.

(11)

6/25/2015

Provider of Asset
Management Services

Secured Debt

7.69% (L+6.00%, Floor 1.00%)

6/9/2021

6,675

6,657

6,675

(9)

124


MAIN STREET CAPITAL CORPORATION

Consolidated Schedule of Investments (Continued)

December 31, 2019

(dollars in thousands)

Portfolio Company (1) (20)

Investment
Date (24)

Business
Description

Type of
Investment (2) (3) (15)

Shares/Units

Rate

Maturity
Date

Principal (4)

Cost (4)

Fair
Value (18)

SMART Modular Technologies, Inc.

(10) (13)

8/18/2017

Provider of Specialty
Memory Solutions

Secured Debt

8.16% (L+6.25%, Floor 1.00%)

8/9/2022

18,484

18,332

18,669

(9)

Staples Canada ULC

(10) (13) (21)

9/14/2017

Office Supplies Retailer

Secured Debt

8.98% (L+7.00%, Floor 1.00%)

9/12/2024

14,546

14,348

13,530

(9) (22)

TE Holdings, LLC

(11)

12/5/2013

Oil & Gas Exploration
& Production

Member Units

97,048

970

-

TEAM Public Choices, LLC

(10)

10/28/2019

Home-Based Care
Employment Service
Provider

Secured Debt

7.75% (L+6.00%, Floor 1.00%)

9/20/2024

16,844

16,680

16,680

(9)

Tectonic Financial, Inc.

5/15/2017

Financial Services
Organization

Common Stock

400,000

2,000

2,620

(8)

TGP Holdings III LLC

(11)

9/30/2017

Outdoor Cooking &
Accessories

Secured Debt

10.25% (L+8.50%, Floor 1.00%)

9/25/2025

5,500

5,440

5,143

(9)

The Pasha Group

(11)

2/2/2018

Diversified Logistics and
Transportation Provided

Secured Debt

9.31% (L+7.50%, Floor 1.00%)

1/26/2023

8,984

8,793

9,074

(9)

TMC Merger Sub Corp.

(11)

12/22/2016

Refractory & Maintenance
Services Provider

Secured Debt

8.53% (L+6.75%, Floor 1.00%)

10/31/2022

15,527

15,394

15,392

(9) (24)

TOMS Shoes, LLC

(11)

11/13/2014

Global Designer,
Distributor, and
Retailer of Casual
Footwear

Secured Debt

7.46% (L+5.50%, Floor 1.00%)

9/30/2025

571

571

571

(9)

Secured Debt

6.96% (L+5.00%, Floor 1.00%)

12/31/2025

1,637

1,637

1,637

(9)

Member Units

16,321

245

245

2,453

2,453

USA DeBusk LLC

(10)

10/22/2019

Provider of Industrial
Cleaning Services

Secured Debt

7.54% (L+5.75%, Floor 1.00%)

10/22/2024

30,000

29,423

29,423

(9)

U.S. TelePacific Corp.

(11)

9/14/2016

Provider of
Communications and
Managed Services

Secured Debt

7.02% (L+5.00%, Floor 1.00%)

5/2/2023

17,088

16,887

16,447

(9)

Vida Capital, Inc

(11)

10/10/2019

Alternative Asset Manager

Secured Debt

7.93% (L+6.00%)

10/1/2026

18,500

18,232

18,315

VIP Cinema Holdings, Inc.

(11)

3/9/2017

Supplier of Luxury
Seating to the Cinema
Industry

Secured Debt

9.91% (L+8.00%, Floor 1.00%)

3/1/2023

10,063

10,030

5,301

(9) (14)

125


MAIN STREET CAPITAL CORPORATION

Consolidated Schedule of Investments (Continued)

December 31, 2019

(dollars in thousands)

Portfolio Company (1) (20)

Investment
Date (24)

Business
Description

Type of
Investment (2) (3) (15)

Shares/Units

Rate

Maturity
Date

Principal (4)

Cost (4)

Fair
Value (18)

Vistar Media, Inc.

(10)

2/17/2017

Operator of Digital
Out-of-Home
Advertising Platform

Secured Debt

10.00% (L+8.00%, Floor 1.00%)

4/3/2023

4,963

4,784

4,939

(9)

Preferred Stock

70,207

767

1,610

Warrants

69,675

4/3/2029

-

1,630

(33)

5,551

8,179

Wireless Vision Holdings, LLC

(10)

9/29/2017

Provider of Wireless
Telecommunications
Carrier Services

Secured Debt

12.57% (11.57% Current,
1.00% PIK) (L+9.65%, Floor 1.00%)

9/29/2022

7,136

7,022

7,129

(9) (19) (23)

Secured Debt

11.67% (10.67% Current, 1.00% PIK) (L+8.91%, Floor 1.00%)

9/29/2022

6,201

6,132

6,200

(9) (19) (23)

13,154

13,329

YS Garments, LLC

(11)

8/22/2018

Designer and Provider of
Branded Activewear

Secured Debt

7.60% (L+6.00%, Floor 1.00%)

8/9/2024

14,531

14,412

14,404

(9)

Zilliant Incorporated

6/15/2012

Price Optimization and
Margin Management
Solutions

Preferred Stock

186,777

154

260

Warrants

952,500

6/15/2022

1,071

1,190

(30)

1,225

1,450

Subtotal Non-Control/Non-Affiliate Investments (80.7% of net assets at fair value)

$

1,297,587

$

1,239,316

Total Portfolio Investments, December 31, 2019 (169.4% of net assets at fair value)

$

2,427,718

$

2,602,324

126


Table of Contents

MAIN STREET CAPITAL CORPORATION

Consolidated Schedule of Investments (Continued)

December 31, 2019

(dollars in thousands)

(1)

All investments are Lower Middle Market portfolio investments, unless otherwise noted. See Note B for a description of Lower Middle Market portfolio investments. All of the Company’s investments, unless otherwise noted, are encumbered either as security for the Company’s Credit Facility or in support of the SBA-guaranteed debentures issued by the Funds.

(2)

Debt investments are income producing, unless otherwise noted. Equity and warrants are non-income producing, unless otherwise noted.

(3)

See Note C and Schedule 12-14 for a summary of geographic location of portfolio companies.

(4)

Principal is net of repayments. Cost is net of repayments and accumulated unearned income.

(5)

Control investments are defined by the Investment Company Act of 1940, as amended ("1940 Act"), as investments in which more than 25% of the voting securities are owned or where the ability to nominate greater than 50% of the board representation is maintained.

(6)

Affiliate investments are defined by the 1940 Act as investments in which between 5% and 25% (inclusive) of the voting securities are owned and the investments are not classified as Control investments.

(7)

Non-Control/Non-Affiliate investments are defined by the 1940 Act as investments that are neither Control investments nor Affiliate investments.

(8)

Income producing through dividends or distributions.

(9)

Index based floating interest rate is subject to contractual minimum interest rate. A majority of the variable rate loans in the Company’s investment portfolio bear interest at a rate that may be determined by reference to either LIBOR or an alternate Base Rate (commonly based on the Federal Funds Rate or the Prime Rate), which typically resets semi-annually, quarterly, or monthly at the borrower’s option. The borrower may also elect to have multiple interest reset periods for each loan. For each such loan, the Company has provided the weighted average annual stated interest rate in effect at December 31, 2019. As noted in this schedule, 64% of the loans (based on the par amount) contain LIBOR floors which range between 0.50% and 2.00%, with a weighted-average LIBOR floor of approximately 1.06%.

(10)

Private Loan portfolio investment. See Note B for a description of Private Loan portfolio investments.

(11)

Middle Market portfolio investment. See Note B for a description of Middle Market portfolio investments.

(12)

Other Portfolio investment. See Note B for a description of Other Portfolio investments.

(13)

Investment is not a qualifying asset as defined under Section 55(a) of the 1940 Act. Qualifying assets must represent at least 70% of total assets at the time of acquisition of any additional non-qualifying assets.

(14)

Non-accrual and non-income producing investment.

(15)

Portfolio company is in a bankruptcy process and, as such, the maturity date of our debt investment in this portfolio company will not be finally determined until such process is complete. As noted in footnote (14), our debt investment in this portfolio company is on non-accrual status.

(16)

External Investment Manager. Investment is not encumbered as security for the Company's Credit Facility or in support of the SBA-guaranteed debentures issued by the Funds.

(17)

Maturity date is under on-going negotiations with the portfolio company and other lenders, if applicable.

(18)

Investment fair value was determined using significant unobservable inputs, unless otherwise noted. See Note C for further discussion.

(19)

PIK interest income and cumulative dividend income represent income not paid currently in cash.

(20)

All portfolio company headquarters are based in the United States, unless otherwise noted.

(21)

Portfolio company headquarters are located outside of the United States.

(22)

In connection with the Company's debt investment in Staples Canada ULC and in an attempt to mitigate any potential adverse change in foreign exchange rates during the term of the Company's investment, the Company maintains a forward foreign currency contract with Cadence Bank to lend $17.6 million Canadian Dollars and receive $13.4 million U.S. Dollars with a settlement date of September 14, 2020. The unrealized depreciation on the forward foreign currency contract is $0.2 million as of December 31, 2019.

127


Table of Contents

MAIN STREET CAPITAL CORPORATION

Consolidated Schedule of Investments (Continued)

December 31, 2019

(dollars in thousands)

(23)

The Company has entered into an intercreditor agreement that entitles the Company to the "last out" tranche of the first lien secured loans, whereby the "first out" tranche will receive priority as to the "last out" tranche with respect to payments of principal, interest, and any other amounts due thereunder. Therefore, the Company receives a higher interest rate than the contractual stated interest rate of LIBOR plus 8.50% (Floor 1.00%) per the credit agreement and the Consolidated Schedule of Investments above reflects such higher rate.

(24)

The Company has entered into an intercreditor agreement that entitles the Company to the "first out" tranche of the first lien secured loans, whereby the "first out" tranche will receive priority as to the "last out" tranche with respect to payments of principal, interest, and any other amounts due thereunder. Therefore, the Company receives a lower interest rate than the contractual stated interest rate of LIBOR plus 7.14% (Floor 1.00%) per the credit agreement and the Consolidated Schedule of Investments above reflects such lower rate.

(25)

All of the Company’s portfolio investments are generally subject to restrictions on resale as “restricted securities.”

(26)

Investment date represents the date of initial investment in the portfolio company.

(27)

Investment has an unfunded commitment as of December 31, 2019 (see Note K).  The fair value of the investment includes the impact of the fair value of any unfunded commitments.

(28)

Investment date represents the date of initial investment in the portfolio company.

(29)

Warrants are presented in equivalent shares/units with a strike price of $0.01 per share/unit.

(30)

Warrants are presented in equivalent shares with a strike price of $0.001 per share.

(31)

Warrants are presented in equivalent units with a strike price of $1.50 per unit.

(32)

Warrants are presented in equivalent units with a strike price of $14.28 per unit.

(33)

Warrants are presented in equivalent shares with a strike price of $10.92 per share.

(34)

Shares/Units represent ownership in an underlying Real Estate or HoldCo entity.

(35)

Investment is not unitized. Presentation is made in percent of fully diluted ownership unless otherwise indicated.

(36)

Investment is in an underlying Limited Partnership that is managed by the respective Portfolio Company.

(37)

Warrants are presented in equivalent units with a strike price of $1.00 per unit.

(38)

Warrants are presented in equivalent shares with a strike price of $0.75 per share.

128


Table of Contents

MAIN STREET CAPITAL CORPORATION

Notes to Consolidated Financial Statements

NOTE A—ORGANIZATION AND BASIS OF PRESENTATION

1.           Organization

Main Street Capital Corporation (“MSCC”) is a principal investment firm primarily focused on providing customized debt and equity financing to lower middle market (“LMM”) companies and debt capital to middle market (“Middle Market”) companies. The portfolio investments of MSCC and its consolidated subsidiaries are typically made to support management buyouts, recapitalizations, growth financings, refinancings and acquisitions of companies that operate in a variety of industry sectors. MSCC seeks to partner with entrepreneurs, business owners and management teams and generally provides “one stop” financing alternatives within its LMM portfolio. MSCC and its consolidated subsidiaries invest primarily in secured debt investments, equity investments, warrants and other securities of LMM companies based in the United States and in secured debt investments of Middle Market companies generally headquartered in the United States.

MSCC was formed in March 2007 to operate as an internally managed business development company (“BDC”) under the Investment Company Act of 1940, as amended (the “1940 Act”). MSCC wholly owns several investment funds, including Main Street Mezzanine Fund, LP (“MSMF”) and Main Street Capital III, LP (“MSC III” and, collectively with MSMF, the “Funds”), and each of their general partners. The Funds are each licensed as a Small Business Investment Company (“SBIC”) by the United States Small Business Administration (“SBA”). Because MSCC is internally managed, all of the executive officers and other employees are employed by MSCC. Therefore, MSCC does not pay any external investment advisory fees, but instead directly incurs the operating costs associated with employing investment and portfolio management professionals.

MSC Adviser I, LLC (the “External Investment Manager”) was formed in November 2013 as a wholly owned subsidiary of MSCC to provide investment management and other services to parties other than MSCC and its subsidiaries or their portfolio companies (“External Parties”) and receives fee income for such services. MSCC has been granted no-action relief by the Securities and Exchange Commission (“SEC”) to allow the External Investment Manager to register as a registered investment adviser under the Investment Advisers Act of 1940, as amended. Since the External Investment Manager conducts all of its investment management activities for External Parties, it is accounted for as a portfolio investment of MSCC and is not included as a consolidated subsidiary of MSCC in MSCC’s consolidated financial statements.

MSCC has elected to be treated for U.S. federal income tax purposes as a regulated investment company (“RIC”) under Subchapter M of the Internal Revenue Code of 1986, as amended (the “Code”). As a result, MSCC generally will not pay corporate-level U.S. federal income taxes on any net ordinary taxable income or capital gains that it distributes to its stockholders.

MSCC has certain direct and indirect wholly owned subsidiaries that have elected to be taxable entities (the “Taxable Subsidiaries”). The primary purpose of the Taxable Subsidiaries is to permit MSCC to hold equity investments in portfolio companies which are “pass-through” entities for tax purposes.

Unless otherwise noted or the context otherwise indicates, the terms “we,” “us,” “our,” the “Company” and “Main Street” refer to MSCC and its consolidated subsidiaries, which include the Funds and the Taxable Subsidiaries.

2.           Basis of Presentation

Main Street’s consolidated financial statements are prepared in accordance with generally accepted accounting principles in the United States of America (“U.S. GAAP”). The Company is an investment company following accounting and reporting guidance in Financial Accounting Standards Board (“FASB”) Accounting Standards Codification (“ASC”) 946, Financial Services—Investment Companies (“ASC 946”). For each of the periods presented

129


Table of Contents

herein, Main Street’s consolidated financial statements include the accounts of MSCC and its consolidated subsidiaries. The Investment Portfolio, as used herein, refers to all of Main Street’s investments in LMM portfolio companies, investments in Middle Market portfolio companies, Private Loan (as defined in Note C) portfolio investments, Other Portfolio (as defined in Note C) investments and the investment in the External Investment Manager (see “Note C—Fair Value Hierarchy for Investments and Debentures—Portfolio Composition—Investment Portfolio Composition” for additional discussion of Main Street’s Investment Portfolio). Main Street’s results of operations for the years ended December 31, 2020, 2019 and 2018, cash flows for the years ended December 31, 2020, 2019 and 2018 and financial position as of December 31, 2020 and 2019, are presented on a consolidated basis. The effects of all intercompany transactions between Main Street and its consolidated subsidiaries have been eliminated in consolidation.

Principles of Consolidation

Under ASC 946, Main Street is precluded from consolidating other entities in which Main Street has equity investments, including those in which it has a controlling interest, unless the other entity is another investment company. An exception to this general principle in ASC 946 occurs if Main Street holds a controlling interest in an operating company that provides all or substantially all of its services directly to Main Street or to its portfolio companies. Accordingly, as noted above, MSCC’s consolidated financial statements include the financial position and operating results for the Funds and the Taxable Subsidiaries. Main Street has determined that none of its portfolio investments qualify for this exception, including the investment in the External Investment Manager. Therefore, Main Street’s Investment Portfolio is carried on the consolidated balance sheet at fair value, as discussed further in Note B.1., with any adjustments to fair value recognized as “Net Unrealized Appreciation (Depreciation)” on the consolidated statements of operations until the investment is realized, usually upon exit, resulting in any gain or loss being recognized as a “Net Realized Gain (Loss).”

Portfolio Investment Classification

Main Street classifies its Investment Portfolio in accordance with the requirements of the 1940 Act. Under the 1940 Act, (a) “Control Investments” are defined as investments in which Main Street owns more than 25% of the voting securities or has rights to maintain greater than 50% of the board representation, (b) “Affiliate Investments” are defined as investments in which Main Street owns between 5% and 25% (inclusive) of the voting securities and does not have rights to maintain greater than 50% of the board representation, and (c) “Non-Control/Non-Affiliate Investments” are defined as investments that are neither Control Investments nor Affiliate Investments. For purposes of determining the classification of its Investment Portfolio, Main Street has excluded consideration of any voting securities or board appointment rights held by funds advised by the External Investment Manager.

NOTE B—SUMMARY OF SIGNIFICANT ACCOUNTING POLICIES

1.           Valuation of the Investment Portfolio

Main Street accounts for its Investment Portfolio at fair value. As a result, Main Street follows the provisions of ASC 820, Fair Value Measurements and Disclosures (“ASC 820”). ASC 820 defines fair value, establishes a framework for measuring fair value, establishes a fair value hierarchy based on the quality of inputs used to measure fair value and enhances disclosure requirements for fair value measurements. ASC 820 requires Main Street to assume that the portfolio investment is to be sold in the principal market to independent market participants, which may be a hypothetical market. Market participants are defined as buyers and sellers in the principal market that are independent, knowledgeable and willing and able to transact.

Main Street’s portfolio strategy calls for it to invest primarily in illiquid debt and equity securities issued by privately held, LMM companies and more liquid debt securities issued by Middle Market companies that are generally larger in size than the LMM companies. Main Street categorizes some of its investments in LMM companies and Middle Market companies as Private Loan portfolio investments, which are primarily debt securities in privately held companies that have been originated through strategic relationships with other investment funds on a collaborative basis, and are often referred to in the debt markets as “club deals.” Private Loan investments are typically similar in size, structure, terms and conditions to investments Main Street holds in its LMM portfolio and Middle Market portfolio. Main Street’s

130


Table of Contents

portfolio also includes Other Portfolio investments which primarily consist of investments that are not consistent with the typical profiles for its LMM portfolio investments, Middle Market portfolio investments or Private Loan portfolio investments, including investments which may be managed by third parties. Main Street’s portfolio investments may be subject to restrictions on resale.

LMM investments and Other Portfolio investments generally have no established trading market while Middle Market securities generally have established markets that are not active. Private Loan investments may include investments which have no established trading market or have established markets that are not active. Main Street determines in good faith the fair value of its Investment Portfolio pursuant to a valuation policy in accordance with ASC 820 and a valuation process approved by its Board of Directors and in accordance with the 1940 Act. Main Street’s valuation policies and processes are intended to provide a consistent basis for determining the fair value of Main Street’s Investment Portfolio.

For LMM portfolio investments, Main Street generally reviews external events, including private mergers, sales and acquisitions involving comparable companies, and includes these events in the valuation process by using an enterprise value waterfall methodology (“Waterfall”) for its LMM equity investments and an income approach using a yield-to-maturity model (“Yield-to-Maturity”) for its LMM debt investments. For Middle Market portfolio investments, Main Street primarily uses quoted prices in the valuation process. Main Street determines the appropriateness of the use of third-party broker quotes, if any, in determining fair value based on its understanding of the level of actual transactions used by the broker to develop the quote and whether the quote was an indicative price or binding offer, the depth and consistency of broker quotes and the correlation of changes in broker quotes with underlying performance of the portfolio company and other market indices. For Middle Market and Private Loan portfolio investments in debt securities for which it has determined that third-party quotes or other independent pricing are not available or appropriate, Main Street generally estimates the fair value based on the assumptions that it believes hypothetical market participants would use to value the investment in a current hypothetical sale using the Yield-to-Maturity valuation method. For its Other Portfolio equity investments, Main Street generally calculates the fair value of the investment primarily based on the net asset value (“NAV”) of the fund and adjusts the fair value for other factors deemed relevant that would affect the fair value of the investment. All of the valuation approaches for Main Street’s portfolio investments estimate the value of the investment as if Main Street were to sell, or exit, the investment as of the measurement date.

These valuation approaches consider the value associated with Main Street’s ability to control the capital structure of the portfolio company, as well as the timing of a potential exit. For valuation purposes, “control” portfolio investments are composed of debt and equity securities in companies for which Main Street has a controlling interest in the equity ownership of the portfolio company or the ability to nominate a majority of the portfolio company’s board of directors. For valuation purposes, “non-control” portfolio investments are generally composed of debt and equity securities in companies for which Main Street does not have a controlling interest in the equity ownership of the portfolio company or the ability to nominate a majority of the portfolio company’s board of directors.

Under the Waterfall valuation method, Main Street estimates the enterprise value of a portfolio company using a combination of market and income approaches or other appropriate valuation methods, such as considering recent transactions in the equity securities of the portfolio company or third-party valuations of the portfolio company, and then performs a waterfall calculation by allocating the enterprise value over the portfolio company’s securities in order of their preference relative to one another. The enterprise value is the fair value at which an enterprise could be sold in a transaction between two willing parties, other than through a forced or liquidation sale. Typically, privately held companies are bought and sold based on multiples of earnings before interest, taxes, depreciation and amortization (“EBITDA”), cash flows, net income, revenues, or in limited cases, book value. There is no single methodology for estimating enterprise value. For any one portfolio company, enterprise value is generally described as a range of values from which a single estimate of enterprise value is derived. In estimating the enterprise value of a portfolio company, Main Street analyzes various factors including the portfolio company’s historical and projected financial results. Due to SEC deadlines for Main Street’s quarterly and annual financial reporting, the operating results of a portfolio company used in the current period valuation are generally the results from the period ended three months prior to such valuation date and may include unaudited, projected, budgeted or pro forma financial information and may require adjustments for non-recurring items or to normalize the operating results that may require significant judgment in determining. In addition, projecting future financial results requires significant judgment regarding future growth assumptions. In

131


Table of Contents

evaluating the operating results, Main Street also analyzes the impact of exposure to litigation, loss of customers or other contingencies. After determining the appropriate enterprise value, Main Street allocates the enterprise value to investments in order of the legal priority of the various components of the portfolio company’s capital structure. In applying the Waterfall valuation method, Main Street assumes the loans are paid off at the principal amount in a change in control transaction and are not assumed by the buyer, which Main Street believes is consistent with its past transaction history and standard industry practices.

Under the Yield-to-Maturity valuation method, Main Street also uses the income approach to determine the fair value of debt securities based on projections of the discounted future free cash flows that the debt security will likely generate, including analyzing the discounted cash flows of interest and principal amounts for the debt security, as set forth in the associated loan agreements, as well as the financial position and credit risk of the portfolio company. Main Street’s estimate of the expected repayment date of its debt securities is generally the maturity date of the instrument, as Main Street generally intends to hold its loans and debt securities to maturity. The Yield-to-Maturity analysis also considers changes in leverage levels, credit quality, portfolio company performance and other factors. Main Street will generally use the value determined by the Yield-to-Maturity analysis as the fair value for that security; however, because of Main Street’s general intent to hold its loans to maturity, the fair value will not exceed the principal amount of the debt security valued using the Yield-to-Maturity valuation method. A change in the assumptions that Main Street uses to estimate the fair value of its debt securities using the Yield-to-Maturity valuation method could have a material impact on the determination of fair value. If there is deterioration in credit quality or if a debt security is in workout status, Main Street may consider other factors in determining the fair value of the debt security, including the value attributable to the debt security from the enterprise value of the portfolio company or the proceeds that would most likely be received in a liquidation analysis.

Under the NAV valuation method, for an investment in an investment fund that does not have a readily determinable fair value, Main Street measures the fair value of the investment predominately based on the NAV of the investment fund as of the measurement date and adjusts the investment’s fair value for factors known to Main Street that would affect that fund’s NAV, including, but not limited to, fair values for individual investments held by the fund if Main Street holds the same investment or for a publicly traded investment. In addition, in determining the fair value of the investment, Main Street considers whether adjustments to the NAV are necessary in certain circumstances, based on the analysis of any restrictions on redemption of Main Street’s investment as of the measurement date, recent actual sales or redemptions of interests in the investment fund, and expected future cash flows available to equity holders, including the rate of return on those cash flows compared to an implied market return on equity required by market participants, or other uncertainties surrounding Main Street’s ability to realize the full NAV of its interests in the investment fund.

Pursuant to its internal valuation process and the requirements under the 1940 Act, Main Street performs valuation procedures on each of its portfolio investments quarterly. In addition to its internal valuation process, in arriving at estimates of fair value for its investments in its LMM portfolio companies, Main Street, among other things, consults with a nationally recognized independent financial advisory services firm. The nationally recognized independent financial advisory services firm analyzes and provides observations, recommendations and an assurance certification regarding the Company’s determinations of the fair value of its LMM portfolio company investments. The nationally recognized independent financial advisory services firm is generally consulted relative to Main Street’s investments in each LMM portfolio company at least once every calendar year, and for Main Street’s investments in new LMM portfolio companies, at least once in the twelve-month period subsequent to the initial investment. In certain instances, Main Street may determine that it is not cost-effective, and as a result is not in its stockholders’ best interest, to consult with the nationally recognized independent financial advisory services firm on its investments in one or more LMM portfolio companies. Such instances include, but are not limited to, situations where the fair value of Main Street’s investment in a LMM portfolio company is determined to be insignificant relative to the total Investment Portfolio. Main Street consulted with and received an assurance certification from its independent financial advisory services firm in arriving at Main Street’s determination of fair value on its investments in a total of 58 LMM portfolio companies for the year ended December 31, 2020, representing approximately 91% of the total LMM portfolio at fair value as of December 31, 2020, and on a total of 57 LMM portfolio companies for the year ended December 31, 2019, representing approximately 94% of the total LMM portfolio at fair value as of December 31, 2019. Excluding its investments in LMM portfolio companies that, as of December 31, 2020 and 2019, as applicable, had not been in the Investment Portfolio for at least twelve months subsequent to the initial investment or whose primary purpose is to own real estate

132


Table of Contents

for which a third-party appraisal is obtained on at least an annual basis, the percentage of the LMM portfolio reviewed and certified by its independent financial advisory services firm for the years ended December 31, 2020 and 2019 was 99% of the total LMM portfolio at fair value as of both December 31, 2020 and 2019.

For valuation purposes, all of Main Street’s Middle Market portfolio investments are non-control investments. To the extent sufficient observable inputs are available to determine fair value, Main Street uses observable inputs to determine the fair value of these investments through obtaining third-party quotes or other independent pricing. For Middle Market portfolio investments for which it has determined that third-party quotes or other independent pricing are not available or appropriate, Main Street generally estimates the fair value based on the assumptions that it believes hypothetical market participants would use to value such Middle Market debt investments in a current hypothetical sale using the Yield-to-Maturity valuation method and such Middle Market equity investments in a current hypothetical sale using the Waterfall valuation method. Because the vast majority of the Middle Market portfolio investments are typically valued using third-party quotes or other independent pricing services (including 90% and 91% of the Middle Market portfolio investments as of December 31, 2020 and 2019, respectively), Main Street generally does not consult with any financial advisory services firms in connection with determining the fair value of its Middle Market investments.

For valuation purposes, all of Main Street’s Private Loan portfolio investments are non-control investments. For Private Loan portfolio investments for which it has determined that third-party quotes or other independent pricing are not available or appropriate, Main Street generally estimates the fair value based on the assumptions that it believes hypothetical market participants would use to value such Private Loan debt investments in a current hypothetical sale using the Yield-to-Maturity valuation method and such Private Loan equity investments in a current hypothetical sale using the Waterfall valuation method.

In addition to its internal valuation process, in arriving at estimates of fair value for its investments in its Private Loan portfolio companies, Main Street, among other things, consults with a nationally recognized independent financial advisory services firm. The nationally recognized independent financial advisory services firm analyzes and provides observations and recommendations and an assurance certification regarding the Company’s determinations of the fair value of its Private Loan portfolio company investments. The nationally recognized independent financial advisory services firm is generally consulted relative to Main Street’s investments in each Private Loan portfolio company at least once every calendar year, and for Main Street’s investments in new Private Loan portfolio companies, at least once in the twelve-month period subsequent to the initial investment. In certain instances, Main Street may determine that it is not cost-effective, and as a result is not in its stockholders’ best interest, to consult with the nationally recognized independent financial advisory services firm on its investments in one or more Private Loan portfolio companies. Such instances include, but are not limited to, situations where the fair value of Main Street’s investment in a Private Loan portfolio company is determined to be insignificant relative to the total Investment Portfolio. Main Street consulted with and received an assurance certification from its independent financial advisory services firm in arriving at its determination of fair value on its investments in a total of 36 Private Loan portfolio companies for the year ended December 31, 2020, representing approximately 66% of the total Private Loan portfolio at fair value as of December, 2020, and on a total of 37 Private Loan portfolio companies for the year ended December 31, 2019, representing approximately 62% of the total Private Loan portfolio at fair value as of December 31, 2019. Excluding its investments in Private Loan portfolio companies that, as of December 31, 2020 and 2019, as applicable, had not been in the Investment Portfolio for at least twelve months subsequent to the initial investment and its investments in Private Loan portfolio companies that were not reviewed because the investment is valued based upon third-party quotes or other independent pricing, the percentage of the Private Loan portfolio reviewed and certified by its independent financial advisory services firm for the years ended December 31, 2020 and 2019 was 92% and 94% of the total Private Loan portfolio at fair value as of December 31, 2020 and 2019, respectively.

For valuation purposes, all of Main Street’s Other Portfolio investments are non-control investments. Main Street’s Other Portfolio investments comprised 3.6% and 4.1% of Main Street’s Investment Portfolio at fair value as of December 31, 2020 and 2019, respectively. Similar to the LMM investment portfolio, market quotations for Other Portfolio equity investments are generally not readily available. For its Other Portfolio equity investments, Main Street generally determines the fair value of these investments using the NAV valuation method.

133


Table of Contents

For valuation purposes, Main Street’s investment in the External Investment Manager is a control investment. Market quotations are not readily available for this investment, and as a result, Main Street determines the fair value of the External Investment Manager using the Waterfall valuation method under the market approach. In estimating the enterprise value, Main Street analyzes various factors, including the entity’s historical and projected financial results, as well as its size, marketability and performance relative to the population of market comparables. This valuation approach estimates the value of the investment as if Main Street were to sell, or exit, the investment. In addition, Main Street considers its ability to control the capital structure of the company, as well as the timing of a potential exit, in connection with determining the fair value of the External Investment Manager.

Due to the inherent uncertainty in the valuation process, Main Street’s determination of fair value for its Investment Portfolio may differ materially from the values that would have been determined had a ready market for the securities existed. In addition, changes in the market environment, portfolio company performance and other events that may occur over the lives of the investments may cause the gains or losses ultimately realized on these investments to be materially different than the valuations currently assigned. Main Street determines the fair value of each individual investment and records changes in fair value as unrealized appreciation or depreciation.

Main Street uses an internally developed portfolio investment rating system in connection with its investment oversight, portfolio management and analysis and investment valuation procedures for its LMM portfolio companies. This system takes into account both quantitative and qualitative factors of the LMM portfolio company and the investments held therein.

The Board of Directors of Main Street has the final responsibility for overseeing, reviewing and approving, in good faith, Main Street’s determination of the fair value for its Investment Portfolio, as well as its valuation procedures, consistent with 1940 Act requirements. Main Street believes its Investment Portfolio as of December 31, 2020 and 2019 approximates fair value as of those dates based on the markets in which Main Street operates and other conditions in existence on those reporting dates.

2.           Use of Estimates

The preparation of financial statements in conformity with U.S. GAAP requires management to make estimates and assumptions that affect the reported amounts of assets and liabilities and disclosure of contingent assets and liabilities at the date of the financial statements and the reported amounts of revenue and expenses during the period. Actual results may differ from these estimates under different conditions or assumptions. Additionally, as explained in Note B.1., the consolidated financial statements include investments in the Investment Portfolio whose values have been estimated by Main Street with the oversight, review and approval by Main Street’s Board of Directors in the absence of readily ascertainable market values. Because of the inherent uncertainty of the Investment Portfolio valuations, those estimated values may differ materially from the values that would have been determined had a ready market for the securities existed.

The COVID-19 pandemic, and the related effect on the U.S. and global economies, has impacted, and threatens to continue to impact, the businesses and operating results of certain of Main Street’s portfolio companies, as well as market interest spreads. As a result of these and other current effects of the COVID-19 pandemic, as well as the uncertainty regarding the extent and duration of its impact, the valuation of Main Street’s Investment Portfolio is volatile.

3.           Cash and Cash Equivalents

Cash and cash equivalents consist of cash and highly liquid investments with an original maturity of three months or less at the date of purchase. Cash and cash equivalents are carried at cost, which approximates fair value.

At December 31, 2020, cash balances totaling $29.1 million exceeded Federal Deposit Insurance Corporation insurance protection levels, subjecting the Company to risk related to the uninsured balance. All of the Company’s cash deposits are held at large established high credit quality financial institutions and management believes that the risk of loss associated with any uninsured balances is remote.

134


Table of Contents

4.            Interest, Dividend and Fee Income

Main Street records interest and dividend income on the accrual basis to the extent amounts are expected to be collected. Dividend income is recorded as dividends are declared by the portfolio company or at the point an obligation exists for the portfolio company to make a distribution. In accordance with Main Street’s valuation policies, Main Street evaluates accrued interest and dividend income periodically for collectability. When a loan or debt security becomes 90 days or more past due, and if Main Street otherwise does not expect the debtor to be able to service all of its debt or other obligations, Main Street will generally place the loan or debt security on non-accrual status and cease recognizing interest income on that loan or debt security until the borrower has demonstrated the ability and intent to pay contractual amounts due. If a loan or debt security’s status significantly improves regarding the debtor’s ability to service the debt or other obligations, or if a loan or debt security is sold or written off, Main Street removes it from non-accrual status.

As of December 31, 2020, Main Street’s total Investment Portfolio had seven investments on non-accrual status, which comprised approximately 1.3% of its fair value and 3.6% of its cost. As of December 31, 2019, Main Street’s total Investment Portfolio had eight investments on non-accrual status, which comprised approximately 1.4% of its fair value and 4.8% of its cost.

Main Street holds certain debt and preferred equity instruments in its Investment Portfolio that contain payment-in-kind (“PIK”) interest and cumulative dividend provisions. The PIK interest, computed at the contractual rate specified in each debt agreement, is periodically added to the principal balance of the debt and is recorded as interest income. Thus, the actual collection of this interest may be deferred until the time of debt principal repayment. Cumulative dividends are recorded as dividend income, and any dividends in arrears are added to the balance of the preferred equity investment. The actual collection of these dividends in arrears may be deferred until such time as the preferred equity is redeemed or sold. To maintain RIC tax treatment (as discussed in Note B.9. below), these non-cash sources of income may need to be paid out to stockholders in the form of distributions, even though Main Street may not have collected the PIK interest and cumulative dividends in cash. For the years ended December 31, 2020, 2019, and 2018, (i) approximately 2.8%, 2.0%, and 1.0%, respectively, of Main Street’s total investment income was attributable to PIK interest income not paid currently in cash and (ii) approximately 0.8%, 1.0%, and 1.0%, respectively, of Main Street’s total investment income was attributable to cumulative dividend income not paid currently in cash. Main Street stops accruing PIK interest and cumulative dividends and writes off any accrued and uncollected interest and dividends in arrears when it determines that such PIK interest and dividends in arrears are no longer collectible.

Main Street may periodically provide services, including structuring and advisory services, to its portfolio companies or other third parties. For services that are separately identifiable and evidence exists to substantiate fair value, fee income is recognized as earned, which is generally when the investment or other applicable transaction closes. Fees received in connection with debt financing transactions for services that do not meet these criteria are treated as debt origination fees and are deferred and accreted into income over the life of the financing.

A presentation of total investment income Main Street received from its Investment Portfolio in each of the periods presented is as follows:

Twelve Months Ended December 31, 


2020


2019


2018

(dollars in thousands)

Interest, fee and dividend income:

Interest income

$

173,676

$

187,381

$

177,103

Dividend income


36,373


49,782


46,471

Fee income


12,565


6,210


9,781

Total interest, fee and dividend income

$

222,614

$

243,373

$

233,355

135


Table of Contents

5.           Deferred Financing Costs

Deferred financing costs include commitment fees and other costs related to Main Street’s multi-year revolving credit facility (the “Credit Facility”) and its unsecured notes, as well as the commitment fees and leverage fees (approximately 3.4% of the total commitment and draw amounts, as applicable) on the SBIC debentures, which are not accounted for under the fair value option under ASC 825 (as discussed further in Note B.11.). See further discussion of Main Street’s debt in Note E. Deferred financing costs in connection with the Credit Facility are capitalized as an asset. Deferred financing costs in connection with all other debt arrangements not using the fair value option are a direct deduction from the related debt liability.

6.           Equity Offering Costs

The Company’s offering costs are charged against the proceeds from equity offerings when the proceeds are received.

7.           Unearned Income—Debt Origination Fees and Original Issue Discount and Discounts / Premiums to Par Value

Main Street capitalizes debt origination fees received in connection with financings and reflects such fees as unearned income netted against the applicable debt investments. The unearned income from the fees is accreted into income based on the effective interest method over the life of the financing.

In connection with its portfolio debt investments, Main Street sometimes receives nominal cost warrants or warrants with an exercise price below the fair value of the underlying equity (together, “nominal cost equity”) that are valued as part of the negotiation process with the particular portfolio company. When Main Street receives nominal cost equity, Main Street allocates its cost basis in its investment between its debt security and its nominal cost equity at the time of origination based on amounts negotiated with the particular portfolio company. The allocated amounts are based upon the fair value of the nominal cost equity, which is then used to determine the allocation of cost to the debt security. Any discount recorded on a debt investment resulting from this allocation is reflected as unearned income, which is netted against the applicable debt investment, and accreted into interest income based on the effective interest method over the life of the debt investment. The actual collection of this interest is deferred until the time of debt principal repayment.

Main Street may also purchase debt securities at a discount or at a premium to the par value of the debt security. In the case of a purchase at a discount, Main Street records the investment at the par value of the debt security net of the discount, and the discount is accreted into interest income based on the effective interest method over the life of the debt investment. In the case of a purchase at a premium, Main Street records the investment at the par value of the debt security plus the premium, and the premium is amortized as a reduction to interest income based on the effective interest method over the life of the debt investment.

To maintain RIC tax treatment (as discussed in Note B.9. below), these non-cash sources of income may need to be paid out to stockholders in the form of distributions, even though Main Street may not have collected the interest income. For the years ended December 31, 2020, 2019 and 2018, approximately 2.7%, 2.7% and 3.0%, respectively, of Main Street’s total investment income was attributable to interest income from the accretion of discounts associated with debt investments, net of any premium reduction.

8.           Share-Based Compensation

Main Street accounts for its share-based compensation plans using the fair value method, as prescribed by ASC 718, Compensation—Stock Compensation. Accordingly, for restricted stock awards, Main Street measures the grant date fair value based upon the market price of its common stock on the date of the grant and amortizes the fair value of the awards as share-based compensation expense over the requisite service period, which is generally the vesting term.

136


Table of Contents

Main Street has also adopted Accounting Standards Update (“ASU”) 2016-09, Compensation—Stock Compensation: Improvements to Employee Share-Based Payment Accounting, which requires that all excess tax benefits and tax deficiencies (including tax benefits of dividends on share-based payment awards) be recognized as income tax expense or benefit in the income statement and not delay recognition of a tax benefit until the tax benefit is realized through a reduction to taxes payable. Accordingly, the tax effects of exercised or vested awards are treated as discrete items in the reporting period in which they occur. Additionally, Main Street has elected to account for forfeitures as they occur.

9.            Income Taxes

MSCC has elected to be treated for U.S. federal income tax purposes as a RIC. MSCC’s taxable income includes the taxable income generated by MSCC and certain of its subsidiaries, including the Funds, which are treated as disregarded entities for tax purposes. As a RIC, MSCC generally will not pay corporate-level U.S. federal income taxes on any net ordinary taxable income or capital gains that MSCC distributes to its stockholders. MSCC must generally distribute at least 90% of its “investment company taxable income” (which is generally its net ordinary taxable income and realized net short-term capital gains in excess of realized net long-term capital losses) and 90% of its tax-exempt income to maintain its RIC status (pass-through tax treatment for amounts distributed). As part of maintaining RIC status, undistributed taxable income (subject to a 4% non-deductible U.S. federal excise tax) pertaining to a given fiscal year may be distributed up to 12 months subsequent to the end of that fiscal year, provided such dividends are declared on or prior to the later of (i) the filing of the U.S. federal income tax return for the applicable fiscal year or (ii) the fifteenth day of the ninth month following the close of the year in which such taxable income was generated.

The Taxable Subsidiaries primarily hold certain portfolio investments for Main Street. The Taxable Subsidiaries permit Main Street to hold equity investments in portfolio companies which are “pass-through” entities for tax purposes and to continue to comply with the “source-of-income” requirements contained in the RIC tax provisions of the Code. The Taxable Subsidiaries are consolidated with Main Street for U.S. GAAP financial reporting purposes, and the portfolio investments held by the Taxable Subsidiaries are included in Main Street’s consolidated financial statements as portfolio investments and recorded at fair value. The Taxable Subsidiaries are not consolidated with MSCC for income tax purposes and may generate income tax expense, or benefit, and tax assets and liabilities, as a result of their ownership of certain portfolio investments. The taxable income, or loss, of the Taxable Subsidiaries may differ from their book income, or loss, due to temporary book and tax timing differences and permanent differences. The Taxable Subsidiaries are each taxed at their normal corporate tax rates based on their taxable income. The income tax expense, or benefit, if any, and the related tax assets and liabilities, of the Taxable Subsidiaries are reflected in Main Street’s consolidated financial statements.

The External Investment Manager is an indirect wholly owned subsidiary of MSCC owned through a Taxable Subsidiary and is a disregarded entity for tax purposes. The External Investment Manager has entered into a tax sharing agreement with its Taxable Subsidiary owner. Since the External Investment Manager is accounted for as a portfolio investment of MSCC and is not included as a consolidated subsidiary of MSCC in MSCC’s consolidated financial statements, and as a result of the tax sharing agreement with its Taxable Subsidiary owner, for its stand-alone financial reporting purposes the External Investment Manager is treated as if it is taxed at normal corporate tax rates based on its taxable income and, as a result of its activities, may generate income tax expense or benefit. The income tax expense, or benefit, if any, and the related tax assets and liabilities, of the External Investment Manager are reflected in the External Investment Manager’s separate financial statements.

The Taxable Subsidiaries and the External Investment Manager use the liability method in accounting for income taxes. Deferred tax assets and liabilities are recorded for temporary differences between the tax basis of assets and liabilities and their reported amounts in the consolidated financial statements, using statutory tax rates in effect for the year in which the temporary differences are expected to reverse. A valuation allowance is provided, if necessary, against deferred tax assets when it is more likely than not that some portion or all of the deferred tax asset will not be realized. Our stockholder’s equity includes an adjustment to classification as a result of permanent book-to-tax differences, which include differences in the book and tax treatment of income and expenses.

137


Table of Contents

Taxable income generally differs from net income for financial reporting purposes due to temporary and permanent differences in the recognition of income and expenses. Taxable income generally excludes net unrealized appreciation or depreciation, as investment gains or losses are not included in taxable income until they are realized.

10.         Net Realized Gains or Losses and Net Unrealized Appreciation or Depreciation

Realized gains or losses are measured by the difference between the net proceeds from the sale or redemption of an investment or a financial instrument and the cost basis of the investment or financial instrument, without regard to unrealized appreciation or depreciation previously recognized, and includes investments written-off during the period net of recoveries and realized gains or losses from in-kind redemptions. Net unrealized appreciation or depreciation reflects the net change in the fair value of the Investment Portfolio and financial instruments and the reclassification of any prior period unrealized appreciation or depreciation on exited investments and financial instruments to realized gains or losses.

11.         Fair Value of Financial Instruments

Fair value estimates are made at discrete points in time based on relevant information. These estimates may be subjective in nature and involve uncertainties and matters of significant judgment and, therefore, cannot be determined with precision. Main Street believes that the carrying amounts of its financial instruments, consisting of cash and cash equivalents, receivables, payables and other liabilities approximate the fair values of such items due to the short-term nature of these instruments.

As part of Main Street’s acquisition of the majority of the equity interests of MSC II in January 2010 (the “MSC II Acquisition”), Main Street elected the fair value option under ASC 825, Financial Instruments (“ASC 825”), relating to accounting for debt obligations at their fair value, for the MSC II SBIC debentures acquired as part of the acquisition accounting related to the MSC II Acquisition and valued those obligations as discussed further in Note C. In order to provide for a more consistent basis of presentation, Main Street elected the fair value option for SBIC debentures issued by MSC II subsequent to the MSC II Acquisition. When the fair value option is elected for a given SBIC debenture, the deferred loan costs associated with the debenture are fully expensed in the current period to “Net Unrealized Appreciation (Depreciation)—SBIC debentures” as part of the fair value adjustment. Interest incurred in connection with SBIC debentures which are valued at fair value is included in interest expense.

12.         Earnings per Share

Basic and diluted per share calculations are computed utilizing the weighted-average number of shares of common stock outstanding for the period. In accordance with ASC 260, Earnings Per Share, the unvested shares of restricted stock awarded pursuant to Main Street’s equity compensation plans are participating securities and, therefore, are included in the basic earnings per share calculation. As a result, for all periods presented, there is no difference between diluted earnings per share and basic earnings per share amounts.

13.         Recently Issued or Adopted Accounting Standards

In February 2016, the FASB issued ASU 2016 02, Leases, which amended the FASB Accounting Standards Codification and created ASC 842, Leases (“ASC 842”), to require lessees to recognize on the balance sheet a right of use asset, representing its right to use the underlying asset for the lease term, and a lease liability for all leases with terms greater than 12 months, utilizing a modified retrospective transition approach, which includes a number of optional practical expedients that entities may elect to apply. The guidance in ASC 842 also requires qualitative and quantitative disclosures designed to assess the amount, timing and uncertainty of cash flows arising from leases. Main Street adopted ASC 842 effective January 1, 2019. Under ASC 842, Main Street evaluates leases to determine if the leases are considered financing or operating leases. Main Street currently has one operating lease for office space for which it has recorded a right-of-use asset and lease liability for the operating lease obligation. Non-lease components (maintenance, property tax, insurance and parking) are not included in the lease cost. The lease asset is presented as a single lease cost that is amortized on a straight-line basis over the life of the lease.

138


Table of Contents

In March 2020, the FASB issued ASU 2020-04, “Reference rate reform (Topic 848)—Facilitation of the effects of reference rate reform on financial reporting.” The amendments in this update provide optional expedients and exceptions for applying U.S. GAAP to certain contracts and hedging relationships that reference LIBOR or another reference rate expected to be discontinued due to reference rate reform and became effective upon issuance for all entities. The Company has agreements that have LIBOR as a reference rate with certain portfolio companies and also with certain lenders. Many of these agreements include language for choosing an alternative successor rate if LIBOR reference is no longer considered to be appropriate. Contract modifications are required to be evaluated in determining whether the modifications result in the establishment of new contracts or the continuation of existing contracts. The Company adopted this amendment in March 2020 and plans to apply the amendments in this update to account for contract modifications due to changes in reference rates. The Company continues to evaluate the impact that the amendments in this update will have on its consolidated financial statements and disclosures when applied.

In May 2020, the SEC published Release No. 33-10786 (the “May 2020 Release”), Amendments to Financial Disclosures about Acquired and Disposed Businesses, announcing its adoption of rules amending Rule 1-02(w)(2) used in the determination of a significant subsidiary specific to investment companies, including BDCs. In part, the rules adopted pursuant to the May 2020 Release eliminated the use of the asset test, and amended the income and investment tests for determining whether an unconsolidated subsidiary requires additional disclosure in the footnotes of the financial statements. Main Street adopted the rules pursuant to the May 2020 Release during the quarter ended June 30, 2020. The impact of the adoption of these rules on Main Street’s consolidated financial statements was not material.

In December 2020, the SEC published Release No. IC-34084 (the “December 2020 Release”) Use of Derivatives by Registered Investment Companies and Business Development Companies, announcing its adoption of rules amending Rule 18f-4 and Rule 6c-11 to provide an updated, comprehensive approach to the regulation of registered investment companies’, including BDCs’, use of derivatives and address investor protection concerns. In part, the rules adopted pursuant to the December 2020 Release require that funds using derivatives generally will have to adopt a derivatives risk management program that a derivatives risk manager administers and that the fund’s board of directors oversees, and comply with an outer limit on fund leverage. Funds that use derivatives only in a limited manner will not be subject to these requirements, but they will have to adopt and implement policies and procedures reasonably designed to manage the fund’s derivatives risks. Funds also will be subject to reporting and recordkeeping requirements regarding their derivatives use. Main Street will adopt the rules pursuant to the December 2020 Release during the quarter ended March 31, 2021. As Main Street is a limited user of derivatives, the impact of the adoption of these rules on the consolidated financial statements is not expected to be material.

From time to time, new accounting pronouncements are issued by the FASB or other standards setting bodies that are adopted by Main Street as of the specified effective date. Main Street believes that the impact of recently issued standards and any that are not yet effective will not have a material impact on its consolidated financial statements upon adoption.

NOTE C—FAIR VALUE HIERARCHY FOR INVESTMENTS AND DEBENTURES—PORTFOLIO COMPOSITION

ASC 820 defines fair value, establishes a framework for measuring fair value, establishes a fair value hierarchy based on the quality of inputs used to measure fair value, and enhances disclosure requirements for fair value measurements. Main Street accounts for its investments at fair value.

Fair Value Hierarchy

In accordance with ASC 820, Main Street has categorized its investments based on the priority of the inputs to the valuation technique into a three-level fair value hierarchy. The fair value hierarchy gives the highest priority to quoted prices in active markets for identical investments (Level 1) and the lowest priority to unobservable inputs (Level 3).

139


Table of Contents

Investments recorded on Main Street’s balance sheet are categorized based on the inputs to the valuation techniques as follows:

Level 1—Investments whose values are based on unadjusted quoted prices for identical assets in an active market that Main Street has the ability to access (examples include investments in active exchange-traded equity securities and investments in most U.S. government and agency securities).

Level 2—Investments whose values are based on quoted prices in markets that are not active or model inputs that are observable either directly or indirectly for substantially the full term of the investment. Level 2 inputs include the following:

Quoted prices for similar assets in active markets (for example, investments in restricted stock);
Quoted prices for identical or similar assets in non-active markets (for example, investments in thinly traded public companies);
Pricing models whose inputs are observable for substantially the full term of the investment (for example, market interest rate indices); and
Pricing models whose inputs are derived principally from, or corroborated by, observable market data through correlation or other means for substantially the full term of the investment.

Level 3—Investments whose values are based on prices or valuation techniques that require inputs that are both unobservable and significant to the overall fair value measurement (for example, investments in illiquid securities issued by privately held companies). These inputs reflect management’s own assumptions about the assumptions a market participant would use in pricing the investment.

As required by ASC 820, when the inputs used to measure fair value fall within different levels of the hierarchy, the level within which the fair value measurement is categorized is based on the lowest level input that is significant to the fair value measurement in its entirety. For example, a Level 3 fair value measurement may include inputs that are observable (Levels 1 and 2) and unobservable (Level 3). Therefore, unrealized appreciation and depreciation related to such investments categorized within the Level 3 tables below may include changes in fair value that are attributable to both observable inputs (Levels 1 and 2) and unobservable inputs (Level 3).

As of December 31, 2020 and 2019, all of Main Street’s LMM portfolio investments consisted of illiquid securities issued by privately held companies and the fair value determination for these investments primarily consisted of unobservable inputs. As a result, all of Main Street’s LMM portfolio investments were categorized as Level 3 as of December 31, 2020 and 2019.

As of December 31, 2020 and 2019, Main Street’s Middle Market portfolio investments consisted primarily of investments in secured and unsecured debt investments and independently rated debt investments. The fair value determination for these investments consisted of a combination of observable inputs in non-active markets for which sufficient observable inputs were not available to determine the fair value of these investments and unobservable inputs. As a result, all of Main Street’s Middle Market portfolio investments were categorized as Level 3 as of December 31, 2020 and 2019.

As of December 31, 2020 and 2019, Main Street’s Private Loan portfolio investments primarily consisted of investments in interest-bearing secured debt investments. The fair value determination for these investments consisted of a combination of observable inputs in non-active markets for which sufficient observable inputs were not available to determine the fair value of these investments and unobservable inputs. As a result, all of Main Street’s Private Loan portfolio investments were categorized as Level 3 as of December 31, 2020 and 2019.

140


Table of Contents

As of December 31, 2020 and 2019, Main Street’s Other Portfolio investments consisted of illiquid securities issued by privately held companies and the fair value determination for these investments primarily consisted of unobservable inputs. As a result, all of Main Street’s Other Portfolio investments were categorized as Level 3 as of December 31, 2020 and 2019.

The fair value determination of each portfolio investment categorized as Level 3 required one or more of the following unobservable inputs:

Financial information obtained from each portfolio company, including unaudited statements of operations and balance sheets for the most recent period available as compared to budgeted numbers;
Current and projected financial condition of the portfolio company;
Current and projected ability of the portfolio company to service its debt obligations;
Type and amount of collateral, if any, underlying the investment;
Current financial ratios (e.g., fixed charge coverage ratio, interest coverage ratio and net debt/EBITDA ratio) applicable to the investment;
Current liquidity of the investment and related financial ratios (e.g., current ratio and quick ratio);
Pending debt or capital restructuring of the portfolio company;
Projected operating results of the portfolio company;
Current information regarding any offers to purchase the investment;
Current ability of the portfolio company to raise any additional financing as needed;
Changes in the economic environment which may have a material impact on the operating results of the portfolio company;
Internal occurrences that may have an impact (both positive and negative) on the operating performance of the portfolio company;
Qualitative assessment of key management;
Contractual rights, obligations or restrictions associated with the investment; and
Other factors deemed relevant.

The use of significant unobservable inputs creates uncertainty in the measurement of fair value as of the reporting date. The significant unobservable inputs used in the fair value measurement of Main Street’s LMM equity securities, which are generally valued through an average of the discounted cash flow technique and the market comparable/enterprise value technique (unless one of these approaches is determined to not be appropriate), are (i) EBITDA multiples and (ii) the weighted-average cost of capital (“WACC”). Significant increases (decreases) in EBITDA multiple inputs in isolation would result in a significantly higher (lower) fair value measurement. On the contrary, significant increases (decreases) in WACC inputs in isolation would result in a significantly lower (higher) fair value measurement. The significant unobservable inputs used in the fair value measurement of Main Street’s LMM, Middle Market and Private Loan securities are (i) risk adjusted discount rates used in the Yield-to-Maturity valuation technique (see “Note B.1.—Valuation of the Investment Portfolio”) and (ii) the percentage of expected principal recovery. Significant increases (decreases) in any of these discount rates in isolation would result in a significantly lower

141


Table of Contents

(higher) fair value measurement. Significant increases (decreases) in any of these expected principal recovery percentages in isolation would result in a significantly higher (lower) fair value measurement. However, due to the nature of certain investments, fair value measurements may be based on other criteria, such as third-party appraisals of collateral and fair values as determined by independent third parties, which are not presented in the tables below.

The following tables provide a summary of the significant unobservable inputs used to fair value Main Street’s Level 3 portfolio investments as of December 31, 2020 and 2019:


Fair Value as of


December 31, 


Type of

2020

Significant

Weighted


Investment


(in thousands)

Valuation Technique

Unobservable Inputs

Range(3)

Average(3)

Median(3)

Equity investments

$

877,732


Discounted cash flow


WACC


9.4% - 21.0%


14.3

%

15.0

%


Market comparable / Enterprise Value


EBITDA multiple (1)


4.5x - 8.5x(2)


7.0x


6.1x

Debt investments

$

1,339,079


Discounted cash flow


Risk adjusted discount factor


7.4% - 15.3%(2)


10.6

%

10.8

%


Expected principal recovery percentage


0.0% - 100.0%


99.4

%

100.0

%

Debt investments

$

468,055


Market approach


Third‑party quote


45 - 100.3


94.7


96.5

Total Level 3 investments

$

2,684,866


(1)EBITDA may include proforma adjustments and/or other addbacks based on specific circumstances related to each investment.
(2)Range excludes outliers that are greater than one standard deviation from the mean. Including these outliers, the range for EBITDA multiple is 2.2x - 15.0x and the range for risk adjusted discount factor is 5.4% - 29.5%.
(3)Does not include investments for which the valuation technique does not include the use of the applicable fair value input.


Fair Value as of


December 31, 


Type of

2019

Significant

Weighted


Investment


(in thousands)

Valuation Technique

Unobservable Inputs

Range(3)

Average(3)

Median(3)

Equity investments

$

819,749


Discounted cash flow


WACC


9.6% - 20.3%


13.6

%

14.2

%


Market comparable / Enterprise Value


EBITDA multiple (1)


4.9x - 8.5x(2)


7.2x


6.4x

Debt investments

$

1,212,741


Discounted cash flow


Risk adjusted discount factor


5.9% - 16.5%(2)


10.4

%

10.0

%


Expected principal recovery percentage


1.4% - 100.0%


99.3

%

100.0

%

Debt investments

$

569,834


Market approach


Third‑party quote


28.1 - 101.0


94.7


98.0

Total Level 3 investments

$

2,602,324


(1)EBITDA may include proforma adjustments and/or other addbacks based on specific circumstances related to each investment.
(2)Range excludes outliers that are greater than one standard deviation from the mean. Including these outliers, the range for EBITDA multiple is 4.5x - 15.0x and the range for risk adjusted discount factor is 4.6% - 38.0%.
(3)Does not include investments for which the valuation technique does not include the use of the applicable fair value input.

142


Table of Contents

The following tables provide a summary of changes in fair value of Main Street’s Level 3 portfolio investments for the years ended December 31, 2020 and 2019 (amounts in thousands):

Net

Fair Value

Transfers

Changes

Net

Fair Value

as of

Into

from

Unrealized

as of

Type of


December 31, 


Level 3


Redemptions/


New


Unrealized


Appreciation


December 31, 

Investment


2019


Hierarchy


Repayments


Investments


to Realized


(Depreciation)


Other(1)


2020

Debt

$

1,782,575

$

$

(544,545)

$

560,536

$

110,099

$

(78,866)

$

(22,665)

$

1,807,134

Equity

809,538

(51,251)

114,733

8,938

(38,404)

22,665

866,219

Equity Warrant

10,211

(2,245)

2,245

1,302

11,513

$

2,602,324

$

$

(598,041)

$

675,269

$

121,282

$

(115,968)

$

$

2,684,866


(1)Includes the impact of non-cash conversions. These transactions represent non-cash investing activities. See additional cash flow information at the consolidated statements of cash flows.


Net


Fair Value

Transfers

Changes

Net

Fair Value

as of

Into

from

Unrealized

as of

Type of

December 31, 

Level 3

Redemptions/

New

Unrealized

Appreciation

December 31, 

Investment

2018

Hierarchy

Repayments

Investments


to Realized

(Depreciation)

Other(1)

2019

Debt

$

1,686,753

$

$

(471,923)

$

595,285

$

35,204

$

(43,969)

$

(18,775)

$

1,782,575

Equity


755,710


(24,322)


46,046


(15,287)


26,809


20,582


809,538

Equity Warrant


11,446


1,217


316


(1,090)


129


(1,807)


10,211

$

2,453,909

$

$

(495,028)

$

641,647

$

18,827

$

(17,031)

$

$

2,602,324


(1)Includes the impact of non-cash conversions. These transactions represent non-cash investing activities. See additional cash flow information at the consolidated statements of cash flows.

As of December 31, 2019, the fair value determination for the SBIC debentures recorded at fair value primarily consisted of unobservable inputs. As a result, the SBIC debentures which were recorded at fair value were categorized as Level 3. Main Street determined the fair value of these instruments primarily using a Yield-to-Maturity approach that analyzed the discounted cash flows of interest and principal for each SBIC debenture recorded at fair value based on estimated market interest rates for debt instruments of similar structure, terms, and maturity. Main Street’s estimate of the expected repayment date of principal for each SBIC debenture recorded at fair value was the legal maturity date of the instrument. The significant unobservable inputs used in the fair value measurement of Main Street’s SBIC debentures recorded at fair value were the estimated market interest rates used to fair value each debenture using the yield valuation technique described above. As of December 31, 2020, all of the SBIC debentures previously accounted for on a fair value basis have been repaid.

The following tables provide a summary of changes for the Level 3 SBIC debentures recorded at fair value for the years ended December 31, 2020 and 2019 (amounts in thousands):


Fair Value


Net


Fair Value

as of

Unrealized

as of

Type of

December 31, 

Net Realized

New SBIC

(Appreciation)

December 31, 

Investment


2019

Repayments

Loss

Debentures


Depreciation


2020

SBIC debentures at fair value

$

21,927

$

(22,000)

$

533

$

$

(460)

$


Fair Value


Net


Fair Value

as of

Unrealized

as of

Type of

December 31, 

Net Realized

New SBIC

(Appreciation)

December 31, 

Investment


2018

Repayments

Loss

Debentures


Depreciation


2019

SBIC debentures at fair value

$

44,688

$

(24,000)

$

5,689

$

$

(4,450)

$

21,927

143


Table of Contents

The following tables provide a summary of the significant unobservable inputs used to fair value Main Street’s Level 3 SBIC debentures as of December 31, 2019 (amounts in thousands):


Fair Value


Type of

as of

Significant

Weighted


Investment

December 31, 2019

Valuation Technique

Unobservable Inputs

Range

Average


SBIC debentures

$

21,927


Discounted cash flow


Estimated market interest rates


3.2% - 3.5%

3.2

%

At December 31, 2020 and 2019, Main Street’s investments and SBIC debentures at fair value were categorized as follows in the fair value hierarchy for ASC 820 purposes:

Fair Value Measurements

(in thousands)


Quoted Prices in


Significant


Active Markets for


Significant Other


Unobservable


Identical Assets


Observable Inputs


Inputs

At December 31, 2020

Fair Value


(Level 1)

(Level 2)


(Level 3)

LMM portfolio investments

$

1,285,524

$

$

$

1,285,524

Middle Market portfolio investments


445,609


445,609

Private Loan portfolio investments


740,370


740,370

Other Portfolio investments


96,603


96,603

External Investment Manager


116,760


116,760

Total investments

$

2,684,866

$

$

$

2,684,866


Fair Value Measurements

(in thousands)

Quoted Prices in

Significant


Active Markets for


Significant Other

Unobservable


Identical Assets


Observable Inputs


Inputs

At December 31, 2019

Fair Value


(Level 1)


(Level 2)


(Level 3)

LMM portfolio investments

$

1,206,865

$

$

$

1,206,865

Middle Market portfolio investments


522,083


522,083

Private Loan portfolio investments


692,117


692,117

Other Portfolio investments


106,739


106,739

External Investment Manager


74,520


74,520

Total investments

$

2,602,324

$

$

$

2,602,324

SBIC debentures at fair value

$

21,927

$

$

$

21,927

Investment Portfolio Composition

Main Street’s LMM portfolio investments primarily consist of secured debt, equity warrants and direct equity investments in privately held, LMM companies based in the United States. Main Street’s LMM portfolio companies generally have annual revenues between $10 million and $150 million, and its LMM investments generally range in size from $5 million to $50 million. The LMM debt investments are typically secured by either a first or second priority lien on the assets of the portfolio company, can include either fixed or floating rate terms and generally have a term of between five and seven years from the original investment date. In most LMM portfolio investments, Main Street receives nominally priced equity warrants and/or makes direct equity investments in connection with a debt investment.

Main Street’s Middle Market portfolio investments primarily consist of direct investments in or secondary purchases of interest-bearing debt securities in privately held companies based in the United States that are generally larger in size than the companies included in Main Street’s LMM portfolio. Main Street’s Middle Market portfolio companies generally have annual revenues between $150 million and $1.5 billion, and its Middle Market investments generally range in size from $3 million to $20 million. Main Street’s Middle Market portfolio debt investments are generally secured by either a first or second priority lien on the assets of the portfolio company and typically have a term of between three and seven years from the original investment date.

144


Table of Contents

Main Street’s private loan (“Private Loan”) portfolio investments are primarily debt securities in privately held companies that have been originated through strategic relationships with other investment funds on a collaborative basis, and are often referred to in the debt markets as “club deals.” Private Loan investments are typically similar in size, structure, terms and conditions to investments Main Street holds in its LMM portfolio and Middle Market portfolio. Main Street’s Private Loan portfolio debt investments are generally secured by either a first or second priority lien on the assets of the portfolio company and typically have a term of between three and seven years from the original investment date.

Main Street’s other portfolio (“Other Portfolio”) investments primarily consist of investments that are not consistent with the typical profiles for its LMM, Middle Market or Private Loan portfolio investments, including investments which may be managed by third parties. In the Other Portfolio, Main Street may incur indirect fees and expenses in connection with investments managed by third parties, such as investments in other investment companies or private funds. For Other Portfolio investments, Main Street generally receives distributions related to the assets held by the portfolio company. Those assets are typically expected to be liquidated over a five to ten-year period.

Main Street’s external asset management business is conducted through its External Investment Manager. The External Investment Manager earns management fees based on the assets of the funds under management and may earn incentive fees, or a carried interest, based on the performance of the funds managed. Main Street entered into an agreement with the External Investment Manager to share employees in connection with its asset management business generally, and specifically for its relationship with MSC Income Fund, Inc. (“MSC Income”), formerly known as HMS Income Fund, Inc. Through this agreement, Main Street shares employees with the External Investment Manager, including their related infrastructure, business relationships, management expertise and capital raising capabilities. Main Street allocates the related expenses to the External Investment Manager pursuant to the sharing agreement. Main Street’s total expenses for the year ended December 31, 2020, 2019, and 2018, are net of expenses allocated to the External Investment Manager of $7.4 million, $6.7 million, and $6.8 million, respectively.

Investment income, consisting of interest, dividends and fees, can fluctuate dramatically due to various factors, including the level of new investment activity, repayments of debt investments or sales of equity interests. Investment income in any given year could also be highly concentrated among several portfolio companies. For the years ended December 31, 2020 and 2019, Main Street did not record investment income from any single portfolio company in excess of 10% of total investment income.

The following tables provide a summary of Main Street’s investments in the LMM, Middle Market and Private Loan portfolios as of December 31, 2020 and 2019 (this information excludes the Other Portfolio investments and the External Investment Manager which are discussed further below):


As of December 31, 2020


LMM (a)

Middle Market

Private Loan


(dollars in millions)


Number of portfolio companies

70


42


63

Fair value

$

1,285.5


$

445.6


$

740.4

Cost

$

1,104.6


$

488.9


$

769.0

Debt investments as a % of portfolio (at cost)

65.8

%

93.0

%

93.8

%

Equity investments as a % of portfolio (at cost)

34.2

%

7.0

%

6.2

%

% of debt investments at cost secured by first priority lien

98.1

%

92.4

%

95.4

%

Weighted-average annual effective yield (b)

11.6

%

7.9

%

8.7

%

Average EBITDA (c)

$

5.3


$

76.5


$

58.1


(a)At December 31, 2020, Main Street had equity ownership in approximately 99% of its LMM portfolio companies, and the average fully diluted equity ownership in those portfolio companies was approximately 38%.
(b)The weighted-average annual effective yields were computed using the effective interest rates for all debt investments at cost as of December 31, 2020, including amortization of deferred debt origination fees and accretion of original issue discount but excluding fees payable upon repayment of the debt instruments and any debt

145


Table of Contents

investments on non-accrual status. The weighted-average annual effective yield is higher than what an investor in shares of Main Street’s common stock will realize on its investment because it does not reflect Main Street’s expenses or any sales load paid by an investor.
(c)The average EBITDA is calculated using a simple average for the LMM portfolio and a weighted-average for the Middle Market and Private Loan portfolios. These calculations exclude certain portfolio companies, including three LMM portfolio companies, one Middle Market portfolio company and four Private Loan portfolio companies, as EBITDA is not a meaningful valuation metric for Main Street’s investments in these portfolio companies, and those portfolio companies whose primary purpose is to own real estate.


As of December 31, 2019


LMM (a)

Middle Market

Private Loan


(dollars in millions)


Number of portfolio companies

69


51


65

Fair value

$

1,206.9


$

522.1


$

692.1

Cost

$

1,002.2


$

572.3


$

734.8

Debt investments as a % of portfolio (at cost)

65.9

%

94.8

%

94.6

%

Equity investments as a % of portfolio (at cost)

34.1

%

5.2

%

5.4

%

% of debt investments at cost secured by first priority lien

98.1

%

91.3

%

95.4

%

Weighted-average annual effective yield (b)

11.8

%

8.6

%

9.5

%

Average EBITDA (c)

$

5.1


$

85.0


$

57.8


(a)At December 31, 2019, Main Street had equity ownership in approximately 99% of its LMM portfolio companies, and the average fully diluted equity ownership in those portfolio companies was approximately 42%.
(b)The weighted-average annual effective yields were computed using the effective interest rates for all debt investments at cost as of December 31, 2019, including amortization of deferred debt origination fees and accretion of original issue discount but excluding fees payable upon repayment of the debt instruments and any debt investments on non-accrual status. The weighted-average annual effective yield is higher than what an investor in shares of Main Street’s common stock will realize on its investment because it does not reflect Main Street’s expenses or any sales load paid by an investor.
(c)The average EBITDA is calculated using a simple average for the LMM portfolio and a weighted-average for the Middle Market and Private Loan portfolios. These calculations exclude certain portfolio companies, including three LMM portfolio companies, two Middle Market portfolio companies and three Private Loan portfolio companies, as EBITDA is not a meaningful valuation metric for Main Street’s investments in these portfolio companies, and those portfolio companies whose primary purpose is to own real estate.

As of December 31, 2020, Main Street had Other Portfolio investments in twelve companies, collectively totaling approximately $96.6 million in fair value and approximately $124.7 million in cost basis and which comprised approximately 3.6% of Main Street’s Investment Portfolio at fair value. As of December 31, 2019, Main Street had Other Portfolio investments in eleven companies, collectively totaling approximately $106.7 million in fair value and approximately $118.4 million in cost basis and which comprised approximately 4.1% of Main Street’s Investment Portfolio at fair value.

As discussed further in Note A.1., Main Street holds an investment in the External Investment Manager, a wholly owned subsidiary that is treated as a portfolio investment. As of December 31, 2020, there was a $29.5 million cost basis in this investment and the investment had a fair value of approximately $116.8 million, which comprised approximately 4.3% of Main Street’s Investment Portfolio at fair value. As of December 31, 2019, there was no cost basis in this investment and the investment had a fair value of approximately $74.5 million, which comprised approximately 2.9% of Main Street’s Investment Portfolio at fair value.

The following tables summarize the composition of Main Street’s total combined LMM portfolio investments, Middle Market portfolio investments and Private Loan portfolio investments at cost and fair value by type of investment

146


Table of Contents

as a percentage of the total combined LMM portfolio investments, Middle Market portfolio investments and Private Loan portfolio investments, as of December 31, 2020 and 2019 (this information excludes the Other Portfolio investments and the External Investment Manager).

Cost:


December 31, 2020


December 31, 2019

First lien debt


77.0

%  

78.2

%

Equity


19.0

%  

17.2

%

Second lien debt


2.7

%  

3.5

%

Equity warrants


0.5

%  

0.6

%

Other


0.8

%  

0.5

%


100.0

%  

100.0

%

Fair Value:


December 31, 2020


December 31, 2019


First lien debt


70.0

%  

70.1

%


Equity


26.4

%  

26.0

%


Second lien debt


2.4

%  

3.0

%


Equity warrants


0.4

%  

0.4

%


Other


0.8

%  

0.5

%


100.0

%  

100.0

%


The following tables summarize the composition of Main Street’s total combined LMM portfolio investments, Middle Market portfolio investments and Private Loan portfolio investments by geographic region of the United States and other countries at cost and fair value as a percentage of the total combined LMM portfolio investments, Middle Market portfolio investments and Private Loan portfolio investments, as of December 31, 2020 and 2019 (this information excludes the Other Portfolio investments and the External Investment Manager). The geographic composition is determined by the location of the corporate headquarters of the portfolio company.

Cost:


December 31, 2020


December 31, 2019


Southwest


24.3

%  

25.0

%


Northeast


22.6

%  

14.8

%


West


21.0

%  

24.6

%


Midwest


18.2

%  

20.6

%


Southeast


12.8

%  

13.2

%


Canada


1.1

%  

1.2

%


Other Non-United States


0.0

%  

0.6

%


100.0

%  

100.0

%


Fair Value:


December 31, 2020


December 31, 2019


Southwest


24.7

%  

26.7

%


Northeast


21.7

%  

14.4

%


West


21.4

%  

25.1

%


Midwest


19.7

%  

20.6

%


Southeast


11.5

%  

11.6

%


Canada


1.0

%  

1.1

%


Other Non-United States


0.0

%  

0.5

%


100.0

%  

100.0

%


Main Street’s LMM portfolio investments, Middle Market portfolio investments and Private Loan portfolio investments are in companies conducting business in a variety of industries. The following tables summarize the composition of Main Street’s total combined LMM portfolio investments, Middle Market portfolio investments and

147


Table of Contents

Private Loan portfolio investments by industry at cost and fair value as of December 31, 2020 and 2019 (this information excludes the Other Portfolio investments and the External Investment Manager).

Cost:

December 31, 2020

December 31, 2019

Machinery


6.4

%  

7.7

%

Construction & Engineering


6.0

%  

5.4

%

Aerospace & Defense


5.9

%  

4.9

%

Internet Software & Services


5.2

%  

4.1

%

Health Care Providers & Services


5.1

%  

4.5

%

Professional Services


5.1

%  

2.9

%

Commercial Services & Supplies


4.7

%  

6.1

%

Energy Equipment & Services


4.5

%  

5.4

%

Software


4.4

%  

2.4

%

Leisure Equipment & Products


4.2

%  

3.8

%

IT Services


4.0

%  

4.6

%

Communications Equipment


3.3

%  

3.1

%

Oil, Gas & Consumable Fuels


3.2

%  

3.6

%

Specialty Retail


3.1

%  

3.1

%

Hotels, Restaurants & Leisure


2.6

%  

3.7

%

Diversified Telecommunication Services


2.6

%  

3.9

%

Food Products


2.6

%  

3.0

%

Tobacco


2.2

%  

%

Media


2.1

%  

5.3

%

Distributors


2.1

%  

1.1

%

Diversified Financial Services


2.1

%  

1.9

%

Electronic Equipment, Instruments & Components


1.9

%  

3.5

%

Containers & Packaging


1.6

%  

1.7

%

Computers & Peripherals


1.5

%  

2.3

%

Building Products


1.4

%  

1.3

%

Life Sciences Tools & Services


1.4

%  

%

Household Durables


1.3

%  

0.2

%

Trading Companies & Distributors


1.2

%  

%

Diversified Consumer Services


1.0

%  

0.4

%

Transportation Infrastructure


1.0

%  

1.0

%

Food & Staples Retailing

1.0

%  

1.0

%

Chemicals

0.9

%  

1.0

%

Construction Materials

0.5

%  

1.0

%

Road & Rail

0.4

%  

1.4

%

Other (1)

3.5

%  

4.7

%


100.0

%  

100.0

%


(1)Includes various industries with each industry individually less than 1.0% of the total combined LMM portfolio investments, Middle Market portfolio investments and Private Loan portfolio investments at each date.

148


Table of Contents

Fair Value:

December 31, 2020

December 31, 2019

Machinery


8.1

%  

9.9

%

Construction & Engineering


6.1

%  

5.6

%

Aerospace & Defense


5.7

%  

4.7

%

Health Care Providers & Services


5.2

%  

4.3

%

Software


4.6

%  

2.7

%

Commercial Services & Supplies


4.5

%  

5.5

%

Internet Software & Services


4.5

%  

3.8

%

Leisure Equipment & Products


4.0

%  

3.5

%

Professional Services


4.0

%  

2.2

%

IT Services


3.8

%  

4.8

%

Specialty Retail


3.4

%  

3.4

%

Energy Equipment & Services


3.0

%  

4.9

%

Diversified Consumer Services


3.0

%  

2.2

%

Computers & Peripherals


2.9

%  

3.8

%

Communications Equipment


2.7

%  

2.7

%

Oil, Gas & Consumable Fuels


2.7

%  

3.2

%

Media


2.5

%  

4.7

%

Diversified Financial Services


2.3

%  

2.1

%

Food Products


2.2

%  

2.7

%

Distributors


2.1

%  

1.0

%

Tobacco


2.1

%  

%

Diversified Telecommunication Services


2.0

%  

3.3

%

Hotels, Restaurants & Leisure


2.0

%  

3.3

%

Containers & Packaging


1.7

%  

1.7

%

Building Products


1.4

%  

1.2

%

Life Sciences Tools & Services


1.4

%  

%

Construction Materials


1.4

%  

1.5

%

Electronic Equipment, Instruments & Components


1.3

%  

2.7

%

Household Durables


1.3

%  

0.1

%

Trading Companies & Distributors

1.2

%  

%  

Transportation Infrastructure

1.0

%  

1.0

%  

Food & Staples Retailing

0.9

%  

1.0

%  

Road & Rail

0.6

%  

1.5

%  

Other (1)

4.4

%  

5.0

%  

100.0

%  

100.0

%  


(1)Includes various industries with each industry individually less than 1.0% of the total combined LMM portfolio investments, Middle Market portfolio investments and Private Loan portfolio investments at each date.

At December 31, 2020 and 2019, Main Street had no portfolio investment that was greater than 10% of the Investment Portfolio at fair value.

Unconsolidated Significant Subsidiaries

In accordance with Rules 3-09 and 4-08(g) of Regulation S-X, Main Street must determine which of its unconsolidated controlled portfolio companies, if any, are considered “significant subsidiaries.” On May 20, 2020, the SEC published in Release No. 33-10786, Amendments to Financial Disclosures about Acquired and Disposed Businesses, amendments to Rule 1-02(w)(2) of Regulation S-X used in the determination of a significant subsidiary specific to investment companies, including BDCs. The amendments become effective on January 1, 2021, but the SEC allowed for early application. Main Street elected to apply these revisions effective June 30, 2020. In evaluating its unconsolidated controlled portfolio companies in accordance with the revised rules, there are two tests that Main Street must utilize to determine if any of Main Street’s Control Investments (as defined in Note A, including those

149


Table of Contents

unconsolidated portfolio companies defined as Control Investments in which Main Street does not own greater than 50% of the voting securities or maintain greater than 50% of the board representation) are considered significant subsidiaries: the investment test and the income test. The investment test is generally measured by dividing Main Street’s investment in the Control Investment by the value of Main Street’s total investments. The income test is generally measured by dividing the absolute value of the combined sum of total investment income, net realized gain (loss) and net unrealized appreciation (depreciation) from the relevant Control Investment for the period being tested by the absolute value of Main Street’s change in net assets resulting from operations for the same period. Rules 3-09 and 4-08(g) of Regulation S-X, as interpreted by the SEC, require Main Street to include (1) separate audited financial statements of an unconsolidated majority-owned subsidiary (Control Investments in which Main Street owns greater than 50% of the voting securities) in an annual report and (2) summarized financial information of a Control Investment in a quarterly report, respectively, if certain thresholds of the investment or income tests are exceeded and the unconsolidated portfolio company qualifies as a significant subsidiary.

As of December 31, 2020, 2019 and 2018, Main Street had no single investment that qualified as a significant subsidiary under either the investment or income tests.

NOTE D—EXTERNAL INVESTMENT MANAGER

As discussed further in Note A.1., the External Investment Manager provides investment management and other services to External Parties. The External Investment Manager is accounted for as a portfolio investment of MSCC since the External Investment Manager conducts all of its investment management activities for External Parties.

During May 2012, Main Street entered into an investment sub-advisory agreement with HMS Adviser, LP (“HMS Adviser”), which was the investment advisor to MSC Income at the time, to provide certain investment advisory services to HMS Adviser. In December 2013, after obtaining required no-action relief from the SEC to allow it to own a registered investment adviser, Main Street assigned the sub-advisory agreement to the External Investment Manager since the fees received from such arrangement could otherwise have negative consequences on MSCC’s ability to meet the source-of-income requirement necessary for it to maintain its RIC tax treatment. Under the investment sub-advisory agreement, the External Investment Manager was entitled to 50% of the annual base management fee and the incentive fees earned by HMS Adviser under its advisory agreement with MSC Income. Effective October 30, 2020, the External Investment Manager and HMS Adviser consummated the transactions contemplated by that certain asset purchase agreement by and among the External Investment Manager, HMS Adviser and the other parties thereto whereby the External Investment Manager became the sole investment adviser and administrator to MSC Income pursuant to an Investment Advisory and Administrative Services Agreement entered into between the External Investment Manager and MSC Income (the “Advisory Agreement”). The Advisory Agreement includes a 1.75% annual management fee, reduced from 2.00%, and the same incentive fee as under MSC Income’s prior advisory agreement with HMS Adviser, with the External Investment Manager receiving 100% of such fee income (increased from 50% previously).

The External Investment Manager agreed to waive the historical incentive fees otherwise earned through December 31, 2018. During the year ended December 31, 2020, the External Investment Manager earned $10.7 million in base management fee income and no incentive fees compared to $11.1 million of base management fees and $2.0 million in incentive fees in 2019 and $11.6 million of base management fees in 2018 for the investment advisory services provided to MSC Income.

The investment in the External Investment Manager is accounted for using fair value accounting, with the fair value determined by Main Street and approved, in good faith, by Main Street’s Board of Directors. Main Street determines the fair value of the External Investment Manager using the Waterfall valuation method under the market approach (see further discussion in Note B.1.). Any change in fair value of the investment in the External Investment Manager is recognized on Main Street’s consolidated statements of operations in “Net Unrealized Appreciation (Depreciation)—Control investments.”

The External Investment Manager is an indirect wholly owned subsidiary of MSCC owned through a Taxable Subsidiary and is a disregarded entity for tax purposes. The External Investment Manager has entered into a tax sharing agreement with its Taxable Subsidiary owner. Since the External Investment Manager is accounted for as a portfolio

150


Table of Contents

investment of MSCC and is not included as a consolidated subsidiary of MSCC in MSCC’s consolidated financial statements, and as a result of the tax sharing agreement with its Taxable Subsidiary owner, for financial reporting purposes the External Investment Manager is treated as if it is taxed at normal corporate tax rates based on its taxable income and, as a result of its activities, may generate income tax expense or benefit. Main Street owns the External Investment Manager through the Taxable Subsidiary to allow MSCC to continue to comply with the “source-of-income” requirements contained in the RIC tax provisions of the Code. The taxable income, or loss, of the External Investment Manager may differ from its book income, or loss, due to temporary book and tax timing differences and permanent differences. As a result of the above described financial reporting and tax treatment, the External Investment Manager provides for any income tax expense, or benefit, and any tax assets or liabilities in its separate financial statements.

Main Street shares employees with the External Investment Manager and allocates costs related to such shared employees to the External Investment Manager generally based on a combination of the direct time spent, new investment origination activity and assets under management, depending on the nature of the expense. For the years ended December 31, 2020, 2019 and 2018, Main Street allocated $7.4 million, $6.7 million and $6.8 million of total expenses, respectively, to the External Investment Manager. The total contribution of the External Investment Manager to Main Street’s net investment income consists of the combination of the expenses allocated to the External Investment Manager and the dividend income earned from the External Investment Manager. For the years ended December 31, 2020, 2019 and 2018, the total contribution to Main Street’s net investment income was $9.9 million, $11.7 million and $10.6 million, respectively.

Summarized financial information from the separate financial statements of the External Investment Manager as of December 31, 2020 and 2019 and for the years ended December 31, 2020, 2019 and 2018 is as follows:

As of 

As of 

December 31, 

December 31, 


2020


2019

(dollars in thousands)

Cash

$

$

Accounts receivable—MSC Income Fund


3,520


2,708

Total assets

$

3,520

$

2,708

Accounts payable to MSCC and its subsidiaries

$

2,423

$

1,592

Dividend payable to MSCC and its subsidiaries


1,097


1,116

Equity


Total liabilities and equity

$

3,520

$

2,708

Twelve Months Ended 

December 31, 


2020


2019


2018

(dollars in thousands)

Management fee income

$

10,665

$

11,116

$

11,592

Incentive fees


1,972


Total revenues


10,665


13,088


11,592

Expenses allocated from MSCC or its subsidiaries:


Salaries, share‑based compensation and other personnel costs

(4,984)

(4,388)

(4,324)

Other G&A expenses

(2,445)

(2,284)

(2,444)

Total allocated expenses


(7,429)


(6,672)


(6,768)

Pre‑tax income


3,236


6,416


4,824

Tax expense


(745)


(1,427)


(1,002)

Net income

$

2,491

$

4,989

$

3,822

151


Table of Contents

NOTE E—DEBT

Summary of debt as of December 31, 2020 is as follows:


Outstanding Balance


Unamortized Debt Issuance Costs/Premiums


Recorded Value


Estimated Fair Value (1)

(in thousands)

SBIC Debentures

$

309,800

$

(5,828)

$

303,972

$

309,907

Credit Facility

269,000

-

269,000

269,000

4.50% Notes due 2022

185,000

(1,164)

183,836

194,938

5.20% Notes due 2024

450,000

1,817

451,817

488,102

Total Debt

$

1,213,800

$

(5,175)

$

1,208,625

$

1,261,947

Summary of debt as of December 31, 2019 is as follows:


Outstanding Balance


Unamortized Debt Issuance Costs/Premiums and Fair Value Adjustments


Recorded Value


Estimated Fair Value (1)

(in thousands)

SBIC Debentures

$

311,800

$

(5,612)

$

306,188

$

310,210

Credit Facility

300,000

-

300,000

300,000

4.50% Notes due 2022

185,000

(1,771)

183,229

194,812

5.20% Notes due 2024

325,000

(405)

324,595

350,929

Total Debt

$

1,121,800

$

(7,788)

$

1,114,012

$

1,155,951


(1)Estimated fair value for outstanding debt if Main Street had adopted the fair value option under ASC 825.

Summarized interest expense for the twelve months ended December 31, 2020, 2019 and 2018 is as follows (in thousands):

Twelve Months Ended December 31, 

2020


2019


2018

SBIC Debentures

$

11,867

$

12,739

$

12,754

Credit Facility

9,232

10,974

11,723

6.125% Notes

-

-

1,464

4.50% Notes Due 2019

-

7,881

8,597

4.50% Notes Due 2022

8,932

8,932

8,955

5.20% Notes Due 2024

19,556

9,732

-

Total Interest Expense

$

49,587

$

50,258

$

43,493

SBIC Debentures

Under existing SBIC regulations, SBA-approved SBICs under common control have the ability to issue debentures guaranteed by the SBA up to a regulatory maximum amount of $350.0 million. Main Street’s SBIC debentures payable, under existing SBA-approved commitments, were $309.8 million and $311.8 million at December 31, 2020 and 2019, respectively. SBIC debentures provide for interest to be paid semiannually, with principal due at the applicable 10-year maturity date of each debenture. During the year ended December 31, 2020, Main Street issued $40.0 million of SBIC debentures and prepaid the remaining $42.0 million of existing MSC II SBIC debentures. As a result of this prepayment, Main Street recognized a realized loss of $0.5 million, due primarily to the write-off of the related unamortized deferred financing costs. Main Street expects to issue new SBIC debentures under the SBIC

152


Table of Contents

program in the future in an amount up to the regulatory maximum amount for affiliated SBIC funds. The weighted-average annual interest rate on the SBIC debentures was 3.4% and 3.6% as of December 31, 2020 and 2019, respectively. The first principal maturity due under the existing SBIC debentures is in 2021, and the weighted-average remaining duration as of December 31, 2020 was approximately 5.4 years. In accordance with SBIC regulations, the Funds are precluded from incurring additional non-SBIC debt without the prior approval of the SBA.

As of December 31, 2020, the recorded value of the SBIC debentures was $304.0 million, which consisted of (i)  $134.8 million par value of SBIC debentures outstanding issued by MSMF, with a recorded value of $133.3 million that was net of unamortized debt issuance costs of $1.5 million and (ii) $175.0 million par value of SBIC debentures issued by MSC III with a recorded value of $170.7 million that was net of unamortized debt issuance costs of $4.3 million.

The maturity dates and fixed interest rates for Main Street’s SBIC Debentures as of December 31, 2020 and 2019 are summarized in the following table:

Fixed

Interest

December 31, 

December 31, 

Maturity Date

Rate

2020

2019

9/1/2020

3.50

%

$

-

$

35,000,000

9/1/2020

3.93

%

-

2,000,000

3/1/2021

4.37

%

10,000,000

10,000,000

3/1/2021

4.60

%

20,000,000

20,000,000

9/1/2021

3.39

%

10,000,000

10,000,000

9/1/2022

2.53

%

-

5,000,000

3/1/2023

3.16

%

16,000,000

16,000,000

3/1/2024

3.95

%

39,000,000

39,000,000

3/1/2024

3.55

%

24,800,000

24,800,000

3/1/2027

3.52

%

40,400,000

40,400,000

9/1/2027

3.19

%

34,600,000

34,600,000

3/1/2028

3.41

%

43,000,000

43,000,000

9/1/2028

3.55

%

32,000,000

32,000,000

3/1/2030

2.35

%

15,000,000

-

9/1/2030

1.13

%

10,000,000

-

9/1/2030

1.31

%

10,000,000

-

3/1/2031

(1)

0.81

%

5,000,000

-

Ending Balance

$

309,800,000

$

311,800,000


(1)The interest rate for this tranche of SBIC debentures represents an initial rate that has not been fixed by the SBA as of December 31, 2020. In March 2021, the rate for this tranche of SBIC debentures will be determined and, thereafter, the rate will be fixed for the ensuing 10 years.

Credit Facility

Main Street maintains the Credit Facility to provide additional liquidity to support its investment and operational activities. The Credit Facility includes total commitments of $780.0 million from a diversified group of 19 lenders. The Credit Facility matures in September 2023 and contains an accordion feature which allows Main Street to increase the total commitments under the facility to up to $800.0 million from new and existing lenders on the same terms and conditions as the existing commitments.

Borrowings under the Credit Facility bear interest, subject to Main Street’s election and resetting on a monthly basis on the first of each month, on a per annum basis at a rate equal to the applicable LIBOR rate (0.2% as of the most recent reset date for the period ended December 31, 2020) plus (i) 1.875% (or the applicable base rate (Prime Rate of 3.25% as of December 31, 2020) plus 0.875%) as long as Main Street meets certain agreed upon excess collateral and maximum leverage requirements or (ii) 2.0% (or the applicable base rate plus 1.0%) otherwise. Main Street pays unused

153


Table of Contents

commitment fees of 0.25% per annum on the unused lender commitments under the Credit Facility. The Credit Facility is secured by a first lien on the assets of MSCC and its subsidiaries, excluding the equity ownership or assets of the Funds and the External Investment Manager. The Credit Facility contains certain affirmative and negative covenants, including but not limited to: (i) maintaining a minimum availability of at least 10% of the borrowing base, (ii) maintaining an interest coverage ratio of at least 2.0 to 1.0, (iii) maintaining an asset coverage ratio (tangible net worth to Credit Facility borrowings) of at least 1.5 to 1.0 and (iv) maintaining a minimum tangible net worth. The Credit Facility is provided on a revolving basis through its final maturity date in September 2023, and contains two, one-year extension options which could extend the final maturity by up to two years, subject to certain conditions, including lender approval.

As of December 31, 2020, the interest rate on the Credit Facility was 2.0%. The average interest rate for borrowings under the Credit Facility was 2.5% and 4.1% for the year ended December 31, 2020 and 2019, respectively. As of December 31, 2020, Main Street was in compliance with all financial covenants of the Credit Facility.

6.125% Notes

In April 2013, Main Street issued $92.0 million, including the underwriters’ full exercise of their option to purchase additional principal amounts to cover over-allotments, in aggregate principal amount of 6.125% Notes due 2023 (the “6.125% Notes”). The 6.125% Notes bore interest at a rate of 6.125% per year payable quarterly on January 1, April 1, July 1 and October 1 of each year. On April 2, 2018, Main Street redeemed the entire principal amount of the issued and outstanding 6.125% Notes, effective April 1, 2018 (the “Redemption Date”), at par value plus the accrued and unpaid interest thereon from January 1, 2018 through, but excluding, the Redemption Date. As part of the redemption, Main Street recognized a realized loss on extinguishment of debt of $1.5 million in the second quarter of 2018 related to the write-off of the related unamortized deferred financing costs.

4.50% Notes due 2019

In November 2014, Main Street issued $175.0 million in aggregate principal amount of 4.50% unsecured notes due 2019 (the “4.50% Notes due 2019”) at an issue price of 99.53%. The 4.50% Notes due 2019 bore interest at a rate of 4.50% per year payable semiannually on June 1 and December 1 of each year. On December 2, 2019, Main Street repaid the entire principal amount of the issued and outstanding 4.50% Notes due 2019, effective December 1, 2019 (the “Maturity Date”), at par value plus the accrued and unpaid interest thereon from June 1, 2019 through the Maturity Date.

4.50% Notes due 2022

In November 2017, Main Street issued $185.0 million in aggregate principal amount of 4.50% unsecured notes due December 1, 2022 (the “4.50% Notes”) at an issue price of 99.16%. The 4.50% Notes are unsecured obligations and rank pari passu with Main Street’s current and future unsecured indebtedness; senior to any of its future indebtedness that expressly provides it is subordinated to the 4.50% Notes; effectively subordinated to all of its existing and future secured indebtedness, to the extent of the value of the assets securing such indebtedness, including borrowings under its Credit Facility; and structurally subordinated to all existing and future indebtedness and other obligations of any of its subsidiaries, including without limitation, the indebtedness of the Funds. The 4.50% Notes may be redeemed in whole or in part at any time at Main Street’s option subject to certain make-whole provisions. The 4.50% Notes bear interest at a rate of 4.50% per year payable semiannually on June 1 and December 1 of each year. The total net proceeds from the 4.50% Notes, resulting from the issue price and after underwriting discounts and estimated offering expenses payable, were approximately $182.2 million. Main Street may from time to time repurchase the 4.50% Notes in accordance with the 1940 Act and the rules promulgated thereunder.

The indenture governing the 4.50% Notes (the “4.50% Notes Indenture”) contains certain covenants, including covenants requiring Main Street’s compliance with (regardless of whether Main Street is subject to) the asset coverage requirements set forth in Section 18(a)(1)(A) as modified by Section 61(a)(1) of the 1940 Act, as well as covenants requiring Main Street to provide financial information to the holders of the 4.50% Notes and the Trustee if Main Street ceases to be subject to the reporting requirements of the Exchange Act. These covenants are subject to limitations and

154


Table of Contents

exceptions that are described in the 4.50% Notes Indenture. As of December 31, 2020, Main Street was in compliance with these covenants.

5.20% Notes

In April 2019, Main Street issued $250.0 million in aggregate principal amount of 5.20% unsecured notes due May 1, 2024 (the “5.20% Notes”) at an issue price of 99.125%. In December 2019, Main Street issued an additional $75.0 million in aggregate principal amount of the 5.20% Notes at an issue price of 105.0% and, in July 2020, Main Street issued an additional $125.0 million in aggregate principal amount of the 5.20% Notes at an issue price of 102.674%. The 5.20% Notes issued in December 2019 and July 2020 have identical terms as, and are a part of a single series with, the 5.20% Notes issued in April 2019. The 5.20% Notes are unsecured obligations and rank pari passu with Main Street’s current and future unsecured indebtedness; senior to any of its future indebtedness that expressly provides it is subordinated to the 5.20% Notes; effectively subordinated to all of its existing and future secured indebtedness, to the extent of the value of the assets securing such indebtedness, including borrowings under its Credit Facility; and structurally subordinated to all existing and future indebtedness and other obligations of any of its subsidiaries, including without limitation, the indebtedness of the Funds. The 5.20% Notes may be redeemed in whole or in part at any time at Main Street’s option subject to certain make-whole provisions. The 5.20% Notes bear interest at a rate of 5.20% per year payable semiannually on May 1 and November 1 of each year. The total net proceeds from the 5.20% Notes, resulting from the issue price and after underwriting discounts and estimated offering expenses payable, were approximately $451.4 million. Main Street may from time to time repurchase the 5.20% Notes in accordance with the 1940 Act and the rules promulgated thereunder.

The indenture governing the 5.20% Notes (the “5.20% Notes Indenture”) contains certain covenants, including covenants requiring Main Street’s compliance with (regardless of whether Main Street is subject to) the asset coverage requirements set forth in Section 18(a)(1)(A) as modified by Section 61(a)(1) of the 1940 Act, as well as covenants requiring Main Street to provide financial information to the holders of the 5.20% Notes and the Trustee if Main Street ceases to be subject to the reporting requirements of the Exchange Act. These covenants are subject to limitations and exceptions that are described in the 5.20% Notes Indenture. As of December 31, 2020, Main Street was in compliance with these covenants.

Contractual Payment Obligations

A summary of Main Street’s contractual payment obligations for the repayment of outstanding indebtedness at December 31, 2020 is as follows:


2021


2022


2023


2024


2025


Thereafter


Total

SBIC debentures

$

40,000

$

$

16,000

$

63,800

$

$

190,000

$

309,800

4.50% Notes due 2022

185,000

185,000

5.20% Notes due 2024

450,000

450,000

Credit Facility

269,000

269,000

Total

$

40,000

$

185,000

$

285,000

$

513,800

$

$

190,000

$

1,213,800


155


Table of Contents

Senior Securities

Information about Main Street’s senior securities is shown in the following table as of December 31 for the years indicated in the table, unless otherwise noted.


Total Amount


Outstanding

Involuntary

Exclusive of

Asset

Liquidating

Average

Treasury

Coverage

Preference

Market Value

Class and Year

Securities(1)

per Unit(2)

per Unit(3)

per Unit(4)

(dollars in

thousands)

SBIC Debentures

2011

$

220,000


2,202


N/A

2012


225,000


2,763


N/A

2013


200,200


2,476


N/A

2014


225,000


2,323


N/A

2015


225,000


2,368


N/A

2016


240,000


2,415


N/A

2017


295,800


2,687


N/A

2018


345,800


2,455


N/A

2019


311,800


2,363


N/A

2020


309,800

2,244

N/A

Credit Facility


2011

$

107,000


2,202


N/A

2012


132,000


2,763


N/A

2013


237,000


2,476


N/A

2014


218,000


2,323


N/A

2015


291,000


2,368


N/A

2016


343,000


2,415


N/A

2017


64,000


2,687


N/A

2018


301,000


2,455


N/A

2019


300,000


2,363


N/A

2020


269,000

2,244

N/A

6.125% Notes


2014

$

90,823


2,323


$

24.78

2015


90,738


2,368


25.40

2016


90,655


2,415


25.76

2017


90,655


2,687


25.93

4.50% Notes Due 2019


2015

$

175,000


2,368


N/A

2016


175,000


2,415


N/A

2017


175,000


2,687


N/A

2018


175,000


2,455


N/A

4.50% Notes Due 2022

2017

$

185,000

2,687

N/A

2018

185,000


2,455


N/A

2019


185,000


2,363


N/A

2020


185,000

2,244

N/A

5.20% Notes Due 2024


2019

$

325,000

2,363

N/A

2020

450,000

2,244

N/A


(1)

Total amount of each class of senior securities outstanding at the end of the period presented.

156


Table of Contents

(2)

Asset coverage per unit is the ratio of the carrying value of Main Street’s total consolidated assets, less all liabilities and indebtedness not represented by senior securities, to the aggregate amount of senior securities representing indebtedness. Asset coverage per unit is expressed in terms of dollar amounts per $1,000 of indebtedness.

(3)

The amount to which such class of senior security would be entitled upon the involuntary liquidation of the issuer in preference to any security junior to it. The “—” indicates information that the SEC expressly does not require to be disclosed for certain types of senior securities.

(4)

Average market value per unit for the 6.125% Notes represents the average of the daily closing prices as reported on the NYSE during the period presented. Average market value per unit for the SBIC debentures, Credit Facility, 4.50% Notes due 2019, 4.50% Notes and 5.20% Notes are not applicable because these are not registered for public trading.

NOTE F—FINANCIAL HIGHLIGHTS


Twelve Months Ended December 31, 

Per Share Data:


2020


2019


2018


2017


2016

NAV at the beginning of the period

$

23.91

$

24.09

$

23.53

$

22.10

$

21.24

Net investment income(1)


2.10


2.50


2.60


2.39


2.23

Net realized loss(1)(2)


(1.77)


(0.33)


(0.03)


0.19


0.56

Net unrealized appreciation (depreciation)(1)(2)


(0.09)


(0.09)


0.32


0.86


(0.14)

Income tax benefit (provision)(1)(2)


0.21


(0.02)


(0.09)


(0.43)


0.02

Net increase (decrease) in net assets resulting from operations(1)


0.45


2.06


2.80


3.01


2.67

Dividends paid


(2.46)


(2.91)


(2.85)


(2.79)


(2.73)

Impact of the net change in monthly dividends declared prior to the end of the period and paid in the subsequent period


(0.01)


(0.01)


(0.01)


(0.01)

Accretive effect of stock offerings (issuing shares above NAV per share)


0.41


0.55


0.47


1.07


0.76

Accretive effect of DRIP issuance (issuing shares above NAV per share)

0.08

0.12


0.09


0.06


0.08

Other(3)


(0.04)


0.01


0.06


0.09


0.09

NAV at the end of the period

$

22.35

$

23.91

$

24.09

$

23.53

$

22.10

Market value at the end of the period

$

32.26

$

43.11

$

33.81

$

39.73

$

36.77

Shares outstanding at the end of the period

67,762,032

64,252,937

61,264,861

58,660,680

54,354,857


(1)Based on weighted-average number of common shares outstanding for the period.
(2)Net realized gains or losses, net unrealized appreciation or depreciation, and income taxes can fluctuate significantly from period to period.
(3)Includes the impact of the different share amounts as a result of calculating certain per share data based on the weighted-average basic shares outstanding during the period and certain per share data based on the shares outstanding as of a period end or transaction date.

157


Table of Contents

Twelve Months Ended December 31, 


2020


2019


2018


2017


2016


(dollars in thousands)


NAV at end of period

$

1,514,767

$

1,536,390

$

1,476,049

$

1,380,368

$

1,201,481

Average NAV

$

1,436,291

$

1,517,615

$

1,441,163

$

1,287,639

$

1,118,567

Average outstanding debt

$

1,152,108

$

1,055,800

$

947,694

$

843,993

$

801,048

Ratio of total expenses, including income tax expense, to average NAV (1)

4.95

%

5.75

%

5.75

%

7.37

%

5.48

%

Ratio of operating expenses to average NAV (2)

5.89

%

5.67

%

5.32

%

5.47

%

5.59

%

Ratio of operating expenses, excluding interest expense, to average NAV (2)

2.44

%

2.36

%

2.30

%

2.63

%

2.58

%

Ratio of net investment income to average NAV

9.60

%

10.37

%

10.87

%

10.51

%

10.35

%

Portfolio turnover ratio

18.00

%

18.86

%

29.13

%

38.18

%

24.63

%

Total investment return (3)

(19.11)

%

36.86

%

(8.25)

%

16.02

%

37.36

%

Total return based on change in NAV (4)

1.91

%

8.78

%

12.19

%

14.20

%

12.97

%


(1)Total expenses are the sum of operating expenses and net income tax provision/benefit. Net income tax provision/benefit includes the accrual of net deferred tax provision/benefit relating to the net unrealized appreciation/depreciation on portfolio investments held in Taxable Subsidiaries and due to the change in the loss carryforwards, which are non-cash in nature and may vary significantly from period to period. Main Street is required to include net deferred tax provision/benefit in calculating its total expenses even though these net deferred taxes are not currently payable/receivable.
(2)Unless otherwise noted, operating expenses include interest, compensation, general and administrative and share-based compensation expenses, net of expenses allocated to the External Investment Manager.
(3)Total investment return is based on the purchase of stock at the current market price on the first day and a sale at the current market price on the last day of each period reported on the table and assumes reinvestment of dividends at prices obtained by Main Street’s dividend reinvestment plan during the period. The return does not reflect any sales load that may be paid by an investor.
(4)Total return is based on change in net asset value was calculated using the sum of ending net asset value plus dividends to stockholders and other non-operating changes during the period, as divided by the beginning net asset value. Non-operating changes include any items that affect net asset value other than the net increase in net assets resulting from operations, such as the effects of stock offerings, shares issued under the DRIP and equity incentive plans and other miscellaneous items.

NOTE G—DIVIDENDS, DISTRIBUTIONS AND TAXABLE INCOME

Main Street currently pays monthly dividends to its stockholders. Its monthly dividends, if any, will be determined by its Board of Directors on a quarterly basis. During 2020, Main Street paid monthly dividends of $0.205 per share for each month of January through December 2020. The 2020 monthly dividends, which total $161.1 million, or $2.460 per share, represent a 1.9% increase from the monthly dividends paid per share for the year ended 2019. During 2019, Main Street also paid supplemental dividends of $0.250 per share in June 2019 and $0.240 per share in December 2019.

For tax purposes, the 2020 dividends, which included the effects of dividends on an accrual basis, total $2.255 per share and were comprised of (i) ordinary income totaling approximately $2.061 per share, and (ii) qualified dividend income totaling approximately $0.194 per share. As of December 31, 2020, Main Street estimates that it has generated undistributed taxable income of approximately $38.2 million, or $0.56 per share, that will be carried forward toward distributions to be paid in 2021.

MSCC has elected to be treated for U.S. federal income tax purposes as a RIC. MSCC’s taxable income includes the taxable income generated by MSCC and certain of its subsidiaries, including the Funds, which are treated as disregarded entities for tax purposes. As a RIC, MSCC generally will not pay corporate-level U.S. federal income taxes on any net ordinary taxable income or capital gains that MSCC distributes to its stockholders. MSCC must generally

158


Table of Contents

distribute at least 90% of its “investment company taxable income” (which is generally its net ordinary taxable income and realized net short-term capital gains in excess of realized net long-term capital losses) and 90% of its tax-exempt income to maintain its RIC status (pass-through tax treatment for amounts distributed). As part of maintaining RIC status, undistributed taxable income (subject to a 4% non-deductible U.S. federal excise tax) pertaining to a given fiscal year may be distributed up to 12 months subsequent to the end of that fiscal year, provided such dividends are declared on or prior to the later of (i) filing of the U.S. federal income tax return for the applicable fiscal year or (ii) the fifteenth day of the ninth month following the close of the year in which such taxable income was generated.

The determination of the tax attributes for Main Street’s distributions is made annually, based upon its taxable income for the full year and distributions paid for the full year. Therefore, a determination made on an interim basis may not be representative of the actual tax attributes of distributions for a full year. Ordinary dividend distributions from a RIC do not qualify for the 20% maximum tax rate (plus a 3.8% Medicare surtax, if applicable) on dividend income from domestic corporations and qualified foreign corporations, except to the extent that the RIC received the income in the form of qualifying dividends from domestic corporations and qualified foreign corporations. The tax attributes for distributions will generally include both ordinary income and qualified dividends, but may also include either one or both of capital gains and return of capital. The tax character of distributions paid for the years ended December 31, 2020, 2019 and 2018 was as follows:

Twelve Months Ended December 31, 

2020

2019

2018

(dollars in thousands)

Ordinary income(1)

$

135,128

$

166,280

$

136,934

Qualified dividends

12,398

15,451

12,277

Distributions of long term capital gains

1,858

22,513

Distributions on tax basis

$

147,526

$

183,589

$

171,724


(1)The years ended December 31, 2020, 2019 and 2018 include $1.5 million, $1.6 million and $1.4 million, respectively, that was reported for tax purposes as compensation for services in accordance with Section 83 of the Code.

Listed below is a reconciliation of “Net increase (decrease) in net assets resulting from operations” to taxable income and to total distributions declared to common stockholders for the years ended December 31, 2020, 2019 and 2018.

Year ended December 31, 


2020


2019


2018

(estimated, dollars in thousands)

Net increase (decrease) in net assets resulting from operations

$

29,383

$

129,569

$

168,213

Book‑tax difference from share‑based compensation expense


5,139


(354)


(1,430)

Net unrealized (appreciation) depreciation


5,622


5,754


(19,275)

Income tax provision (benefit)


(13,541)


1,242


6,152

Pre-tax book (income) loss not consolidated for tax purposes


37,420


(30,690)


(454)

Book income and tax income differences, including debt origination, structuring fees, dividends, realized gains and changes in estimates


93,025


65,686


17,649

Estimated taxable income(1)


157,048


171,207


170,855

Taxable income earned in prior year and carried forward for distribution in current year


29,107


41,489


42,357

Taxable income earned prior to period end and carried forward for distribution next period


(38,248)


(42,281)


(53,436)

Dividend payable as of period end and paid in the following period


13,889


13,174


11,948

Total distributions accrued or paid to common stockholders

$

161,796

$

183,589

$

171,724


(1)Main Street’s taxable income for each period is an estimate and will not be finally determined until the company files its tax return for each year. Therefore, the final taxable income, and the taxable income earned in each period and carried forward for distribution in the following period, may be different than this estimate.

159


Table of Contents

The Taxable Subsidiaries primarily hold certain portfolio investments for Main Street. The Taxable Subsidiaries permit Main Street to hold equity investments in portfolio companies which are “pass-through” entities for tax purposes and to continue to comply with the “source-of-income” requirements contained in the RIC tax provisions of the Code. The Taxable Subsidiaries are consolidated with Main Street for U.S. GAAP financial reporting purposes, and the portfolio investments held by the Taxable Subsidiaries are included in Main Street’s consolidated financial statements as portfolio investments and recorded at fair value. The Taxable Subsidiaries are not consolidated with MSCC for income tax purposes and may generate income tax expense, or benefit, and tax assets and liabilities, as a result of their ownership of certain portfolio investments. The taxable income, or loss, of the Taxable Subsidiaries may differ from their book income, or loss, due to temporary book and tax timing differences and permanent differences. The Taxable Subsidiaries are each taxed at their normal corporate tax rates based on their taxable income. The income tax expense, or benefit, if any, and the related tax assets and liabilities, of the Taxable Subsidiaries are reflected in Main Street’s consolidated financial statements.

The income tax expense (benefit) for Main Street is generally composed of (i) deferred tax expense (benefit), which is primarily the result of the net activity relating to the portfolio investments held in the Taxable Subsidiaries, including changes in loss carryforwards, changes in net unrealized appreciation or depreciation and other temporary book tax differences, and (ii) current tax expense, which is primarily the result of current U.S. federal income and state taxes and excise taxes on Main Street’s estimated undistributed taxable income. The income tax expense, or benefit, and the related tax assets and liabilities generated by the Taxable Subsidiaries, if any, are reflected in Main Street’s consolidated statement of operations. Main Street’s provision for income taxes was comprised of the following for the years ended December 31, 2020, 2019 and 2018 (amounts in thousands):

Twelve Months Ended

December 31, 

2020

2019

2018

Current tax expense (benefit):

Federal

$

497

$

1,019

$

(2,398)

State

(1,554)

1,408

1,688

Excise

1,647

1,119

1,029

Total current tax expense (benefit)

590

3,546

319

Deferred tax expense (benefit):

Federal

(13,082)

(1,267)

3,763

State

(1,049)

(1,037)

2,070

Total deferred tax expense (benefit)

(14,131)

(2,304)

5,833

Total income tax provision (benefit)

$

(13,541)

$

1,242

$

6,152

MSCC operates in a manner to maintain its RIC status and to eliminate corporate-level U.S. federal income tax (other than the 4% excise tax) by distributing sufficient investment company taxable income and long-term capital gains. As a result, MSCC will have an effective tax rate equal to 0% before the excise tax and income taxes incurred by the Taxable Subsidiaries. As such, a reconciliation of the differences between Main Street’s reported income tax expense and its tax expense at the federal statutory rate of 21% is not meaningful.

As of December 31, 2020, the cost of investments for U.S. federal income tax purposes was $2,352.9 million, with such investments having a gross unrealized appreciation of $544.8 million and gross unrealized depreciation of $212.8 million.

Management believes that the realization of the deferred tax assets is more likely than not based on expectations as to future taxable income and scheduled reversals of temporary differences. Accordingly, Main Street did not record a valuation allowance related to its deferred tax assets at December 31, 2020 and 2019. The following table sets forth the

160


Table of Contents

significant components of net deferred tax assets and liabilities as of December 31, 2020 and 2019 (amounts in thousands):

Years Ended 

December 31, 

2020

2019

Deferred tax assets:


Net operating loss carryforwards

$

41,691

$

32,778

Interest Expense Carryforwards

9,779

10,079

Capital loss carryforwards

929

Other

2,315

2,041

Total deferred tax assets

54,714

44,898

Deferred tax liabilities:


Net unrealized appreciation of portfolio investments

(28,351)

(31,851)

Net basis differences in portfolio investments

(28,955)

(29,196)

Total deferred tax liabilities

(57,306)

(61,047)

Total deferred tax asset (liabilities), net

$

(2,592)

$

(16,149)

The net deferred tax liability at December, 31, 2020 was $2.6 million compared to $16.1 million at December 31, 2019, primarily related to changes in net unrealized appreciation or depreciation, changes in loss carryforwards, and other temporary book-tax differences relating to portfolio investments held by the Taxable Subsidiaries. At December 31, 2020, for U.S. federal income tax purposes, the Taxable Subsidiaries had a net operating loss carryforward from prior years which, if unused, will expire in various taxable years from 2028 through 2037. Any net operating losses generated in 2019 and future periods are not subject to expiration and will carryforward indefinitely until utilized. The timing and manner in which Main Street will utilize any loss carryforwards generated before December 31, 2019 may be limited in the future under the provisions of the Code. At December 31, 2020, for U.S. federal income tax purposes, the Taxable Subsidiaries had a net capital loss carryforward totaling approximately $4.2 million which, if unused, will expire in five years. Additionally, the Taxable Subsidiaries have interest expense limitation carryforwards which have an indefinite carryforward. In addition, for the year ended December 31, 2020, for U.S. federal income tax purposes at the RIC level, MSCC had net capital loss carryforwards totaling approximately $103.0 million available to offset future capital gains, to the extent available and permitted by U.S. federal income tax law. However, as long as MSCC maintains its RIC status, any capital loss carryforwards at the RIC are not subject to a federal income tax-effect and are not subject to an expiration date.

NOTE H—COMMON STOCK

Main Street maintains a program with certain selling agents through which it can sell shares of its common stock by means of at-the-market offerings from time to time (the “ATM Program”).

During the year ended December 31, 2020, Main Street sold 2,645,778 shares of its common stock at a weighted-average price of $32.10 per share and raised $84.9 million of gross proceeds under the ATM Program. Net proceeds were $83.8 million after commissions to the selling agents on shares sold and offering costs. As of December 31, 2020, sales transactions representing 87,179 shares had not settled and are not included in shares issued and outstanding on the face of the consolidated balance sheet, but are included in the weighted-average shares outstanding in the consolidated statement of operations and in the shares used to calculate net asset value per share. As of December 31, 2020, 5,713,372 shares remained available for sale under the ATM Program.

During the year ended December 31, 2019, Main Street sold 2,247,187 shares of its common stock at a weighted-average price of $40.05 per share and raised $90.0 million of gross proceeds under the ATM Program. Net proceeds were $88.8 million after commissions to the selling agents on shares sold and offering costs.

During the year ended December 31, 2018, Main Street sold 2,060,019 shares of its common stock at a weighted-average price of $38.48 per share and raised $79.3 million of gross proceeds under the ATM Program. Net proceeds were $78.0 million after commissions to the selling agents on shares sold and offering costs.

161


Table of Contents

NOTE I—DIVIDEND REINVESTMENT PLAN

The dividend reinvestment feature of Main Street’s dividend reinvestment and direct stock purchase plan (the “DRIP”) provides for the reinvestment of dividends on behalf of its stockholders, unless a stockholder has elected to receive dividends in cash. As a result, if Main Street declares a cash dividend, its stockholders who have not “opted out” of the DRIP by the dividend record date will have their cash dividend automatically reinvested into additional shares of MSCC common stock. The share requirements of the DRIP may be satisfied through the issuance of shares of common stock or through open market purchases of common stock by the DRIP plan administrator. Newly issued shares will be valued based upon the final closing price of MSCC’s common stock on the valuation date determined for each dividend by Main Street’s Board of Directors. Shares purchased in the open market to satisfy the DRIP requirements will be valued based upon the average price of the applicable shares purchased, before any associated brokerage or other costs. Main Street’s DRIP is administered by its transfer agent on behalf of Main Street’s record holders and participating brokerage firms. Brokerage firms and other financial intermediaries may decide not to participate in Main Street’s DRIP but may provide a similar dividend reinvestment plan for their clients.

Summarized DRIP information for the years ended December 31, 2020, 2019 and 2018 is as follows:

Years Ended

December 31, 

2020

2019

2018

($ in millions)

Total dividends paid

$

161.1

$

182.8

$

170.9

DRIP participation

$

16.2

$

18.1

$

14.9

Shares issued for DRIP

517,796

441,927

394,403

NOTE J—SHARE-BASED COMPENSATION

Main Street accounts for its share-based compensation plans using the fair value method, as prescribed by ASC 718, Compensation—Stock Compensation. Accordingly, for restricted stock awards, Main Street measured the grant date fair value based upon the market price of its common stock on the date of the grant and amortizes the fair value of the awards as share-based compensation expense over the requisite service period, which is generally the vesting term.

Main Street’s Board of Directors approves the issuance of shares of restricted stock to Main Street employees pursuant to the Main Street Capital Corporation 2015 Equity and Incentive Plan (the “Equity and Incentive Plan”). These shares generally vest over a three-year period from the grant date. The fair value is expensed over the service period, starting on the grant date. The following table summarizes the restricted stock issuances approved by Main Street’s Board of Directors under the Equity and Incentive Plan, net of shares forfeited, if any, and the remaining shares of restricted stock available for issuance as of December 31, 2020.

Restricted stock authorized under the plan


3,000,000

Less net restricted stock granted during:


Year ended December 31, 2015


(900)

Year ended December 31, 2016


(260,514)

Year ended December 31, 2017


(223,812)

Year ended December 31, 2018


(243,779)

Year ended December 31, 2019


(384,049)

Year ended December 31, 2020

(370,272)

Restricted stock available for issuance as of December 31, 2020


1,516,674

As of December 31, 2020, the following table summarizes the restricted stock issued to Main Street’s non-employee directors and the remaining shares of restricted stock available for issuance pursuant to the Main Street Capital Corporation 2015 Non-Employee Director Restricted Stock Plan. These shares are granted upon appointment or

162


Table of Contents

election to the board and vest on the day immediately preceding the annual meeting of stockholders following the respective grant date and are expensed over such service period.

Restricted stock authorized under the plan


300,000

Less net restricted stock granted during:


Year ended December 31, 2015


(6,806)

Year ended December 31, 2016


(6,748)

Year ended December 31, 2017


(5,948)

Year ended December 31, 2018


(6,376)

Year ended December 31, 2019


(6,008)

Year ended December 31, 2020

(11,463)

Restricted stock available for issuance as of December 31, 2020


256,651

For the years ended December 31, 2020, 2019 and 2018, Main Street recognized total share-based compensation expense of $10.8 million, $10.1 million and $9.2 million, respectively, related to the restricted stock issued to Main Street employees and non-employee directors.

As of December 31, 2020, there was $12.2 million of total unrecognized compensation expense related to Main Street’s non-vested restricted shares. This compensation expense is expected to be recognized over a remaining weighted-average period of approximately 1.8 years as of December 31, 2020.

NOTE K—COMMITMENTS AND CONTINGENCIES

At December 31, 2020, Main Street had the following outstanding commitments (in thousands):

Investments with equity capital commitments that have not yet funded:


Amount


Congruent Credit Opportunities Funds


Congruent Credit Opportunities Fund II, LP

$

8,488

Congruent Credit Opportunities Fund III, LP


8,117

$

16,605


Encap Energy Fund Investments

EnCap Energy Capital Fund IX, L.P.

$

251

EnCap Energy Capital Fund X, L.P.


1,325

EnCap Flatrock Midstream Fund II, L.P.


4,592

EnCap Flatrock Midstream Fund III, L.P.

402

$

6,570

EIG Fund Investments

$

3,735

Brightwood Capital Fund Investments

Brightwood Capital Fund III, LP

$

3,000

Freeport Fund Investments

Freeport Financial SBIC Fund LP

1,375

Freeport First Lien Loan Fund III LP

1,715

$

3,090

LKCM Headwater Investments I, L.P.

$

2,500

UnionRock Energy Fund Investments

UnionRock Energy Fund II, LP

$

2,248

Harris Preston Fund Investments

163


Table of Contents


Amount

HPEP 3, L.P.

$

1,929

Dos Rios Partners

Dos Rios Partners, LP

$

835

Dos Rios Partners - A, LP

265

$

1,100

MS Private Loan Fund I, LP

$

214

Total equity commitments

$

40,991

Investments with commitments to fund revolving loans that have not been fully drawn or term loans with additional commitments not yet funded:

Eastern Wholesale Fence LLC

$

8,143

SI East, LLC

7,500

Adams Publishing Group, LLC

5,000

Bolder Panther Group, LLC

5,000

Classic H&G Holdco, LLC

4,000

Electronic Transaction Consultants, LLC

3,704

GS HVAM Intermediate, LLC

3,636

Market Force Information, LLC

3,400

Ian, Evan & Alexander Corporation (EverWatch)

3,333

Hunter Defense Technologies, Inc.

3,230

NinjaTrader, LLC

3,078

Arcus Hunting LLC

2,892

RTIC Subsidiary Holdings, LLC

2,740

Echo US Holdings, LLC.

2,586

Superior Rigging & Erecting Co.

2,500

Klein Hersh, LLC

2,500

Nebraska Vet AcquireCo, LLC

2,500

Pearl Meyer Topco LLC

2,488

Fortna, Inc.

2,027

PPL RVs, Inc.

2,000

Hawk Ridge Systems, LLC

2,000

Lynx FBO Operating LLC

1,875

Cody Pools, Inc.

1,600

Chamberlin Holding LLC

1,600

Direct Marketing Solutions, Inc.

1,600

Trantech Radiator Topco, LLC

1,600

GRT Rubber Technologies LLC

1,340

Project Eagle Holdings, LLC

1,250

Gamber-Johnson Holdings, LLC

1,200

Tedder Industries, LLC

1,200

Project BarFly, LLC

1,127

CompareNetworks Topco, LLC

1,000

NRI Clinical Research, LLC

1,000

Invincible Boat Company, LLC.

864

Mystic Logistics Holdings, LLC

800

DTE Enterprises RLOC

750

PT Network, LLC

658

ASC Interests, LLC

600

Jensen Jewelers of Idaho, LLC

500

Coastal Television Broadcasting Holdings LLC

500

Clickbooth.com, LLC

457

American Nuts, LLC

281

Dynamic Communities, LLC

250

Total loan commitments

$

96,309

Total commitments

$

137,300

164


Table of Contents

Main Street will fund its unfunded commitments from the same sources it uses to fund its investment commitments that are funded at the time they are made (which are typically through existing cash and cash equivalents and borrowings under the Credit Facility). Main Street follows a process to manage its liquidity and ensure that it has available capital to fund its unfunded commitments as necessary. The Company had total unrealized depreciation of $0.1 million on the outstanding unfunded commitments as of December 31, 2020.

Effective January 1, 2019, ASC 842 required that a lessee evaluate its leases to determine whether they should be classified as operating or financing leases. Main Street identified one operating lease for its office space. The lease commenced May 15, 2017 and expires January 31, 2028. It contains two five-year extension options for a final expiration date of January 31, 2038.

As Main Street classified this lease as an operating lease prior to implementation, ASC 842-10-65-1 indicates that a right-of-use asset and lease liability should be recorded based on the effective date. Main Street adopted ASC 842 effective January 1, 2019 and recorded a right-of-use asset and a lease liability as of that date. After this date, Main Street has recorded lease expense on a straight-line basis, consistent with the accounting treatment for lease expense prior to the adoption of ASC 842.

Total operating lease cost incurred by Main Street for each of the years ended December 31, 2020 and 2019 and 2018 was $0.7 million. As of December 31, 2020, the asset related to the operating lease was $4.3 million and is included in the interest receivable and other assets balance on the consolidated balance sheet. The lease liability was $5.0 million and is included in the accounts payable and other liabilities balance on the consolidated balance sheet. As of December 31, 2020, the remaining lease term was 7.1 years and the discount rate was 4.2%.

The following table shows future minimum payments under Main Street’s operating lease as of December 31, 2020 (in thousands):

For the Years Ended December 31,

Amount

2021

$

776

2022

790

2023

804

2024

818

2025

832

Thereafter

1,779

Total

$

5,799

Main Street may, from time to time, be involved in litigation arising out of its operations in the normal course of business or otherwise. Furthermore, third parties may try to impose liability on Main Street in connection with the activities of its portfolio companies. While the outcome of any current legal proceedings cannot at this time be predicted with certainty, Main Street does not expect any current matters will materially affect its financial condition or results of operations; however, there can be no assurance whether any pending legal proceedings will have a material adverse effect on Main Street’s financial condition or results of operations in any future reporting period.

NOTE L – SELECTED QUARTERLY DATA (UNAUDITED)


2020

(dollars in thousands, 

except per share amounts)

Qtr. 1

Qtr. 2

Qtr. 3

Qtr. 4

Total investment income

$

56,150

$

52,007

$

51,954

$

62,503

Net investment income

$

36,545

$

31,294

$

30,462

$

39,644

Net increase in net assets resulting from operations

$

(171,438)

$

43,369

$

78,195

$

79,257

Net investment income per share — basic and diluted

$

0.57

$

0.48

$

0.46

$

0.59

Net increase in net assets resulting from operations per share — basic and diluted

$

(2.66)

$

0.66

$

1.18

$

1.19

165


Table of Contents


2019

(dollars in thousands,

except per share amounts)


Qtr. 1


Qtr. 2


Qtr. 3


Qtr. 4

Total investment income

$

61,365

$

61,293

$

60,068

$

60,649

Net investment income

$

39,491

$

39,617

$

39,012

$

39,247

Net increase in net assets resulting from operations

$

41,401

$

38,254

$

33,902

$

16,014

Net investment income per share — basic and diluted

$

0.64

$

0.63

$

0.62

$

0.62

Net increase in net assets resulting from operations per share — basic and diluted

$

0.67

$

0.61

$

0.54

$

0.25


2018

(dollars in thousands,

 except per share amounts)


Qtr. 1


Qtr. 2


Qtr. 3


Qtr. 4

Total investment income

$

55,942

$

59,869

$

58,263

$

59,280

Net investment income

$

36,975

$

39,512

$

38,075

$

42,083

Net increase in net assets resulting from operations

$

34,517

$

55,451

$

68,740

$

9,505

Net investment income per share — basic and diluted

$

0.63

$

0.66

$

0.63

$

0.69

Net increase in net assets resulting from operations per share — basic and diluted

$

0.59

$

0.93

$

1.13

$

0.16

NOTE M—RELATED PARTY TRANSACTIONS

As discussed further in Note D, the External Investment Manager is treated as a wholly owned portfolio company of MSCC and is included as part of Main Street’s Investment Portfolio. At December 31, 2020, Main Street had a receivable of approximately $3.5 million due from the External Investment Manager, which included (i) approximately $2.4 million related primarily to operating expenses incurred by MSCC or its subsidiaries as required to support the External Investment Manager’s business and amounts due from the External Investment Manager to Main Street under a tax sharing agreement (see further discussion in Note D) and (ii) approximately $1.1 million of dividends declared but not paid by the External Investment Manager. MSCC has entered into an agreement with the External Investment Manager to share employees in connection with its asset management business generally, and specifically for the External Investment Manager’s relationship with MSC Income and its other clients (see further discussion in Note A.1 and Note D).

In November 2015, Main Street’s Board of Directors approved and adopted the Main Street Capital Corporation Deferred Compensation Plan (the “2015 Deferred Compensation Plan”). The 2015 Deferred Compensation Plan became effective on January 1, 2016 and replaced the Deferred Compensation Plan for Non-Employee Directors previously adopted by the Board of Directors in June 2013 (the “2013 Deferred Compensation Plan”). Under the 2015 Deferred Compensation Plan, non-employee directors and certain key employees may defer receipt of some or all of their cash compensation and directors’ fees, subject to certain limitations. Individuals participating in the 2015 Deferred Compensation Plan receive distributions of their respective balances based on predetermined payout schedules or other events as defined by the plan and are also able to direct investments made on their behalf among investment alternatives permitted from time to time under the plan, including phantom Main Street stock units. As of December 31, 2020, $11.9 million of compensation and dividend reinvestments net of unrealized gains and losses and distributions had been deferred under the 2015 Deferred Compensation Plan (including amounts previously deferred under the 2013 Deferred Compensation Plan).  Of this amount, $5.2 million had been deferred into phantom Main Street stock units, representing 160,352 shares of Main Street’s common stock. Any amounts deferred under the plan represented by phantom Main Street stock units will not be issued or included as outstanding on the consolidated statements of changes in net assets until such shares are actually distributed to the participant in accordance with the plan, but the related phantom stock units are included in weighted-average shares outstanding with the related dollar amount of the deferral included in total expenses in Main Street’s consolidated statements of operations as earned. The dividend amounts related to additional phantom stock units are included in the statements of changes in net assets as an increase to dividends to stockholders offset by a corresponding increase to additional paid-in capital.

In December 2020, the External Investment Manager entered into an Investment Management Agreement with MS Private Loan Fund I, LP, a private investment fund with a strategy to invest in Private Loan portfolio investments (the “Private Loan Fund”), pursuant to which the External Investment Manager provides investment advisory and

166


Table of Contents

management services to the Private Loan Fund in exchange for an asset-based fee and certain incentive fees. The Private Loan Fund is a private investment fund exempt from registration under the 1940 Act that invests in debt investments in middle market companies generally with EBITDA between $7.5 million and $50 million and generally owned by a private equity sponsor, which Main Street generally refers to as “Private Loan” investments. In connection with the Private Loan Fund’s initial closing in December 2020, Main Street committed to contribute up to $10.0 million as a limited partner and will be entitled to distributions on such interest. In addition, certain of Main Street’s officers and employees (and certain of their immediate family members) have made capital commitments to the Private Loan Fund as limited partners and therefore have a direct pecuniary interests in the Private Loan Fund.

From time to time, Main Street may make investments in clients of the External Investment Manager in the form of debt capital on terms approved by our Board of Directors. In January 2021, Main Street entered into a Term Loan Agreement with MSC Income (the “Term Loan Agreement”). The Term Loan Agreement was unanimously approved by Main Street’s Board, including each director who is not an “interested person,” as such term is defined in Section 2(a)(19) of the 1940 Act and the board of directors of MSC Income, including each director who is not an “interested person” of MSC Income or the External Investment Manager. The Term Loan Agreement provides for a term loan of $40.0 million to MSC Income, bearing interest at a fixed rate of 5.00% per annum, and matures in January 2026. Borrowings under the Term Loan Agreement are expressly subordinated and junior in right of payment to all secured indebtedness of MSC Income and are subject to a two-year no-call period that expires on January 27, 2023. Additionally, Main Street provided the Private Loan Fund with a revolving line of credit pursuant to an Unsecured Revolving Promissory Note, dated February 5, 2021 (the “Private Loan Fund Loan”), in an aggregate amount equal to the amount of limited partner capital commitments to the Private Loan Fund up to $50.0 million. Borrowings under the Private Loan Fund Loan bear interest at a fixed rate of 5.00% per annum and will mature on the earlier of June 30, 2022 and the date of the Private Loan Fund’s final closing.

NOTE N—SUBSEQUENT EVENTS

In January 2021, Main Street issued $300.0 million in aggregate principal amount of 3.00% unsecured notes due July 14, 2026 (the “3.00% Notes”) at an issue price of 99.004%. The total net proceeds from the 3.00% Notes, resulting from the issue price and after underwriting discounts and estimated offering expenses payable, were approximately $294.8 million.

During February 2021, Main Street declared monthly dividends of $0.205 per share for each month of April, May and June of 2021. These monthly dividends equal a total of $0.615 per share for the second quarter of 2021, unchanged from the monthly dividends paid in the second quarter of 2020. Including the monthly dividends declared for the second quarter of 2021, Main Street will have paid $30.830 per share in cumulative dividends since its October 2007 initial public offering.

167


Table of Contents

Report of Independent Registered Public Accounting Firm

Board of Directors and Stockholders

Main Street Capital Corporation

Opinion on financial statement schedule

We have audited in accordance with the standards of the Public Company Accounting Oversight Board (United States) (“PCAOB”) the consolidated financial statements of Main Street Capital Corporation and subsidiaries (the “Company”) referred to in our report dated February 26, 2021, which is included in the annual report on Form 10-K. Our audits of the consolidated financial statements also included the audit of the financial statement schedule (listed in the index appearing under Item 15(2)). In our opinion, this financial statement schedule, when considered in relation to the consolidated financial statements as a whole, presents fairly, in all material respects, the information set forth therein.

Basis for opinion

This financial statement schedule is the responsibility of the Company’s management. Our responsibility is to express an opinion on the Company’s financial statement schedule based on our audits. We are a public accounting firm registered with the PCAOB and are required to be independent with respect to the Company in accordance with the U.S. federal securities laws and the applicable rules and regulations of the Securities and Exchange Commission and the PCAOB.

/s/ GRANT THORNTON LLP

Houston, Texas

February 26, 2021

168


Table of Contents

Schedule 12-14

MAIN STREET CAPITAL CORPORATION

Consolidated Schedule of Investments In and Advances to Affiliates

December 31, 2020

(dollars in thousands)

Amount of

Interest,

Fees or

Amount of

Amount of

Dividends

December 31, 

December 31, 

Realized

Unrealized

Credited to

2019

Gross

Gross

2020

Company


Investment(1)(10)(11)


Geography


Gain/(Loss)


Gain/(Loss)


Income(2)


Fair Value


Additions(3)


Reductions(4)


Fair Value

Majorityowned investments


Café Brazil, LLC


Member Units


(8)

$

$

(410)

$

38

$

2,440

$

$

410

$

2,030

California Splendor Holdings LLC


LIBOR Plus 8.00% (Floor 1.00%)


(9)


29


1,154


7,104


18,239


17,300


8,043


LIBOR Plus 10.00% (Floor 1.00%)


(9)


(65)


3,291


27,801


53


65


27,789


Preferred Member Units


(9)


1,092


7,163


1,092


8,255


Preferred Member Units


(9)


(1,141)


250


7,382


1,141


6,241

Clad-Rex Steel, LLC


LIBOR Plus 9.50% (Floor 1.00%)


(5)


49


1,195


10,781


72


10,853


Member Units


(5)


(1,020)


587


9,630


1,020


8,610


10% Secured Debt


(5)


(11)


113


1,137


37


1,100


Member Units


(5)


70


460


70


530

CMS Minerals Investments


Member Units


(9)


(69)


1,900


276


1,624

Cody Pools, Inc.


LIBOR Plus 10.50% (Floor 1.75%)


(8)

125

1,798

16,000

1,784

14,216


Preferred Member Units


(8)

6,623

87

14,940

14,940

CompareNetworks Topco, LLC


LIBOR Plus 11.00% (Floor 1.00%)


(9)


43


1,123


8,288


2,075


2,410


7,953


Preferred Member Units


(9)


3,770


632


3,010


3,770


6,780

Direct Marketing Solutions, Inc.


LIBOR Plus 11.00% (Floor 1.00%)


(9)


(110)


1,934


15,707


37


737


15,007


Preferred Stock


(9)


(820)


20,200


820


19,380

Gamber-Johnson Holdings, LLC


LIBOR Plus 7.00% (Floor 2.00%)


(5)


(41)


1,776


19,022


1,640


824


19,838


Member Units


(5)


(920)


3,537


53,410


920


52,490

GRT Rubber Technologies LLC


LIBOR Plus 7.00%


(8)


1,294


15,016


1,759


16,775


Member Units


(8)


(2,550)


3,542


47,450


2,550


44,900

Guerdon Modular Holdings, Inc.


16.00% Secured Debt


(9)


(12,776)


12,588


12,776


12,776


LIBOR Plus 8.50% (Floor 1.00%)


(9)


(993)


1,010


993


993


Preferred Stock


(9)


(1,140)


1,140


1,140


1,140


Common Stock


(9)


(2,849)


2,983


2,849


2,849


Warrants


(9)


Harborside Holdings, LLC


Member Units


(8)


(2,406)


(3,054)


9,560


100


9,660


IDX Broker, LLC


11.00% Secured Debt


(9)


(42)


711


13,400


42


13,442


Preferred Member Units


(9)


9,337


(9,088)


1,193


15,040


15,040


Jensen Jewelers of Idaho, LLC


Prime Plus 6.75% (Floor 2.00%)


(9)


(14)


423


4,000


14


614


3,400


Member Units


(9)


(650)


683


8,270


650


7,620

Kickhaefer Manufacturing Company, LLC


11.50% Secured Debt


(5)


2,947


24,982


1,433


4,146


22,269


Member Units


(5)


12,240


12,240


9.00% Secured Debt


(5)


357


3,939


30


3,909


Member Units


(5)


84


1,160


1,160

Market Force Information, LLC


12.00% PIK Secured Debt


(9)


(11,762)


242


22,621


2,794


11,853


13,562


LIBOR Plus 11.00% (Floor 1.00%)


(9)


116


2,695


1,791


2,886


1,600


Member Units


(9)


(5,280)


5,280


5,280


MH Corbin Holding LLC


13.00% Secured Debt


(5)


(322)


1,181


8,890


32


642


8,280


Preferred Member Units


(5)


(20)


20


20


Preferred Member Units


(5)


(2,400)


4,770


2,400


2,370

Mid-Columbia Lumber Products, LLC


10.00% Secured Debt


(9)


148


44


1,602


148


1,750


12.00% Secured Debt


(9)


256


119


3,644


256


3,900


Member Units


(9)


(4,240)


3,239


1


101


101


9.50% Secured Debt


(9)


30


701


19


720


Member Units


(9)


(850)


20


1,640


709


2,349


MSC Adviser I, LLC


Member Units


(8)


12,740


2,491


74,520


42,240


116,760

Mystic Logistics Holdings, LLC


12.00% Secured Debt


(6)


814


6,253


990


520


6,723


Common Stock


(6)


580


203


8,410


580


8,990

OMi Holdings, Inc.


Common Stock


(8)


3,430


2,343


16,950


3,430


20,380

Pearl Meyer Topco LLC


12.00% Secured Debt


(6)


3,356


37,202


37,202


Member Units


(6)


2,940


538


16,740


800


15,940

169


Table of Contents

Amount of

Interest,

Fees or

Amount of

Amount of

Dividends

December 31, 

December 31, 

Realized

Unrealized

Credited to

2019

Gross

Gross

2020

Company


Investment(1)(10)(11)


Geography


Gain/(Loss)


Gain/(Loss)


Income(2)


Fair Value


Additions(3)


Reductions(4)


Fair Value

PPL RVs, Inc.


LIBOR Plus 7.00% (Floor 0.50%)


(8)


25


1,204


12,118


188


500


11,806


Common Stock


(8)


1,570


690


9,930


1,570


11,500

Principle Environmental, LLC
(d/b/a TruHorizon
Environmental Solutions)


13.00% Secured Debt


(8)


44


877


6,397


6,397


Preferred Member Units


(8)


(2,890)


13,390


2,890


10,500


Warrants


(8)


(220)


1,090


220


870

Quality Lease Service, LLC


Member Units


(7)


(4,880)


9,289


301


5,130


4,460

Trantech Radiator Topco, LLC


12.00% Secured Debt


(7)


1,105


9,102


22


480


8,644


Common Stock


(7)


1,375


116


4,655


1,375


6,030

Vision Interests, Inc.


13.00% Secured Debt


(9)


268


2,028


2,028


Series A Preferred Stock


(9)


(929)


4,089


929


3,160


Common Stock


(9)


(3,586)


3,296


409


3,296


3,705


Ziegler’s NYPD, LLC


6.50% Secured Debt


(8)


(21)


66


1,000


21


979


12.00% Secured Debt


(8)


76


625


625


14.00% Secured Debt


(8)


391


2,750


2,750


Warrants


(8)


Preferred Member Units


(8)


511


1,269


511


1,780

Other controlled investments


Access Media Holdings, LLC


10.00% PIK Secured Debt


(5)


(19,698)


17,442


50


6,387


17,442


23,829


Preferred Member Units


(5)


(9,376)


9,660


(284)


9,660


9,376


Member Units


(5)


(1)


1


1


Analytical Systems Keco, LLC


LIBOR Plus 10.00% (Floor 2.00%)


(8)


724


5,210


74


410


4,874


Preferred Member Units


(8)


3,200


3,200


Warrants


(8)


(306)


316


306


10

ASC Interests, LLC


13.00% Secured Debt


(8)


237


1,639


100


24


1,715


Member Units


(8)


(170)


1,290


170


1,120

ATS Workholding, LLC


5.00% Secured Debt


(9)


(1,332)


282


4,521


179


1,353


3,347


Preferred Member Units


(9)


(939)


939


939


Bolder Panther Group, LLC


LIBOR Plus 9.00% (Floor 1.50%)


(9)


579


27,225


27,225


Preferred Member Units


(9)


10,194


10,194


Preferred Member Units


(9)


14,000


14,000

Bond-Coat, Inc.


15.00% Secured Debt


(8)


(3)


1,399


11,473


123


11,596


Common Stock


(8)


(6,260)


8,300


6,260


2,040

Brewer Crane Holdings, LLC


LIBOR Plus 10.00% (Floor 1.00%)


(9)


1,012


8,989


20


496


8,513


Preferred Member Units


(9)


1,570


120


4,280


1,570


5,850

Bridge Capital Solutions Corporation


13.00% Secured Debt


(6)


1,771


7,797


606


8,403


Warrants


(6)


(280)


3,500


280


3,220


13.00% Secured Debt


(6)


135


996


2


998


Preferred Member Units


(6)


100


1,000


1,000

CBT Nuggets, LLC


Member Units


(9)


(4,770)


954


50,850


4,770


46,080

Centre Technologies Holdings, LLC


LIBOR Plus 10.00% (Floor 2.00%)


(8)


1,480


12,136


25


612


11,549


Preferred Member Units


(8)


320


120


5,840


320


6,160

Chamberlin Holding LLC


LIBOR Plus 8.00% (Floor 1.00%)


(8)


(47)


1,942


17,773


47


2,608


15,212


Member Units


(8)


4,030


4,134


24,040


4,030


28,070


Member Units


(8)


(455)


68


1,450


275


455


1,270

Charps, LLC


15.00% Secured Debt


(5)


258


2,000


1,331


669


8.67% Current / 1.33% PIK


(5)


1,716


1,499


8,903


428


8,475


Preferred Member Units


(5)


2,718


559


6,920


3,600


10,520

Copper Trail Fund Investments


LP Interests (CTMH, LP)


(9)


872


125


747

Datacom, LLC


8.00% Secured Debt


(8)


1,615


1,615


10.50% PIK Secured Debt


(8)


389


10,142


389


10,531


Class A Preferred Member Units


(8)


Class B Preferred Member Units


(8)


Digital Products Holdings LLC


LIBOR Plus 10.00% (Floor 1.00%)


(5)


1,026


2,177


18,452


1,072


1,447


18,077


Preferred Member Units


(5)


4,661


200


5,174


4,661


9,835

Garreco, LLC


LIBOR Plus 8.00% (Floor 1.00%, Ceiling 1.50%)


(8)


428


4,515


4


4,519


Member Units


(8)


(1,150)


2,560


1,150


1,410

Gulf Manufacturing, LLC


Member Units


(8)


(2,920)


135


7,430


2,920


4,510

Gulf Publishing Holdings, LLC


LIBOR Plus 9.50% (Floor 1.00%), Current Coupon 5.25% / 5.25% PIK


(8)


27


280


17


47


250


6.25% Current / 6.25% PIK


(8)


(1,091)


1,650


12,493


1,055


1,504


12,044


Member Units


(8)


(2,420)


2,420


2,420


Harris Preston Fund Investments


LP Interests (2717 MH, L.P.)


(8)


693


(319)


3,157


52


507


2,702


LP Interests (2717 HPP-MH, L.P.)


(8)


250


250

Harrison Hydra-Gen, Ltd.


Common Stock


(8)


(2,520)


104


7,970


2,520


5,450

170


Table of Contents

Amount of

Interest,

Fees or

Amount of

Amount of

Dividends

December 31, 

December 31, 

Realized

Unrealized

Credited to

2019

Gross

Gross

2020

Company


Investment(1)(10)(11)


Geography


Gain/(Loss)


Gain/(Loss)


Income(2)


Fair Value


Additions(3)


Reductions(4)


Fair Value

J&J Services, Inc.


11.50% Secured Debt


(7)


103


1,943


17,430


170


4,800


12,800


Preferred Stock


(7)


5,595


7,160


5,595


75


12,680

KBK Industries, LLC


Member Units


(5)


(2,270)


454


15,470


2,270


13,200

NAPCO Precast, LLC


Member Units


(8)


1,340


642


14,760


1,340


16,100

Nebraska Vet AcquireCo, LLC (NVS)


12.00% Secured Debt


(5)


223


10,395


10,395


Preferred Member Units


(5)


6,500


6,500

NexRev LLC


11.00% PIK Secured Debt


(8)


(289)


1,973


17,469


201


944


16,726


Preferred Member Units


(8)


(4,840)


(35)


6,310


4,840


1,470

NRI Clinical Research, LLC


9.00% Secured Debt


(9)


(47)


752


5,981


1,566


1,927


5,620


Warrants


(9)


260


1,230


260


1,490


Member Units


(9)


612


548


4,988


1,160


548


5,600

NRP Jones, LLC


12.00% Secured Debt


(5)


764


6,376


4,296


2,080


Member Units


(5)


1,279


(1,889)


384


4,710


1,889


2,821

NuStep, LLC


12.00% Secured Debt


(5)


2,444


19,703


196


2,706


17,193


Preferred Member Units


(5)


580


10,200


580


10,780

Pegasus Research Group, LLC


Member Units


(8)


660


491


8,170


660


8,830

Project BarFly, LLC


Member Units


(5)


1,584


1,584


7.00% Secured Debt


(5)


(8,591)


8,961


7,736


2,438


10,174


7.00% Secured Debt


(5)


(110)


110


110


Warrants


(5)


(607)


607


607


607


7.00% Secured Debt


(5)


3


343


343


Warrants


(5)


(473)


473


473


473


River Aggregates, LLC


Zero Coupon Secured Debt


(8)


28


722


28


750


Member Units


(8)


4,015


(3,840)


187


4,990


4,990


Member Units


(8)


71


3,169


71


3,240

Tedder Industries, LLC


12.00% Secured Debt


(9)


2,097


16,912


29


640


16,301


Preferred Member Units


(9)


8,136


8,136

UnionRock Energy Fund II, LP


LP Interests


(9)


2,894


2,894

Other


Amounts related to investments transferred to or from other
1940 Act classification during the period


(8,069)


4,251


9


(3,172)


Total Control investments


(59,594)


37,924


81,155


1,032,721


336,485


258,653


1,113,725

Affiliate Investments


AAC Holdings, Inc.


18.00% (10.00% Cash, 8.00% PIK) Secured Debt


(7)


(11,210)


4,568


119


11,530


21,359


23,702


9,187


Common Stock


(7)


3,148


3,148


Warrants


(7)


2,938


2,938


2,938

AFG Capital Group, LLC


10.00% Secured Debt


(8)


66


838


347


491


Preferred Member Units


(8)


630


5,180


630


5,810

American Trailer Rental Group LLC


LIBOR Plus 7.25% (Floor 1.00%)


(5)


(182)


1,119


27,087


182


27,269


Member Units


(5)


3,729


8,540


7,470


16,010

BBB Tank Services, LLC


LIBOR Plus 11.00% (Floor 1.00%)


(8)


(51)


668


4,698


75


51


4,722


Preferred Member Units


(8)


20


131


20


151


Member Units


(8)


(10)


290


10


280

Boccella Precast Products LLC


LIBOR Plus 10.00% (Floor 1.00%)


(6)


(138)


982


13,244


138


13,382


Member Units


(6)


(230)


619


6,270


230


6,040

Buca C, LLC


LIBOR Plus 9.25% (Floor 1.00%)


(7)


(4,562)


2,032


18,794


24


4,562


14,256


Preferred Member Units


(7)


(4,770)


69


4,701


69


4,770


CAI Software LLC


12.50% Secured Debt


(6)


257


3,001


9,160


40,830


2,516


47,474


Member Units


(6)


636


10


5,210


1,980


7,190

Chandler Signs Holdings, LLC


Class A Units


(8)


(1,280)


(91)


2,740


1,280


1,460

Charlotte Russe, Inc


Common Stock


(9)


Classic H&G Holdings, LLC


12.00% Secured Debt


(6)


217


3,112


26,000


1,200


24,800


Preferred Member Units


(6)


3,750


469


9,510


9,510

Congruent Credit Opportunities Funds


LP Interests (Fund II)


(8)


855


761


94


LP Interests (Fund III)


(8)


(515)


823


13,915


2,375


11,540

Copper Trail Fund Investments


LP Interests (Copper Trail Energy Fund I, LP)


(9)


(744)


698


2,362


580


1,782

Dos Rios Partners


LP Interests (Dos Rios Partners, LP)


(8)


(2,375)


7,033


759


2,375


5,417


LP Interests (Dos Rios Partners - A, LP)


(8)


(754)


2,233


241


754


1,720

East Teak Fine Hardwoods, Inc.


Common Stock


(7)


(100)


400


100


300

EIG Fund Investments


LP Interests (EIG Global Private Debt fund-A, L.P.)


(8)


6


(165)


141


720


110


304


526

Freeport Financial Funds


LP Interests (Freeport Financial SBIC Fund LP)


(5)


(514)


5,778


514


5,264


LP Interests (Freeport First Lien Loan Fund III LP)


(5)


(204)


930


9,696


989


364


10,321

Harris Preston Fund Investments


LP Interests (HPEP 3, L.P.)


(8)


187


2,474


784


3,258

171


Table of Contents

Amount of

Interest,

Fees or

Amount of

Amount of

Dividends

December 31, 

December 31, 

Realized

Unrealized

Credited to

2019

Gross

Gross

2020

Company


Investment(1)(10)(11)


Geography


Gain/(Loss)


Gain/(Loss)


Income(2)


Fair Value


Additions(3)


Reductions(4)


Fair Value

Hawk Ridge Systems, LLC


LIBOR Plus 6.00% (Floor 1.00%)


(9)


70


600


1,384


1,984


11.00% Secured Debt


(9)


(31)


1,758


13,400


5,031


31


18,400


Preferred Member Units


(9)


130


378


7,900


130


8,030


Preferred Member Units


(9)


420


420

Houston Plating and Coatings, LLC


8.00% Unsecured Convertible Debt


(8)


(1,360)


244


4,260


1,360


2,900


Member Units


(8)


(5,250)


261


10,330


5,250


5,080

I-45 SLF LLC


Member Units


(8)


(1,818)


2,346


14,407


3,200


1,818


15,789

L.F. Manufacturing Holdings, LLC


Preferred Member Units


(8)


12


81


12


93


Member Units


(8)


2,050


2,050

OnAsset Intelligence, Inc.


12.00% PIK Secured Debt


(8)


827


6,474


827


7,301


10.00% PIK Secured Debt


(8)


6


58


9


3


64


Preferred Stock


(8)


Warrants


(8)


PCI Holding Company, Inc.


12.00% Current Secured Debt


(9)


1,851


11,356


11,356


Preferred Stock


(9)


1,450


2,680


1,450


4,130


Preferred Stock


(9)


2,610


(2,610)


4,350


4,350


Rocaceia, LLC (Quality Lease and Rental Holdings, LLC)


12.00% Secured Debt


(8)


(413)


413


413


Preferred Member Units


(8)


Salado Stone Holdings, LLC


Class A Preferred Units


(8)


680


570


680


1,250

SI East, LLC


9.50% Current, Secured Debt


(7)


(74)


3,285


32,963


73


74


32,962


Preferred Member Units


(7)


1,580


1,292


8,200


1,580


9,780

Slick Innovations, LLC


13.00% Current, Secured Debt


(6)


115


919


6,197


163


641


5,719


Warrants


(6)


70


290


70


360


Common Stock


(6)


250


1,080


250


1,330

Superior Rigging & Erecting Co.


12.00% Current, Secured Debt


(7)


1,110


21,298


21,298


Preferred Member Units


(7)


4,500


4,500

UniTek Global Services, Inc.


LIBOR Plus 6.50% (Floor 1.00%)


(6)


(283)


233


2,962


17


553


2,426


Preferred Stock


(6)


(2,684)


2,684


2,684


Preferred Stock


(6)


(2,119)


212


2,282


212


2,119


375


Preferred Stock


(6)


312


255


1,889


945


2


2,832


Preferred Stock


(6)


(3,667)


3,667


3,667


Common Stock


(6)


Universal Wellhead Services Holdings, LLC


Preferred Member Units


(8)


(800)


800


800


Member Units


(8)


Volusion, LLC


11.50% Secured Debt


(8)


(181)


2,438


19,352


71


181


19,242


8.00% Unsecured Convertible Debt


(8)


33


291


291


Preferred Member Units


(8)


(8,010)


14,000


8,010


5,990


Warrants


(8)


(150)


150


150


Other


Amounts related to investments transferred to or from other
1940 Act classification during the period


11,210


(4,906)


118


(9,335)


Total Affiliate investments


2,203


(29,038)


32,435


330,287


159,571


132,892


366,301


(1)The principal amount, the ownership detail for equity investments and if the investment is income producing is included in the consolidated schedule of investments.
(2)Represents the total amount of interest, fees and dividends credited to income for the portion of the period for which an investment was included in Control or Affiliate categories, respectively. For investments transferred between Control and Affiliate categories during the period, any income or investment balances related to the time period it was in the category other than the one shown at period end is included in “Amounts from investments transferred from other 1940 Act classifications during the period.”
(3)Gross additions include increases in the cost basis of investments resulting from new portfolio investments, follow-on investments and accrued PIK interest, and the exchange of one or more existing securities for one or more new securities. Gross additions also include net increases in unrealized appreciation or net decreases in net unrealized depreciation as well as the movement of an existing portfolio company into this category and out of a different category.
(4)Gross reductions include decreases in the cost basis of investments resulting from principal repayments or sales and the exchange of one or more existing securities for one or more new securities. Gross reductions also include net increases in net

172


Table of Contents

unrealized depreciation or net decreases in unrealized appreciation as well as the movement of an existing portfolio company out of this category and into a different category.
(5)Portfolio company located in the Midwest region as determined by location of the corporate headquarters. The fair value as of December 31, 2020 for control investments located in this region was $256,121. This represented 16.9% of net assets as of December 31, 2020. The fair value as of December 31, 2020 for affiliate investments located in this region was $31,595. This represented 2.1% of net assets as of December 31, 2020.
(6)Portfolio company located in the Northeast region as determined by location of the corporate headquarters. The fair value as of December 31, 2020 for control investments located in this region was $82,476. This represented 5.4% of net assets as of December 31, 2020. The fair value as of December 31, 2020 for affiliate investments located in this region was $108,056. This represented 7.1% of net assets as of December 31, 2020.
(7)Portfolio company located in the Southeast region as determined by location of the corporate headquarters. The fair value as of December 31, 2020 for control investments located in this region was $44,614. This represented 2.9% of net assets as of December 31, 2020. The fair value as of December 31, 2020 for affiliate investments located in this region was $98,369. This represented 6.5% of net assets as of December 31, 2020.
(8)Portfolio company located in the Southwest region as determined by location of the corporate headquarters. The fair value as of December 31, 2020 for control investments located in this region was $442,075. This represented 29.2% of net assets as of December 31, 2020. The fair value as of December 31, 2020 for affiliate investments located in this region was $95,519. This represented 6.3% of net assets as of December 31, 2020.
(9)Portfolio company located in the West region as determined by location of the corporate headquarters. The fair value as of December 31, 2020 for control investments located in this region was $288,439. This represented 19.0% of net assets as of December 31, 2020. The fair value as of December 31, 2020 for affiliate investments located in this region was $32,762. This represented 2.2% of net assets as of December 31, 2020.
(10)All of the Company’s portfolio investments are generally subject to restrictions on resale as “restricted securities,” unless otherwise noted.
(11)This schedule should be read in conjunction with the consolidated schedule of investments and notes to the consolidated financial statements. Supplemental information can be located within the schedule of investments including end of period interest rate, preferred dividend rate, maturity date, investments not paid currently in cash and investments whose value was determined using significant unobservable inputs.
(12)Investment has an unfunded commitment as of December 31, 2020 (see Note K). The fair value of the investment includes the impact of the fair value of any unfunded commitments.

173


Table of Contents

Schedule 12-14

MAIN STREET CAPITAL CORPORATION

Consolidated Schedule of Investments In and Advances to Affiliates

December 31, 2019

(dollars in thousands)


Amount of


Interest,

Fees or

Amount of

Amount of

Dividends

December 31, 

December 31, 

Realized

Unrealized

Credited to

2018

Gross

Gross

2019

Company

Investment(1)(10)(11)

Geography

Gain/(Loss)

Gain/(Loss)

Income(2)

Fair Value

Additions(3)

Reductions(4)

Fair Value

Majorityowned investments


Café Brazil, LLC


Member Units


(8)

$

$

(2,340)

$

233

$

4,780

$

$

2,340

$

2,440

California Splendor Holdings LLC


LIBOR Plus 8.00% (Floor 1.00%)


(9)


1,175


10,928


17,176


21,000


7,104


LIBOR Plus 10.00% (Floor 1.00%)


(9)


3,595


27,755


46


27,801


Preferred Member Units


(9)


438


7,438


275


7,163


Preferred Member Units


(9)


(2,363)


250


9,745


2,363


7,382

Clad-Rex Steel, LLC


LIBOR Plus 9.00% (Floor 1.00%)


(5)


(128)


1,367


12,080


29


1,328


10,781


Member Units


(5)


(980)


269


10,610


980


9,630


10% Secured Debt


(5)


115


1,161


24


1,137


Member Units


(5)


110


350


110


460

CMS Minerals Investments


Member Units


(9)


(359)


41


2,580


680


1,900

CompareNetworks Topco, LLC


LIBOR Plus 11.00% (Floor 1.00%)


(9)


1,270


8,924


636


8,288


Preferred Member Units


(9)


1,035


2


3,010


3,010

Direct Marketing Solutions, Inc.


LIBOR Plus 11.00% (Floor 1.00%)


(9)


110


2,391


17,848


159


2,300


15,707


Preferred Stock


(9)


5,300


14,900


5,300


20,200

Gamber-Johnson Holdings, LLC


LIBOR Plus 6.50% (Floor 2.00%)


(5)


(57)


1,980


21,486


57


2,521


19,022


Member Units


(5)


7,950


3,721


45,460


7,950


53,410

GRT Rubber Technologies LLC


LIBOR Plus 7.00%


(8)


(23)


1,226


9,740


5,299


23


15,016


Member Units


(8)


8,390


11,152


39,060


8,390


47,450

Guerdon Modular Holdings, Inc.


16% Secured Debt


(9)


(12,018)


424


12,002


16


12,018


LIBOR Plus 8.50% (Floor 1.00%)


(9)


(1,010)


9


1,010


1,010


Preferred Stock


(9)


Common Stock


(9)


(134)


134


134


Warrants


(9)


Harborside Holdings, LLC


Member Units


(8)


(140)


9,500


200


140


9,560

IDX Broker, LLC


11.5% Secured Debt


(9)


(46)


1,669


14,350


46


996


13,400


Preferred Member Units


(9)


1,520


345


13,520


1,520


15,040

Jensen Jewelers of Idaho, LLC


Prime Plus 6.75% (Floor 2.00%)


(9)


22


406


3,355


4,001


3,356


4,000


Member Units


(9)


3,180


953


5,090


3,180


8,270

Kickhaefer Manufacturing Company, LLC


11.5% Secured Debt


(5)


3,265


28,775


71


3,864


24,982


Member Units


(5)


12,240


12,240


9.0% Secured Debt


(5)


357


3,970


31


3,939


Member Units


(5)


168


108


992


168


1,160

Lamb Ventures, LLC


LIBOR Plus 5.75%


(8)


(2)


10


402


402


11% Secured Debt


(8)


(32)


608


8,339


3,532


11,871


Preferred Equity


(8)


400


400


Member Units


(8)


6,006


(2,167)


394


7,440


7,440


9.5% Secured Debt


(8)


(4)


24


432


4


436


Member Units


(8)


(139)


(5)


74


630


630


Market Force Information, LLC


8% Secured Debt


(9)


(92)


132


200


2,787


292


2,695


6% Current / 6% PIK Secured Debt


(9)


(536)


3,103


22,624


533


536


22,621


Member Units


(9)


(9,762)


13,100


1,942


9,762


5,280

MH Corbin Holding LLC


5% Current / 5% PIK Secured Debt


(5)


462


1,446


11,733


1,557


4,400


8,890


Preferred Member Units


(5)


(980)


1,000


980


20


Preferred Member Units


(5)


370


4,770


4,770

Mid-Columbia Lumber Products, LLC


10% Secured Debt


(9)


(148)


181


1,746


4


148


1,602


12% Secured Debt


(9)


(255)


493


3,880


19


255


3,644


Member Units


(9)


(4,098)


6


3,860


238


4,098


9.5% Secured Debt


(9)


69


746


45


701


Member Units


(9)


170


73


1,470


170


1,640

MSC Adviser I, LLC


Member Units


(8)


8,772


4,988


65,748


8,772


74,520

Mystic Logistics Holdings, LLC


12% Secured Debt


(6)


875


7,506


29


1,282


6,253


Common Stock


(6)


8,200


219


210


8,200


8,410

PPL RVs, Inc.


LIBOR Plus 8.75% (Floor 0.50%)


(8)


(94)


1,463


15,100


41


3,023


12,118


Common Stock


(8)


(450)


10,380


450


9,930

174


Table of Contents


Amount of


Interest,

Fees or

Amount of

Amount of

Dividends

December 31, 

December 31, 

Realized

Unrealized

Credited to

2018

Gross

Gross

2019

Company

Investment(1)(10)(11)

Geography

Gain/(Loss)

Gain/(Loss)

Income(2)

Fair Value

Additions(3)

Reductions(4)

Fair Value

Principle Environmental, LLC
(d/b.a TruHorizon
Environmental Solutions)


13% Secured Debt


(8)


(61)


935


7,477


61


1,141


6,397


Preferred Member Units


(8)


300


2,317


13,090


300


13,390


Warrants


(8)


310


780


310


1,090

Quality Lease Service, LLC


Zero Coupon Secured Debt


(7)


(741)


891


6,450


891


7,341


Member Units


(7)


(1,490)


3,809


6,970


1,490


9,289

The MPI Group, LLC


9% Secured Debt


(7)


342


267


2,582


342


2,924


Series A Preferred Units


(7)


(8)


(440)


440


8


448


Warrants


(7)


Member Units


(7)


(839)


137


2,479


839


1,640

Trantech Radiator Topco, LLC


12% Secured Debt


(7)


981


10,302


1,200


9,102


Common Stock


(7)


68


4,655


4,655

Vision Interests, Inc.


13% Secured Debt


(9)


271


2,153


125


2,028


Series A Preferred Stock


(9)


349


3,740


349


4,089


Common Stock


(9)


129


280


129


409

Ziegler’s NYPD, LLC


6.5% Secured Debt


(8)


(2)


72


1,000


2


2


1,000


12% Secured Debt


(8)


67


425


200


625


14% Secured Debt


(8)


402


2,750


2,750


Warrants


(8)


Preferred Member Units


(8)


20


1,249


20


1,269

Other controlled investments


Access Media Holdings, LLC


10% PIK Secured Debt


(5)


(2,171)


50


8,558


2,171


6,387


Preferred Member Units (12)


(5)


(284)


(284)


Member Units


(5)


Analytical Systems Keco, LLC


LIBOR Plus 10.00% (Floor 2.00%)


(8)


448


5,245


35


5,210


Preferred Member Units


(8)


3,200


3,200


Warrants


(8)


316


316

ASC Interests, LLC


11% Secured Debt


(8)


201


1,622


17


1,639


Member Units


(8)


(80)


1,370


80


1,290

ATS Workholding, LLC


5% Secured Debt


(9)


(28)


364


4,390


225


94


4,521


Preferred Member Units


(9)


(2,787)


3,726


2,787


939

Bond-Coat, Inc.


15% Secured Debt


(8)


(229)


1,853


11,596


106


229


11,473


Common Stock


(8)


(1,070)


9,370


1,070


8,300

Brewer Crane Holdings, LLC


LIBOR Plus 10.00% (Floor 1.00%)


(9)


1,167


9,467


18


496


8,989


Preferred Member Units


(9)


120


4,280


4,280

Bridge Capital Solutions Corporation


13% Secured Debt


(6)


1,480


6,221


1,576


7,797


Warrants


(6)


(520)


4,020


520


3,500


13% Secured Debt


(6)


(6)


101


1,000


2


6


996


Preferred Member Units


(6)


75


1,000


1,000

CBT Nuggets, LLC


Member Units


(9)


(10,760)


300


61,610


10,760


50,850

Centre Technologies Holdings, LLC


LIBOR Plus 9.00% (Floor 2.00%)


(8)


1,572


12,136


12,136


Preferred Member Units


(8)


120


5,840


5,840

Chamberlin Holding LLC


LIBOR Plus 10.00% (Floor 1.00%)


(8)


125


2,474


20,028


174


2,429


17,773


Member Units


(8)


5,100


1,659


18,940


5,100


24,040


Member Units


(8)


403


45


732


718


1,450

Charps, LLC


11.50% Secured Debt


(5)


(83)


675


11,888


1,695


13,583


15% Secured Debt


(5)


175


2,000


2,000


Preferred Member Units


(5)


4,650


579


2,270


4,650


6,920

Copper Trail Fund Investments


LP Interests (CTMH, LP)


(9)


5


872


872

Datacom, LLC


8.00% Secured Debt


(8)


(75)


1,690


75


1,615


10.50% PIK Secured Debt


(8)


361


9,786


361


5


10,142


Class A Preferred Member Units


(8)


Class B Preferred Member Units


(8)


Digital Products Holdings LLC


LIBOR Plus 10.00% (Floor 1.00%)


(5)


(1,025)


2,944


25,511


87


7,146


18,452


Preferred Member Units


(5)


(4,327)


200


8,466


1,035


4,327


5,174

Garreco, LLC


LIBOR Plus 8.00% (Floor 1.00%, Ceiling 1.50%)


(8)


472


5,099


18


602


4,515


Member Units


(8)


(30)


2,590


30


2,560

Gulf Manufacturing, LLC


Member Units


(8)


(4,260)


671


11,690


4,260


7,430

Gulf Publishing Holdings, LLC


LIBOR Plus 9.50% (Floor 1.00%)


(8)


25


320


40


280


12.5% Secured Debt


(8)


1,619


12,594


28


129


12,493


Member Units


(8)


(1,700)


4,120


1,700


2,420

Harris Preston Fund Investments


LP Interests (2717 MH, L.P.)


(8)


329


1,133


2,524


500


3,157

Harrison Hydra-Gen, Ltd.


Common Stock


(8)


(100)


247


8,070


100


7,970

KBK Industries, LLC


Member Units


(5)


6,860


1,923


8,610


6,860


15,470

J&J Services, Inc.


11.50% Secured Debt


(7)


531


17,430


17,430


Preferred Stock


(7)


7,160


7,160

NAPCO Precast, LLC


LIBOR Plus 8.50%


(8)


(11)


123


11,475


11


11,486


Member Units


(8)


770


3,063


13,990


770


14,760

175


Table of Contents


Amount of


Interest,

Fees or

Amount of

Amount of

Dividends

December 31, 

December 31, 

Realized

Unrealized

Credited to

2018

Gross

Gross

2019

Company

Investment(1)(10)(11)

Geography

Gain/(Loss)

Gain/(Loss)

Income(2)

Fair Value

Additions(3)

Reductions(4)

Fair Value

NexRev LLC


11% Secured Debt


(8)


1,956


17,288


835


654


17,469


Preferred Member Units


(8)


(1,580)


195


7,890


1,580


6,310

NRI Clinical Research, LLC


LIBOR Plus 6.50% (Floor 1.50%)


(9)


11


200


200


14% Secured Debt


(9)


(44)


971


6,685


44


748


5,981


Warrants


(9)


570


660


570


1,230


Member Units


(9)


2,510


32


2,478


2,510


4,988

NRP Jones, LLC


12% Secured Debt


(5)


776


6,376


6,376


Member Units


(5)


(1,250)


323


5,960


1,250


4,710

NuStep, LLC


12% Secured Debt


(5)


2,556


20,458


44


799


19,703


Preferred Member Units


(5)


10,200


10,200

OMi Holdings, Inc.


Common Stock


(8)


930


1,920


16,020


930


16,950

Pegasus Research Group, LLC


Member Units


(8)


490


7,680


490


8,170

River Aggregates, LLC


Zero Coupon Secured Debt


(8)


722


722


Member Units


(8)


380


4,610


380


4,990


Member Units


(8)


239


2,930


239


3,169

Tedder Industries, LLC


12%, Secured Debt


(9)


69


480


1,200


1,040


640


12%, Secured Debt


(9)


2,021


16,246


26


16,272


Preferred Member Units


(9)


7,476


660


8,136

Other


Amounts related to investments transferred to or from other
1940 Act classification during the period


(187)


260


(133)


5,809


Total Control investments


4,797


(980)


92,414


1,004,993


219,523


185,986


1,032,721

Affiliate Investments


AFG Capital Group, LLC


Warrants


(8)


781


(691)


950


950


10% Secured Debt


(8)


66


1,040


202


838


Preferred Member Units


(8)


1,200


(40)


3,980


1,200


5,180

American Trailer Rental Group LLC


LIBOR Plus 7.25% (Floor 1.00%)


(5)


182


2,655


20,312


8,729


1,954


27,087


Member Units


(5)


2,760


5,780


2,760


8,540

BBB Tank Services, LLC


LIBOR Plus 11% (Floor 1.00%)


(8)


680


3,833


865


4,698


Preferred Member Units


(8)


18


113


18


131


Member Units


(8)


60


230


60


290

Boccella Precast Products LLC


LIBOR Plus 12% (Floor 1.00%)


(6)


(75)


2,187


15,724


475


2,955


13,244


Member Units


(6)


1,094


236


5,080


1,190


6,270

Boss Industries, LLC


Preferred Member Units


(5)


3,771


(3,930)


611


6,176


6,176


Buca C, LLC


LIBOR Plus 9.25% (Floor 1.00%)


(7)


(187)


2,260


19,038


43


287


18,794


Preferred Member Units


(7)


270


4,431


270


4,701

CAI Software LLC


11% Secured Debt


(6)


(34)


1,239


10,880


34


1,754


9,160


Member Units


(6)


2,493


31


2,717


2,493


5,210

Chandler Signs Holdings, LLC


12% Secured Debt


(8)


(24)


581


4,546


47


4,593


Class A Units


(8)


620


39


2,120


620


2,740

Charlotte Russe, Inc


8.50% Secured Debt


(9)


(7,012)


4,003


3,930


4,003


7,933


Common Stock


(9)


Condit Exhibits, LLC


Member Units


(9)


1,850


(1,850)


132


1,950


1,950


Congruent Credit Opportunities Funds


LP Interests (Fund II)


(8)


855


855


LP Interests (Fund III)


(8)


(195)


1,447


17,468


3,553


13,915

Copper Trail Fund Investments


LP Interests (Copper Trail Energy Fund I, LP)


(9)


37


(310)


583


4,170


1,808


2,362

Dos Rios Partners


LP Interests (Dos Rios Partners, LP)


(8)


(122)


7,153


120


7,033


LP Interests (Dos Rios Partners - A, LP)


(8)


(38)


2,271


38


2,233

East Teak Fine Hardwoods, Inc.


Common Stock


(7)


(160)


16


560


160


400

EIG Fund Investments


LP Interests (EIG Global Private Debt fund-A, L.P.)


(8)


8


137


505


283


68


720

Freeport Financial Funds


LP Interests (Freeport Financial SBIC Fund LP)


(5)


379


5,399


379


5,778


LP Interests (Freeport First Lien Loan Fund III LP)


(5)


(84)


1,059


10,980


799


2,083


9,696

Fuse, LLC


12% Secured Debt


(9)


119


1,939


1,939


Common Stock


(9)


256


256

Harris Preston Fund Investments


LP Interests (HPEP 3, L.P.)


(8)


1,733


741


2,474

Hawk Ridge Systems, LLC


LIBOR Plus 6.00% (Floor 1.00%)


(9)


26


600


600


11.0% Secured Debt


(9)


(34)


1,460


14,300


34


934


13,400


Preferred Member Units


(9)


640


375


7,260


640


7,900


Preferred Member Units


(9)


40


380


40


420

Houston Plating and Coatings, LLC


8% Unsecured Convertible Debt


(8)


540


243


3,720


540


4,260


Member Units


(8)


1,884


544


8,330


2,000


10,330

I-45 SLF LLC


Member Units


(8)


(2,020)


3,204


15,627


800


2,020


14,407

176


Table of Contents


Amount of


Interest,

Fees or

Amount of

Amount of

Dividends

December 31, 

December 31, 

Realized

Unrealized

Credited to

2018

Gross

Gross

2019

Company

Investment(1)(10)(11)

Geography

Gain/(Loss)

Gain/(Loss)

Income(2)

Fair Value

Additions(3)

Reductions(4)

Fair Value

L.F. Manufacturing Holdings, LLC


Preferred Member Units


(8)


11


81


81


Member Units


(8)


(10)


2,060


10


2,050

OnAsset Intelligence, Inc.


12% PIK Secured Debt


(8)


731


5,743


731


6,474


10% PIK Secured Debt


(8)


5


53


5


58


Preferred Stock


(8)


Warrants


(8)


PCI Holding Company, Inc.


12% Current Secured Debt


(9)


1,488


11,908


98


650


11,356


Preferred Stock


(9)


2,340


340


2,340


2,680


Preferred Stock


(9)


870


3,480


870


4,350

Rocaceia, LLC (Quality Lease and Rental Holdings, LLC)


12% Secured Debt


(8)


165


250


165


415


Preferred Member Units


(8)


Salado Stone Holdings, LLC


Class A Preferred Units


(8)


(470)


1,040


470


570

SI East, LLC


9.50% Current, Secured Debt


(7)


275


3,648


34,885


365


2,287


32,963


Preferred Member Units


(7)


2,200


460


6,000


2,200


8,200

Slick Innovations, LLC


14% Current, Secured Debt


(6)


983


6,959


679


1,441


6,197


Warrants


(6)


109


181


109


290


Common Stock


(6)


380


1,048


700


380


1,080

UniTek Global Services, Inc.


LIBOR Plus 6.50% (Floor 1.00%)


(6)


22


260


2,969


23


30


2,962


Preferred Stock


(6)


(5,240)


511


7,413


511


5,240


2,684


Preferred Stock


(6)


306


339


1,637


645


2,282


Preferred Stock


(6)


1,080


53


1,889


1,889


Preferred Stock


(6)


629


3,038


629


3,667


Common Stock


(6)


(1,420)


1,420


1,420


Universal Wellhead Services Holdings, LLC


Preferred Member Units


(8)


(345)


195


950


195


345


800


Member Units


(8)


(2,330)


2,330


2,330


Volusion, LLC


11.50% Secured Debt


(8)


(810)


3,132


18,407


1,755


810


19,352


8% Unsecured Convertible Debt


(8)


(118)


31


297


112


118


291


Preferred Member Units


(8)


14,000


14,000


Warrants


(8)


(1,740)


1,890


1,740


150

Other


Amounts related to investments transferred to or from other
1940 Act classification during the period


(415)


1,030


19,439


Total Affiliate investments


(565)


990


34,732


359,890


46,680


56,844


330,287


(1)The principal amount, the ownership detail for equity investments and if the investment is income producing is included in the consolidated schedule of investments.
(2)Represents the total amount of interest, fees and dividends credited to income for the portion of the period for which an investment was included in Control or Affiliate categories, respectively. For investments transferred between Control and Affiliate categories during the period, any income or investment balances related to the time period it was in the category other than the one shown at period end is included in “Amounts from investments transferred from other 1940 Act classifications during the period.”
(3)Gross additions include increases in the cost basis of investments resulting from new portfolio investments, follow-on investments and accrued PIK interest, and the exchange of one or more existing securities for one or more new securities. Gross additions also include net increases in unrealized appreciation or net decreases in net unrealized depreciation as well as the movement of an existing portfolio company into this category and out of a different category.
(4)Gross reductions include decreases in the cost basis of investments resulting from principal repayments or sales and the exchange of one or more existing securities for one or more new securities. Gross reductions also include net increases in net unrealized depreciation or net decreases in unrealized appreciation as well as the movement of an existing portfolio company out of this category and into a different category.
(5)Portfolio company located in the Midwest region as determined by location of the corporate headquarters. The fair value as of December 31, 2019 for control investments located in this region was $245,549. This represented 16.0% of net assets as of December 31, 2019. The fair value as of December 31, 2019 for affiliate investments located in this region was $51,101. This represented 3.3% of net assets as of December 31, 2019.

177


Table of Contents

(6)Portfolio company located in the Northeast region as determined by location of the corporate headquarters. The fair value as of December 31, 2019 for control investments located in this region was $27,956. This represented 1.8% of net assets as of December 31, 2019. The fair value as of December 31, 2019 for affiliate investments located in this region was $54,935. This represented 3.6% of net assets as of December 31, 2019.
(7)Portfolio company located in the Southeast region as determined by location of the corporate headquarters. The fair value as of December 31, 2019 for control investments located in this region was $52,200. This represented 3.4% of net assets as of December 31, 2019. The fair value as of December 31, 2019 for affiliate investments located in this region was $65,058. This represented 4.2% of net assets as of December 31, 2019.
(8)Portfolio company located in the Southwest region as determined by location of the corporate headquarters. The fair value as of December 31, 2019 for control investments located in this region was $415,344. This represented 27.0% of net assets as of December 31, 2019. The fair value as of December 31, 2019 for affiliate investments located in this region was $113,930. This represented 7.4% of net assets as of December 31, 2019.
(9)Portfolio company located in the West region as determined by location of the corporate headquarters. The fair value as of December 31, 2019 for control investments located in this region was $291,672. This represented 19.0% of net assets as of December 31, 2019. The fair value as of December 31, 2019 for affiliate investments located in this region was $45,263. This represented 2.9% of net assets as of December 31, 2019.
(10)All of the Company’s portfolio investments are generally subject to restrictions on resale as “restricted securities,” unless otherwise noted.
(11)This schedule should be read in conjunction with the consolidated schedule of investments and notes to the consolidated financial statements. Supplemental information can be located within the schedule of investments including end of period interest rate, preferred dividend rate, maturity date, investments not paid currently in cash and investments whose value was determined using significant unobservable inputs.
(12)Investment has an unfunded commitment as of December 31, 2019 (see Note K). The fair value of the investment includes the impact of the fair value of any unfunded commitments.

178


Table of Contents

Item 9. Changes in and Disagreements with Accountants on Accounting and Financial Disclosure

Not applicable.

Item 9A. Controls and Procedures

(a) Evaluation of Disclosure Controls and Procedures. As of the end of the period covered by this annual report on Form 10-K, we carried out an evaluation, under the supervision and with the participation of our management, including our Chief Executive Officer, President, Chief Financial Officer, Chief Compliance Officer and Chief Accounting Officer, of our disclosure controls and procedures (as defined in Rule 13a-15 of the Exchange Act). Based on that evaluation, our Chief Executive Officer, President, Chief Financial Officer, Chief Compliance Officer and Chief Accounting Officer have concluded that our current disclosure controls and procedures are effective in timely alerting them of material information relating to us that is required to be disclosed in the reports we file or submit under the Exchange Act.

(b) Management’s Report on Internal Control Over Financial Reporting. The management of Main Street Capital Corporation and its subsidiaries (the Company) is responsible for establishing and maintaining adequate internal control over financial reporting, as such term is defined in Exchange Act Rule 13a-15(f). Under the supervision and with the participation of management, including the Chief Executive Officer and Chief Financial Officer, the Company conducted an evaluation of the effectiveness of the Company’s internal control over financial reporting based on the criteria established in Internal Control — Integrated Framework issued by the Committee of Sponsoring Organizations of the Treadway Commission (COSO). Based on the Company’s evaluation under the framework in Internal Control — Integrated Framework, management concluded that the Company’s internal control over financial reporting was effective as of December 31, 2020. Grant Thornton LLP, the Company’s independent registered public accounting firm, has issued an attestation report on the effectiveness of the Company’s internal control over financial reporting as of December 31, 2020, as stated in its report which is included herein.

(c) Attestation Report of the Registered Public Accounting Firm. Our independent registered public accounting firm, Grant Thornton LLP, has issued an attestation report on the effectiveness of our internal control over financial reporting, which is set forth above under the heading “Reports of Independent Registered Public Accounting Firm” in Item 8. “Consolidated Financial Statements and Supplementary Data” of this Annual Report on Form 10-K.

(d) Changes in Internal Control over Financial Reporting. There have been no changes in our internal control over financial reporting that occurred during the fiscal quarter ended December 31, 2020 that have materially affected, or are reasonably likely to materially affect, our internal control over financial reporting.

Item 9B. Other Information

Director Departure and Reduction in Size of Board

On February 22, 2021, Ms. Valerie Banner informed our Board of Directors that after four years of excellent service to our Board, she has decided not stand for re-election to the Board of Directors at the end of her current term on the date of our 2021 annual meeting of stockholders. Ms. Banner’s decision not to stand for re-election was not the result of any disagreement with management or the Board of Directors. In connection with Ms. Banner’s departure, the Board of Directors passed a resolution reducing the number of directors that constitutes the full Board of Directors from ten to nine directors, effective as of the date of our 2021 annual meeting of stockholders.

Fees and Expenses

The following table is being provided to update, as of December 31, 2020, certain information in the Company’s effective shelf registration statement on Form N-2 (File No. 333-231146) filed with the SEC on April 30, 2019 as supplemented by the prospectus supplements relating to our ATM Program and to the direct stock purchase feature of the Plan. The information is intended to assist you in understanding the costs and expenses that an investor in the Company will bear directly or indirectly. We caution you that some of the percentages indicated in the table below

179


Table of Contents

are estimates and may vary. Except where the context suggests otherwise, whenever this Annual Report on Form 10-K contains a reference to fees or expenses paid by “you,” “us” or “Main Street,” or that “we” will pay fees or expenses, stockholders will indirectly bear such fees or expenses as investors in us.

Stockholder Transaction Expenses:


Sales load (as a percentage of offering price)


%(1)

Offering expenses (as a percentage of offering price)


%(2)

Dividend reinvestment and direct stock purchase plan expenses


%(3)

Total stockholder transaction expenses (as a percentage of offering price)


%(4)

Annual Expenses of the Company (as a percentage of net assets attributable to common stock):


Operating expenses


2.81

%(5)

Interest payments on borrowed funds


3.43

%(6)

Income tax expense


%(7)

Acquired fund fees and expenses


0.30

%(8)

Total annual expenses


6.54

%


(1)

The maximum agent commission with respect to the shares of our common stock sold by us in the ATM Program is 1.00%. Purchasers of shares of common stock through the direct stock purchase feature of the Plan will not pay any sales load. In the event that our securities are sold to or through underwriters, a corresponding prospectus or prospectus supplement will disclose the applicable sales load.

(2)

Estimated offering expenses payable by us for the estimated duration of the ATM Program are approximately $0.6 million. In the event that we conduct an offering of our securities, a corresponding prospectus or prospectus supplement will disclose the estimated offering expenses.

(3)

The expenses of administering the Plan are included in operating expenses. Additional costs may be charged to participants in the direct stock purchase feature of the plan for certain types of transactions.

(4)

Total stockholder transaction expenses may include sales load and will be disclosed in a future prospectus or prospectus supplement, if any.

(5)

Operating expenses in this table represent our estimated expenses.

(6)

Interest payments on borrowed funds represent our estimated annual interest payments on borrowed funds based on current debt levels as adjusted for projected increases (but not decreases) in debt levels over the next twelve months.

(7)

Income tax expense relates to the accrual of (a) deferred tax provision (benefit) primarily related to loss carryforwards, timing differences in net unrealized appreciation or depreciation and other temporary book-tax differences from our portfolio investments held in Taxable Subsidiaries and (b) excise, state and other taxes. Deferred taxes are non-cash in nature and may vary significantly from period to period. We are required to include deferred taxes in calculating our annual expenses even though deferred taxes are not currently payable or receivable. Due to the variable nature of deferred tax expense, which can be a large portion of the income tax expense, and the difficulty in providing an estimate for future periods, this income tax expense estimate is based upon the actual amount of income tax expense for the year ended December 31, 2020.

(8)

Acquired fund fees and expenses represent the estimated indirect expense incurred due to investments in other investment companies and private funds.

Example

The following example demonstrates the projected dollar amount of total cumulative expenses that would be incurred over various periods with respect to a hypothetical investment in our common stock. In calculating the following expense amounts, we have assumed we would have no additional leverage and that our annual operating

180


Table of Contents

expenses would remain at the levels set forth in the table above and that you would pay either no sales load or a sales load of up to 1.00% (the commission to be paid by us with respect to common stock sold by us in the ATM Program).


1 Year


3 Years


5 Years


10 Years

You would pay the following expenses on a $1,000 investment, assuming a 5.0% annual return and no sales load

$

65

$

192

$

315

$

606

You would pay the following expenses on a $1,000 investment, assuming a 5.0% annual return and a 1.00% sales load

$

75

$

202

$

325

$

616

The example and the expenses in the table above should not be considered a representation of our future expenses, and actual expenses may be greater or less than those shown. While the example assumes, as required by the SEC, a 5.0% annual return, our performance will vary and may result in a return greater or less than 5.0%. In addition, while the example assumes reinvestment of all dividends at net asset value, participants in our dividend reinvestment plan will receive a number of shares of our common stock, determined by dividing the total dollar amount of the dividend payable to a participant by (i) the market price per share of our common stock at the close of trading on a valuation date determined by our Board of Directors for each dividend in the event that we use newly issued shares to satisfy the share requirements of the dividend reinvestment plan or (ii) the average purchase price of all shares of common stock purchased by the plan administrator in the event that shares are purchased in the open market to satisfy the share requirements of the dividend reinvestment plan, which may be at, above or below net asset value. See the description in “Item 5. Market for Registrant’s Common Equity, Related Stockholder Matters and Issuer Purchases of Equity Securities — Common Stock and Holders” for additional information regarding our dividend reinvestment plan.

PART III

Item 10. Directors, Executive Officers and Corporate Governance

The information required by this Item will be contained in the definitive proxy statement relating to our 2021 annual meeting of stockholders (the “Proxy Statement”) under the headings “Election of Directors,” “Corporate Governance” and “Executive Officers” to be filed with the Securities and Exchange Commission on or prior to April 30, 2021, and is incorporated herein by reference.

We have adopted a code of business conduct and ethics that applies to directors, officers and employees of Main Street. This code of ethics is published on our Web site at www.mainstcapital.com. We intend to disclose any substantive amendments to, or waivers from, this code of conduct within four business days of the waiver or amendment through a Web site posting.

Item 11. Executive Compensation

The information required by this Item will be contained in the Proxy Statement under the headings “Compensation of Executive Officers,” “Compensation of Directors,” “Compensation Discussion and Analysis,” “Compensation Committee Interlocks and Insider Participation” and “Compensation Committee Report,” to be filed with the Securities and Exchange Commission on or prior to April 30, 2021, and is incorporated herein by reference.

181


Table of Contents

Item 12. Security Ownership of Certain Beneficial Owners and Management and Related Stockholder Matters

The following table provides information regarding our equity compensation plans as of December 31, 2020:


Number of Securities 

Remaining Available for

Number of Securities to be

WeightedAverage Exercise 

 Future Issuance Under

 Issued Upon Exercise of

Price of Outstanding

 Equity Compensation Plans 

 Outstanding Options,

 Options, Warrants and

(Excluding Securities 

Plan Category


 Warrants and Rights


 Rights


Reflected in Column)

Equity compensation plans approved by security holders(1)

$

$

$

1,773,325

Equity compensation plans not approved by security holders(2)


160,352


Total

$

160,352

$

$

1,773,325


(1)Consists of our Main Street Capital Corporation 2015 Equity and Incentive Plan and our Main Street Capital Corporation 2015 Non-Employee Director Restricted Stock Plan. As of December 31, 2020, we had issued 1,572,612 shares of restricted stock pursuant to these plans, of which 836,131 had vested and 45,631 shares were forfeited. Pursuant to each of these plans, if any award issued thereunder shall for any reason expire or otherwise terminate or be forfeited, in whole or in part, the shares of stock not acquired under such award shall revert to and again become available for issuance under such plan. For more information regarding these plans, see “Note J — Share-Based Compensation” in the notes to the consolidated financial statements.
(2)Consists of our 2015 Deferred Compensation Plan. For more information regarding this plan, see “Note M — Related Party Transactions” in the notes to the consolidated financial statements.

The other information required by this Item will be contained in the Proxy Statement under the heading “Security Ownership of Certain Beneficial Owners and Management,” to be filed with the Securities and Exchange Commission on or prior to April 30, 2021, and is incorporated herein by reference.

Item 13. Certain Relationships and Related Transactions, and Director Independence

The information required by this Item will be contained in the Proxy Statement under the headings “Certain Relationships and Related Party Transactions” and “Corporate Governance,” to be filed with the Securities and Exchange Commission on or prior to April 30, 2021, and is incorporated herein by reference.

Item 14. Principal Accountant Fees and Services

The information required by this Item will be contained in the Proxy Statement under the heading “Ratification of Appointment of Independent Registered Public Accounting Firm for Year Ending December 31, 2021,” to be filed with the Securities and Exchange Commission on or prior to April 30, 2021, and is incorporated herein by reference.

182


Table of Contents

PART IV

Item 15. Exhibits and Consolidated Financial Statement Schedules

The following documents are filed or incorporated by reference as part of this Annual Report:

1.

Consolidated Financial Statements

Reports of Independent Registered Public Accounting Firm

77

Consolidated Balance Sheets—As of December 31, 2020 and December 31, 2019

82

Consolidated Statements of Operations—For the years ended December 31, 2020, 2019 and 2018

83

Consolidated Statements of Changes in Net Assets—For the years ended December 31, 2020, 2019 and 2018

84

Consolidated Statements of Cash Flows—For the years ended December 31, 2020, 2019 and 2018

85

Consolidated Schedule of Investments—December 31, 2020

86

Consolidated Schedule of Investments—December 31, 2019

108

Notes to Consolidated Financial Statements

129

2.

Consolidated Financial Statement Schedule

Report of Independent Registered Public Accounting Firm

168

Schedule of Investments in and Advances to Affiliates for the Years Ended December 31, 2020 and 2019

169

3.Exhibits

Listed below are the exhibits which are filed as part of this report (according to the number assigned to them in Item 601 of Regulation S-K):

Exhibit
Number


Description

3.1*

Articles of Amendment and Restatement of Main Street Capital Corporation (previously filed as Exhibit (a) to Main Street Capital Corporation’s Pre-Effective Amendment No. 2 to the Registration Statement on Form N-2 filed on August 15, 2007 (Reg. No. 333-142879))

3.2*

Amended and Restated Bylaws of Main Street Capital Corporation (previously filed as Exhibit 3.1 to Main Street Capital Corporation’s Current Report on Form 8-K filed on March 6, 2013 (File No. 1-33723))

4.1*

Form of Common Stock Certificate (previously filed as Exhibit (d) to Main Street Capital Corporation’s Pre-Effective Amendment No. 2 to the Registration Statement on Form N-2 filed on August 15, 2007 (Reg. No. 333-142879))

4.2*

Dividend Reinvestment and Direct Stock Purchase Plan, effective May 10, 2019 (previously filed as Exhibit 99.1 to Main Street Capital Corporation’s Current Report on Form 8-K filed on May 10, 2019 (File No. 1-33723))

4.3*

Main Street Mezzanine Fund, LP SBIC debentures guaranteed by the SBA (previously filed as Exhibit (f)(1) to Main Street Capital Corporation’s Pre-Effective Amendment No. 1 to the Registration Statement on Form N-2 filed on June 22, 2007 (Reg. No. 333-142879))

4.4*

Main Street Capital II, LP SBIC debentures guaranteed by the SBA (see Exhibit (f)(1) to Main Street Capital Corporation’s Pre-Effective Amendment No. 1 to the Registration Statement on Form N-2 filed on June 22, 2007 for a substantially identical copy of the form of debentures)

4.5*

Main Street Capital III, LP SBIC debentures guaranteed by the SBA (see Exhibit (f)(1) to Main Street Capital Corporation’s Pre-Effective Amendment No. 1 to the Registration Statement on Form N-2 filed on June 22, 2007 for a substantially identical copy of the form of debentures)

183


Table of Contents

Exhibit
Number


Description

4.6*

Form of Indenture between Main Street Capital Corporation and The Bank of New York Mellon Trust Company, N.A. (previously filed as Exhibit (d)(6) to Main Street Capital Corporation’s Post-Effective Amendment No. 2 to the Registration Statement on Form N-2 filed on March 28, 2013 (Reg. No. 333-183555))

4.7*

Form of Third Supplemental Indenture relating to the 4.50% Notes due 2022, between Main Street Capital Corporation and The Bank of New York Mellon Trust Company, N.A. (previously filed as Exhibit (d)(12) to Main Street Capital Corporation’s Post-Effective Amendment No. 14 to the Registration Statement on Form N-2 filed on November 17, 2017 (Reg. No. 333-203147))

4.8*

Form of 4.50% Notes due 2022 (incorporated by reference to Exhibit 4.7)

4.9*

Form of Fourth Supplemental Indenture relating to the 5.20% Notes due 2024, between Main Street Capital Corporation and The Bank of New York Mellon Trust Company, N.A. (previously filed as Exhibit (d)(11) to Main Street Capital Corporation’s Post-Effective Amendment No. 7 to the Registration Statement on Form N-2 filed on April 18, 2019 (Reg. No. 333-223483))

4.10*

Form of 5.20% Notes due 2024 (incorporated by reference to Exhibit 4.9)

4.11*

Fifth Supplemental Indenture relating to the 3.00% Notes due 2026, between Main Street Capital Corporation anfd The Bank of New York Mellon Trust Company, N.A., as trustee (previously filed as Exhibit 4.1 to Main Street Capital Corporation’s Current Report on Form 8-K filed on January 14, 2021 (File No. 1-33723))

4.12*

Form of 3.00% Notes due 2026 (incorporated by reference to Exhibit 4.11)

4.13*

Description of Main Street Capital Corporation’s securities registered pursuant to Section 12 of the Securities Exchange Act of 1934 (previously filed as Exhibit 4.11 to Main Street Capital Corporation’s Annual Report on Form 10-K filed on February 28, 2020 (File No. 1-33723))

10.1*

Third Amended and Restated Credit Agreement dated June 5, 2018 (previously filed as Exhibit 10.1 to Main Street Capital Corporation’s Current Report on Form 8-K filed on June 6, 2018 (File No. 1-33723))

10.2*

Third Amended and Restated General Security Agreement dated June 5, 2018 (previously filed as Exhibit 10.2 to Main Street Capital Corporation’s Current Report on Form 8-K filed on June 6, 2018 (File No. 1-33723))

10.3*

Third Amended and Restated Equity Pledge Agreement dated June 5, 2018 (previously filed as Exhibit 10.3 to Main Street Capital Corporation’s Current Report on Form 8-K filed on June 6, 2018 (File No. 1-33723))

10.4*

Amended and Restated Custodial Agreement dated September 20, 2010 (previously filed as Exhibit 10.3 to Main Street Capital Corporation’s Current Report on Form 8-K filed September 21, 2010 (File No. 1-33723))

10.5*

Third Amendment to Amended and Restated Credit Agreement and First Amendment to Amended and Restated Custodial Agreement dated November 21, 2011 (previously filed as Exhibit 10.1 to Main Street Capital Corporation’s Current Report on Form 8-K filed November 22, 2011 (File No. 1-33723))

10.6*

Supplement Agreement dated July 19, 2018 (previously filed as Exhibit 10.1 to Main Street Capital Corporation’s Current Report on Form 8-K filed on July 20, 2018 (File No. 1-33723))

10.7*

Supplement Agreement dated November 15, 2018 (previously filed as Exhibit 10.1 to Main Street Capital Corporation’s Current Report on Form 8-K filed on November 15, 2018 (File No. 1-33723))

10.8*

Supplement Agreement dated March 23, 2020 (previously filed as Exhibit 10.1 to Main Street Capital Corporation’s Current Report on Form 8-K filed on March 24, 2020 (File No. 1-33723))

10.9*

First Amendment to Third Amended and Restated Credit Agreement dated May 28, 2020 (previously filed as Exhibit 10.1 to Main Street Capital Corporation’s Quarterly Report on Form 10-Q filed on August 7, 2020 (File No. 1-33723))

10.10*

Supplement Agreement dated November 4, 2020 (previously filed as Exhibit 10.2 to Main Street Capital Corporation’s Quarterly Report on Form 10-Q filed on November 6, 2020 (File No. 1-33723))

184


Table of Contents

Exhibit
Number


Description

10.11*†

Main Street Capital Corporation 2015 Equity and Incentive Plan (previously filed as Exhibit 4.4 to Main Street Capital Corporation’s Registration Statement on Form S-8 filed on May 5, 2015 (Reg. No. 333-203893))

10.12*†

Main Street Capital Corporation 2015 Non-Employee Director Restricted Stock Plan (previously filed as Exhibit 4.5 to Main Street Capital Corporation’s Registration Statement on Form S-8 filed on May 5, 2015 (Reg. No. 333-203893))

10.13*†

Form of Restricted Stock Agreement for Executive Officers — Main Street Capital Corporation 2015 Equity and Incentive Plan (previously filed as Exhibit 4.6 to Main Street Capital Corporation’s Registration Statement on Form S-8 filed on May 5, 2015 (Reg. No. 333-203893))

10.14*†

Form of Restricted Stock Agreement for Non-Employee Directors — Main Street Capital Corporation 2015 Non-Employee Director Restricted Stock Plan (previously filed as Exhibit 4.7 to Main Street Capital Corporation’s Registration Statement on Form S-8 filed on May 5, 2015 (Reg. No. 333-203893))

10.15*

Custodian Agreement (previously filed as Exhibit (j) to Main Street Capital Corporation’s Pre-Effective Amendment No. 3 to the Registration Statement on Form N-2 filed on September 21, 2007 (Reg. No. 333-142879))

10.16*†

Form of Confidentiality and Non-Compete Agreement by and between Main Street Capital Corporation and Vincent D. Foster (previously filed as Exhibit (k)(12) to Main Street Capital Corporation’s Pre-Effective Amendment No. 3 to the Registration Statement on Form N-2 filed on September 21, 2007 (Reg. No. 333-142879))

10.17*†

Form of Indemnification Agreement by and between Main Street Capital Corporation and each executive officer and director (previously filed as Exhibit (k)(13) to Main Street Capital Corporation’s Pre-Effective Amendment No. 3 to the Registration Statement on Form N-2 filed on September 21, 2007 (Reg. No. 333-142879))

10.18*

Investment Advisory and Administrative Services Agreement dated October 30, 2020 by and among MSC Adviser I, LLC and MSC Income Fund, Inc. (previously filed as Exhibit 10.1 to Main Street Capital Corporation’s Current Report on Form 8-K filed on November 3, 2020 (File No. 1-33723))

10.19*†

Main Street Capital Corporation Deferred Compensation Plan Adoption Agreement and Plan Document (previously filed as Exhibit 4.1 to Main Street Capital Corporation’s Registration Statement on Form S-8 filed on December 18, 2015 (File No. 333-208643))

10.20*

Form of Equity Distribution Agreement dated May 16, 2019 (previously filed as Exhibit 1.1 to Main Street Capital Corporation’s Current Report on Form 8-K filed on May 16, 2019 (File No. 1-33723))

14.1**

Joint Code of Business Conduct and Ethics

21.1**

List of Subsidiaries

23.1**

Consent of Grant Thornton LLP, independent registered public accounting firm

31.1**

Rule 13a-14(a)/15d-14(a) certification of Chief Executive Officer

31.2**

Rule 13a-14(a)/15d-14(a) certification of Chief Financial Officer

32.1**

Section 1350 certification of Chief Executive Officer

32.2**

Section 1350 certification of Chief Financial Officer


*

Exhibit previously filed with the Securities and Exchange Commission, as indicated, and incorporated herein by reference.

**

Furnished herewith.

Management contract or compensatory plan or arrangement.

185


Table of Contents

SIGNATURES

Pursuant to the requirements of Section 13 or 15(d) of the Securities Exchange Act of 1934, the registrant has duly caused this report to be signed on its behalf by the undersigned, thereunto duly authorized.

MAIN STREET CAPITAL CORPORATION

By:

/s/ DWAYNE L. HYZAK

Dwayne L. Hyzak

Chief Executive Officer and Director

Date: February 26, 2021

Pursuant to the requirements of the Securities Exchange Act of 1934, this report has been signed below by the following persons on behalf of the registrant and in the capacities and on the dates indicated.

Signature


Title


Date

/s/ DWAYNE L. HYZAK

Chief Executive Officer and Director

February 26, 2021

Dwayne L. Hyzak

(principal executive officer)

/s/ VINCENT D. FOSTER

Executive Chairman of the Board of Directors

February 26, 2021

Vincent D. Foster

/s/ BRENT D. SMITH

Chief Financial Officer and Treasurer

February 26, 2021

Brent D. Smith

(principal financial officer)

/s/ LANCE A. PARKER

Vice President, Chief Accounting Officer

February 26, 2021

Lance A. Parker

(principal accounting officer)

/s/ VALERIE L. BANNER

Director

February 26, 2021

Valerie L. Banner

/s/ ARTHUR L. FRENCH

Director

February 26, 2021

Arthur L. French

/s/ J. KEVIN GRIFFIN

Director

February 26, 2021

J. Kevin Griffin

/s/ JOHN E. JACKSON

Director

February 26, 2021

John E. Jackson

/s/ BRIAN E. LANE

Director

February 26, 2021

Brian E. Lane

/s/ KAY MATTHEWS

Director

February 26, 2021

Kay Matthews

186


Table of Contents

Signature


Title


Date

/s/ DUNIA A. SHIVE

Director

February 26, 2021

Dunia A. Shive

/s/ STEPHEN B. SOLCHER

Director

February 26, 2021

Stephen B. Solcher

187