Use these links to rapidly review the document
TABLE OF CONTENTS
Item 8. Consolidated Financial Statements and Supplementary Data
PART IV
UNITED STATES SECURITIES AND EXCHANGE COMMISSION
Washington, D.C. 20549
Form 10-K
| (Mark One) | ||
þ |
ANNUAL REPORT PURSUANT TO SECTION 13 OR 15(d) OF THE SECURITIES EXCHANGE ACT OF 1934 |
|
For the fiscal year ended December 31, 2019 |
||
OR |
||
o |
TRANSITION REPORT PURSUANT TO SECTION 13 OR 15(d) OF THE SECURITIES EXCHANGE ACT OF 1934 |
|
For the transition period from to |
||
Commission File Number: 001-33723
Main Street Capital Corporation
(Exact name of registrant as specified in its charter)
| Maryland (State or other jurisdiction of incorporation or organization) |
41-2230745 (I.R.S. Employer Identification No.) |
|
1300 Post Oak Boulevard, 8th Floor Houston, TX (Address of principal executive offices) |
77056 (Zip Code) |
(713) 350-6000
(Registrant's telephone number, including area code)
Securities registered pursuant to Section 12(b) of the Act:
Title of Each Class
|
Trading Symbol
|
Name of Each Exchange on Which Registered |
||
|---|---|---|---|---|
| Common Stock, par value $0.01 per share | MAIN | New York Stock Exchange |
Securities registered pursuant to Section 12(g) of the Act:
None
Indicate by check mark if the registrant is a well-known seasoned issuer, as defined in Rule 405 of the Securities Act. Yes þ No o
Indicate by check mark if the registrant is not required to file reports pursuant to Section 13 or Section 15(d) of the Act. Yes o No þ
Indicate by check mark whether the registrant (1) has filed all reports required to be filed by Section 13 or 15(d) of the Securities Exchange Act of 1934 during the preceding 12 months (or for such shorter period that the registrant was required to file such reports), and (2) has been subject to such filing requirements for the past 90 days. Yes þ No o
Indicate by check mark whether the registrant has submitted electronically every Interactive Data File required to be submitted pursuant to Rule 405 of Regulation S-T during the preceding 12 months (or for such shorter period that the registrant was required to submit such files). Yes o No o
Indicate by check mark whether the registrant is a large accelerated filer, an accelerated filer, a non-accelerated filer or a smaller reporting company or an emerging growth company. See the definitions of "large accelerated filer," "accelerated filer," "smaller reporting company" and "emerging growth company" in Rule 12b-2 of the Exchange Act.
| Large accelerated filer þ | Accelerated filer o | Non-accelerated filer o |
Smaller reporting company o Emerging growth company o |
If an emerging growth company, indicate by check mark if the registrant has elected not to use the extended transition period for complying with any new or revised financial accounting standards provided pursuant to Section 13(a) of the Exchange Act. o
Indicate by check mark whether the registrant is a shell company (as defined in Rule 12b-2 of the Exchange Act). Yes o No þ
The aggregate market value of the registrant's common stock held by non-affiliates of the registrant as of June 30, 2019, was approximately $2,447.8 million based upon the last sale price for the registrant's common stock on that date.
The number of outstanding common shares of the registrant as of February 26, 2020 was 64,401,340.
DOCUMENTS INCORPORATED BY REFERENCE
Portions of the registrants' definitive Proxy Statement for its 2020 Annual Meeting of Stockholders, to be filed with the Securities and Exchange Commission, are incorporated by reference in this Annual Report on Form 10-K in response to Part III.
CAUTIONARY STATEMENT CONCERNING FORWARD-LOOKING STATEMENTS
This Annual Report on Form 10-K contains forward-looking statements regarding the plans and objectives of management for future operations. Any such forward-looking statements may involve known and unknown risks, uncertainties and other factors which may cause our actual results, performance or achievements to be materially different from future results, performance or achievements expressed or implied by any forward-looking statements. Forward-looking statements, which involve assumptions and describe our future plans, strategies and expectations, are generally identifiable by use of the words "may," "will," "should," "expect," "anticipate," "estimate," "believe," "intend" or "project" or the negative of these words or other variations on these words or comparable terminology. These forward-looking statements are based on assumptions that may be incorrect, and we cannot assure you that the projections included in these forward-looking statements will come to pass. Our actual results could differ materially from those expressed or implied by the forward-looking statements as a result of various factors, including the factors discussed in Item 1A entitled "Risk Factors" in Part I of this Annual Report on Form 10-K and elsewhere in this Annual Report on Form 10-K. Other factors that could cause actual results to differ materially include changes in the economy and future changes in laws or regulations and conditions in our operating areas.
We have based the forward-looking statements included in this Annual Report on Form 10-K on information available to us on the date of this Annual Report on Form 10-K, and we assume no obligation to update any such forward-looking statements, unless we are required to do so by applicable law. However, you are advised to refer to any additional disclosures that we may make directly to you or through reports that we in the future may file with the Securities and Exchange Commission ("SEC"), including subsequent annual reports on Form 10-K, quarterly reports on Form 10-Q and current reports on Form 8-K.
ORGANIZATION
Main Street Capital Corporation ("MSCC") is a principal investment firm primarily focused on providing customized debt and equity financing to lower middle market ("LMM") companies and debt capital to middle market ("Middle Market") companies. The portfolio investments of MSCC and its consolidated subsidiaries are typically made to support management buyouts, recapitalizations, growth financings, refinancings and acquisitions of companies that operate in a variety of industry sectors. MSCC seeks to partner with entrepreneurs, business owners and management teams and generally provides "one stop" financing alternatives within its LMM portfolio. MSCC and its consolidated subsidiaries invest primarily in secured debt investments, equity investments, warrants and other securities of LMM companies based in the United States and in secured debt investments of Middle Market companies generally headquartered in the United States.
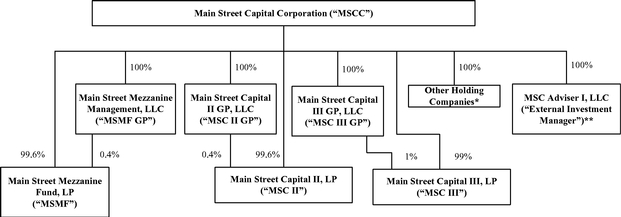
MSCC was formed in March 2007 to operate as an internally managed business development company ("BDC") under the Investment Company Act of 1940, as amended (the "1940 Act"). MSCC wholly owns several investment funds, including Main Street Mezzanine Fund, LP ("MSMF"), Main Street Capital II, LP ("MSC II") and Main Street Capital III, LP ("MSC III" and, collectively with MSMF and MSC II, the "Funds"), and each of their general partners. The Funds are each licensed as a Small Business Investment Company ("SBIC") by the United States Small Business Administration ("SBA"). Because MSCC is internally managed, all of the executive officers and other employees are employed by MSCC. Therefore, MSCC does not pay any external investment advisory fees, but instead directly incurs the operating costs associated with employing investment and portfolio management professionals.
MSC Adviser I, LLC (the "External Investment Manager") was formed in November 2013 as a wholly owned subsidiary of MSCC to provide investment management and other services to parties other than MSCC and its subsidiaries or their portfolio companies ("External Parties") and receives fee income for such services. MSCC has been granted no-action relief by the SEC to allow the External Investment Manager to
1
register as a registered investment adviser under the Investment Advisers Act of 1940, as amended (the "Advisers Act"). Since the External Investment Manager conducts all of its investment management activities for External Parties, it is accounted for as a portfolio investment of MSCC and is not included as a consolidated subsidiary of MSCC in MSCC's consolidated financial statements.
MSCC has elected to be treated for U.S. federal income tax purposes as a regulated investment company ("RIC") under Subchapter M of the Internal Revenue Code of 1986, as amended (the "Code"). As a result, MSCC generally will not pay corporate-level U.S. federal income taxes on any net ordinary taxable income or capital gains that it distributes to its stockholders.
MSCC has certain direct and indirect wholly owned subsidiaries that have elected to be taxable entities (the "Taxable Subsidiaries"). The primary purpose of the Taxable Subsidiaries is to permit MSCC to hold equity investments in portfolio companies which are "pass-through" entities for tax purposes.
Unless otherwise noted or the context otherwise indicates, the terms "we," "us," "our," the "Company" and "Main Street" refer to MSCC and its consolidated subsidiaries, which include the Funds and the Taxable Subsidiaries.
The following diagram depicts our organizational structure:
CORPORATE INFORMATION
Our principal executive offices are located at 1300 Post Oak Boulevard, 8th Floor, Houston, Texas 77056. We maintain a Web site on the Internet at www.mainstcapital.com. We make available free of charge on our Web site our annual reports on Form 10-K, quarterly reports on Form 10-Q, current reports on Form 8-K, and all amendments to those reports as soon as reasonably practicable after such material is electronically filed with or furnished to the SEC. Information contained on our Web site is not incorporated by reference into this Annual Report on Form 10-K, and you should not consider that information to be part of this Annual Report on Form 10-K. Our annual reports on Form 10-K, quarterly reports on Form 10-Q, current reports on Form 8-K, and all amendments to those reports and other public filings are also available free of charge on the EDGAR Database on the SEC's Web site at www.sec.gov.
OVERVIEW OF OUR BUSINESS
Our principal investment objective is to maximize our portfolio's total return by generating current income from our debt investments and capital appreciation from our equity and equity-related investments,
2
including warrants, convertible securities and other rights to acquire equity securities in a portfolio company. Our LMM companies generally have annual revenues between $10 million and $150 million, and our LMM portfolio investments generally range in size from $5 million to $50 million. Our Middle Market investments are made in businesses that are generally larger in size than our LMM portfolio companies, with annual revenues typically between $150 million and $1.5 billion, and our Middle Market investments generally range in size from $3 million to $20 million. Our private loan ("Private Loan") portfolio investments are primarily debt securities in privately held companies which have been originated through strategic relationships with other investment funds on a collaborative basis. Private Loan investments are typically similar in size, structure, terms and conditions to investments we hold in our LMM portfolio and Middle Market portfolio.
We seek to fill the financing gap for LMM businesses, which, historically, have had limited access to financing from commercial banks and other traditional sources. The underserved nature of the LMM creates the opportunity for us to meet the financing needs of LMM companies while also negotiating favorable transaction terms and equity participations. Our ability to invest across a company's capital structure, from secured loans to equity securities, allows us to offer portfolio companies a comprehensive suite of financing options, or a "one stop" financing solution. Providing customized, "one stop" financing solutions is important to LMM portfolio companies. We generally seek to partner directly with entrepreneurs, management teams and business owners in making our investments. Our LMM portfolio debt investments are generally secured by a first lien on the assets of the portfolio company and typically have a term of between five and seven years from the original investment date.
Our Middle Market portfolio investments primarily consist of direct investments in or secondary purchases of interest-bearing debt securities in privately held companies that are generally larger in size than the companies included in our LMM portfolio. Our Middle Market portfolio debt investments are generally secured by either a first or second priority lien on the assets of the portfolio company and typically have an expected duration of between three and seven years from the original investment date.
Our Private Loan portfolio investments are primarily debt securities in privately held companies which have been originated through strategic relationships with other investment funds on a collaborative basis, and are often referred to in the debt markets as "club deals." Private Loan investments are typically similar in size, structure, terms and conditions to investments we hold in our LMM portfolio and Middle Market portfolio. Our Private Loan portfolio debt investments are generally secured by either a first or second priority lien on the assets of the portfolio company and typically have a term of between three and seven years from the original investment date.
Our other portfolio ("Other Portfolio") investments primarily consist of investments which are not consistent with the typical profiles for our LMM, Middle Market or Private Loan portfolio investments, including investments which may be managed by third parties. In our Other Portfolio, we may incur indirect fees and expenses in connection with investments managed by third parties, such as investments in other investment companies or private funds.
Our external asset management business is conducted through the External Investment Manager. The External Investment Manager earns management fees based on the assets of the funds under management and may earn incentive fees, or a carried interest, based on the performance of the funds managed. We have entered into an agreement with the External Investment Manager to share employees in connection with its asset management business generally, and specifically for its relationship with HMS Income Fund, Inc. ("HMS Income"). Through this agreement, we share employees with the External Investment Manager, including their related infrastructure, business relationships, management expertise and capital raising capabilities.
Our portfolio investments are generally made through MSCC and the Funds. MSCC and the Funds share the same investment strategies and criteria, although they are subject to different regulatory regimes (see "Regulation"). An investor's return in MSCC will depend, in part, on the Funds' investment returns as they are wholly owned subsidiaries of MSCC.
3
The level of new portfolio investment activity will fluctuate from period to period based upon our view of the current economic fundamentals, our ability to identify new investment opportunities that meet our investment criteria, and our ability to consummate the identified opportunities. The level of new investment activity, and associated interest and fee income, will directly impact future investment income. In addition, the level of dividends paid by portfolio companies and the portion of our portfolio debt investments on non-accrual status will directly impact future investment income. While we intend to grow our portfolio and our investment income over the long term, our growth and our operating results may be more limited during depressed economic periods. However, we intend to appropriately manage our cost structure and liquidity position based on applicable economic conditions and our investment outlook. The level of realized gains or losses and unrealized appreciation or depreciation on our investments will also fluctuate depending upon portfolio activity, economic conditions and the performance of our individual portfolio companies. The changes in realized gains and losses and unrealized appreciation or depreciation could have a material impact on our operating results.
Because we are internally managed, we do not pay any external investment advisory fees, but instead directly incur the operating costs associated with employing investment and portfolio management professionals. We believe that our internally managed structure provides us with a beneficial operating expense structure when compared to other publicly traded and privately held investment firms which are externally managed, and our internally managed structure allows us the opportunity to leverage our non-interest operating expenses as we grow our Investment Portfolio (as defined below).
During May 2012, we entered into an investment sub-advisory agreement with HMS Adviser, LP ("HMS Adviser"), which is the investment advisor to HMS Income, a non-listed BDC, to provide certain investment advisory services to HMS Adviser. In December 2013, after obtaining required no-action relief from the SEC to allow us to own a registered investment adviser, we assigned the sub-advisory agreement to the External Investment Manager since the fees received from such arrangement could otherwise have negative consequences on our ability to meet the source-of-income requirement necessary for us to maintain our RIC tax treatment. Under the investment sub-advisory agreement, the External Investment Manager is entitled to 50% of the base management fee and the incentive fees earned by HMS Adviser under its advisory agreement with HMS Income.
During April 2014, we received an exemptive order from the SEC permitting co-investments by us and HMS Income in certain negotiated transactions where co-investing would otherwise be prohibited under the 1940 Act. We have made, and in the future intend to continue to make, such co-investments with HMS Income in accordance with the conditions of the order. The order requires, among other things, that we and the External Investment Manager consider whether each such investment opportunity is appropriate for HMS Income and, if it is appropriate, to propose an allocation of the investment opportunity between us and HMS Income. Because the External Investment Manager may receive performance-based fee compensation from HMS Income, this may provide it an incentive to allocate opportunities to HMS Income instead of us. However, both we and the External Investment Manager have policies and procedures in place to manage this conflict.
RECENT DEVELOPMENTS
During February 2020, we declared regular monthly dividends of $0.205 per share for each month of April, May and June 2020. These regular monthly dividends equal a total of $0.615 per share for the second quarter of 2020 and represent a 2.5% increase from the dividends declared for the second quarter of 2019. Including the dividends declared for the second quarter of 2020, we will have paid $28.370 per share in cumulative dividends since our October 2007 initial public offering.
BUSINESS STRATEGIES
Our principal investment objective is to maximize our portfolio's total return by generating current income from our debt investments and capital appreciation from our equity and equity-related investments,
4
including warrants, convertible securities and other rights to acquire equity securities in a portfolio company. We have adopted the following business strategies to achieve our investment objective:
INVESTMENT CRITERIA
Our investment team has identified the following investment criteria that it believes are important in evaluating prospective portfolio companies. Our investment team uses these criteria in evaluating investment
5
opportunities. However, not all of these criteria have been, or will be, met in connection with each of our investments:
INVESTMENT PORTFOLIO
The Investment Portfolio, as used herein, refers to all of our investments in LMM portfolio companies, investments in Middle Market portfolio companies, Private Loan portfolio investments, Other Portfolio investments, and our investment in the External Investment Manager. Our LMM portfolio investments primarily consist of secured debt, equity warrants and direct equity investments in privately held, LMM companies based in the United States. Our Middle Market portfolio investments primarily consist of direct investments in or secondary purchases of interest-bearing debt securities in privately held companies based in the United States that are generally larger in size than the companies included in our LMM portfolio. Our Private Loan portfolio investments primarily consist of investments in interest-bearing debt securities in companies that are consistent with the size of companies in our LMM portfolio or our Middle Market portfolio, but are investments that we originate on a collaborative basis with other investment funds, and are often referred to in the debt markets as "club deals." Our Other Portfolio investments primarily consist of investments that are not consistent with the typical profiles for our LMM, Middle Market and Private Loan portfolio investments, including investments which may be managed by third parties. In our Other Portfolio, we may incur indirect fees and expenses in connection with investments managed by third parties, such as investments in other investment companies or private funds.
Debt Investments
Historically, we have made LMM debt investments principally in the form of single tranche debt. Single tranche debt financing involves issuing one debt security that blends the risk and return profiles of both first lien secured and subordinated debt. We believe that single tranche debt is more appropriate for many LMM companies given their size in order to reduce structural complexity and potential conflicts among creditors.
Our LMM debt investments generally have a term of five to seven years from the original investment date, with limited required amortization prior to maturity, and provide for monthly or quarterly payment of
6
interest at interest rates generally between 10% and 14% per annum, payable currently in cash. Interest rate terms can include either fixed or floating rate terms. In addition, certain LMM debt investments may have a form of interest that is not paid currently but is accrued and added to the loan balance and paid at maturity. We refer to this form of interest as payment-in-kind, or PIK, interest. We typically structure our LMM debt investments with the maximum seniority and collateral that we can reasonably obtain while seeking to achieve our total return target. In most cases, our LMM debt investment will be collateralized by a first priority lien on substantially all the assets of the portfolio company. In addition to seeking a senior lien position in the capital structure of our LMM portfolio companies, we seek to limit the downside potential of our LMM debt investments by negotiating covenants that are designed to protect our LMM debt investments while affording our portfolio companies as much flexibility in managing their businesses as is reasonable. Such restrictions may include affirmative and negative covenants, default penalties, lien protection, change of control or change of management provisions, key-man life insurance, guarantees, equity pledges, personal guaranties, where appropriate, and put rights. In addition, we typically seek board representation or observation rights in all of our LMM portfolio companies. Interest rate terms can include either fixed or floating rate terms.
While we will continue to focus our LMM debt investments primarily on single tranche debt investments, we also anticipate structuring some of our debt investments as mezzanine loans. We expect that these mezzanine loans will be primarily junior secured or unsecured, subordinated loans that provide for relatively high interest rates, payable currently in cash, and will provide us with significant interest income. We also anticipate that these mezzanine loans will afford us the additional opportunity for income and gains through PIK interest and equity warrants and other similar equity instruments issued in conjunction with these mezzanine loans. These loans typically will have interest-only payments in the early years, with amortization of principal deferred to the later years of the mezzanine loan term. Typically, our mezzanine loans will have maturities of three to five years. We will generally target interest rates of 12% to 14%, payable currently in cash, for our mezzanine loan investments with higher targeted total returns from equity warrants or PIK interest.
We also pursue debt investments in Middle Market companies. Our Middle Market portfolio investments primarily consist of direct investments or secondary purchases of interest-bearing debt securities in privately held companies based in the United States that are generally larger in size than the companies included in our LMM portfolio. Our Middle Market portfolio debt investments are generally secured by either a first or second priority lien on the assets of the portfolio company and typically have a term of between three and seven years from the original investment date. The debt investments in our Middle Market portfolio have rights and protections that are similar to those in our LMM debt investments, which may include affirmative and negative covenants, default penalties, lien protection, change of control provisions, guarantees and equity pledges. The Middle Market debt investments generally have floating interest rates at the London Interbank Offered Rate ("LIBOR") plus a margin, and are typically subject to LIBOR floors.
Our Private Loan portfolio investments primarily consist of investments in interest-bearing debt securities in companies that are consistent with the size of companies in our LMM portfolio or our Middle Market portfolio, but are investments which have been originated through strategic relationships with other investment funds on a collaborative basis. Our Private Loan portfolio debt investments are generally secured by either a first or second priority lien and typically have a term of between three and seven years from the original investment date.
Warrants
In connection with our debt investments, we occasionally receive equity warrants to establish or increase our equity interest in the portfolio company. Warrants we receive in connection with a debt investment typically require only a nominal cost to exercise, and thus, as a portfolio company appreciates in value, we may achieve additional investment return from this equity interest. We typically structure the warrants to provide provisions protecting our rights as a minority-interest holder, as well as secured or unsecured put rights, or rights to sell such securities back to the portfolio company, upon the occurrence of specified events.
7
In certain cases, we also may obtain registration rights in connection with these equity interests, which may include demand and "piggyback" registration rights.
Direct Equity Investments
We also will seek to make direct equity investments in situations where it is appropriate to align our interests with key management and stockholders of our LMM portfolio companies, and to allow for participation in the appreciation in the equity values of our LMM portfolio companies. We usually make our direct equity investments in connection with debt investments in our LMM portfolio companies. In addition, we may have both equity warrants and direct equity positions in some of our LMM portfolio companies. We seek to maintain fully diluted equity positions in our LMM portfolio companies of 5% to 50%, and may have controlling equity interests in some instances. We have a value orientation toward our direct equity investments and have traditionally been able to purchase our equity investments at reasonable valuations.
INVESTMENT PROCESS
Our management team's investment committee is responsible for all aspects of our investment processes. The current members of our investment committee are Dwayne L. Hyzak, our Chief Executive Officer, David Magdol, our President and Chief Investment Officer, and Vincent D. Foster, our Executive Chairman.
The investment processes for LMM and Middle Market portfolio investments are outlined below. The investment processes for Private Loan portfolio investments, from origination to close and to eventual exit, follow the processes for our LMM portfolio investments or our Middle Market portfolio investments as outlined below, or a combination thereof. Our investment strategy involves a "team" approach, whereby potential transactions are screened by several members of our investment team before being presented to the investment committee. Our investment committee meets on an as-needed basis depending on transaction volume. We generally categorize our investment process into seven distinct stages:
Deal Generation/Origination
Deal generation and origination is maximized through long-standing and extensive relationships with industry contacts, brokers, commercial and investment bankers, entrepreneurs, service providers such as lawyers, financial advisors and accountants, and current and former portfolio companies and investors. Our investment team has focused its deal generation and origination efforts on LMM and Middle Market companies, and we have developed a reputation as a knowledgeable, reliable and active source of capital and assistance in these markets.
Screening
During the screening process, if a transaction initially meets our investment criteria, we will perform preliminary due diligence, taking into consideration some or all of the following information:
Upon successful screening of a proposed LMM transaction, the investment team makes a recommendation to our investment committee. If our investment committee concurs with moving forward on the proposed LMM transaction, we typically issue a non-binding term sheet to the company. For Middle
8
Market portfolio investments, the initial term sheet is typically issued by the borrower, through the syndicating bank, and is screened by the investment team which makes a recommendation to our investment committee.
Term Sheet
For proposed LMM transactions, the non-binding term sheet will include the key economic terms based upon our analysis performed during the screening process, as well as a proposed timeline and our qualitative expectation for the transaction. While the term sheet for LMM investments is non-binding, we typically receive an expense deposit in order to move the transaction to the due diligence phase. Upon execution of a term sheet, we begin our formal due diligence process.
For proposed Middle Market transactions, the initial term sheet will include key economic terms and other conditions proposed by the borrower and its representatives and the proposed timeline for the investment, which are reviewed by our investment team to determine if such terms and conditions are in agreement with our investment objectives.
Due Diligence
Due diligence on a proposed LMM investment is performed by a minimum of three of our investment professionals, whom we refer to collectively as the investment team, and certain external resources, who together conduct due diligence to understand the relationships among the prospective portfolio company's business plan, operations and financial performance. Our LMM due diligence review includes some or all of the following:
Due diligence on a proposed Middle Market investment is generally performed on materials and information obtained from certain external resources and assessed internally by a minimum of two of our investment professionals, who work to understand the relationships among the prospective portfolio company's business plan, operations and financial performance using the accumulated due diligence information. Our Middle Market due diligence review includes some or all of the following:
During the due diligence process, significant attention is given to sensitivity analyses and how the company might be expected to perform given downside, base-case and upside scenarios. In certain cases, we may decide not to make an investment based on the results of the diligence process.
9
Document and Close
Upon completion of a satisfactory due diligence review of a proposed LMM portfolio investment, the investment team presents the findings and a recommendation to our investment committee. The presentation contains information which can include, but is not limited to, the following:
Upon completion of a satisfactory due diligence review of a proposed Middle Market portfolio investment, the investment team presents the findings and a recommendation to our investment committee. The presentation contains information which can include, but is not limited to, the following:
If any adjustments to the transaction terms or structures are proposed by the investment committee, such changes are made and applicable analyses are updated prior to approval of the transaction. Approval for the transaction must be made by the affirmative vote from a majority of the members of the investment committee, with the committee member managing the transaction, if any, abstaining from the vote. Upon receipt of transaction approval, the investment team will re-confirm regulatory compliance, process and finalize all required legal documents, and fund the investment.
10
Post-Investment
We continuously monitor the status and progress of the portfolio companies. We generally offer managerial assistance to our portfolio companies, giving them access to our investment experience, direct industry expertise and contacts. The same investment team that was involved in the investment process will continue its involvement in the portfolio company post-investment. This provides for continuity of knowledge and allows the investment team to maintain a strong business relationship with key management of our portfolio companies for post-investment assistance and monitoring purposes.
As part of the monitoring process of LMM portfolio investments, the investment team will analyze monthly and quarterly financial statements versus the previous periods and year, review financial projections, meet and discuss issues or opportunities with management, attend board meetings and review all compliance certificates and covenants. While we maintain limited involvement in the ordinary course operations of our LMM portfolio companies, we maintain a higher level of involvement in non-ordinary course financing or strategic activities and any non-performing scenarios. We also monitor the performance of our Middle Market portfolio investments; however, due to the larger size and higher sophistication level of these Middle Market companies in comparison to our LMM portfolio companies, it is not necessary or practical to have as much direct management interface.
We utilize an internally developed investment rating system to rate the performance of each LMM portfolio company and to monitor our expected level of returns on each of our LMM investments in relation to our expectations for the portfolio company. The investment rating system takes into consideration various factors, including, but not limited to, each investment's expected level of returns, the collectability of our debt investments and the ability to receive a return of the invested capital in our equity investments, comparisons to competitors and other industry participants, the portfolio company's future outlook and other factors that are deemed to be significant to the portfolio company.
Exit Strategies/Refinancing
While we generally exit most investments through the refinancing or repayment of our debt and redemption or sale of our equity positions, we typically assist our LMM portfolio companies in developing and planning exit opportunities, including any sale or merger of our portfolio companies. We may also assist in the structure, timing, execution and transition of the exit strategy. The refinancing or repayment of Middle Market debt investments typically does not require our assistance due to the additional resources available to these larger, Middle Market companies.
DETERMINATION OF NET ASSET VALUE AND INVESTMENT PORTFOLIO VALUATION PROCESS
We determine the net asset value per share of our common stock on a quarterly basis. The net asset value per share is equal to our total assets minus total liabilities divided by the total number of shares of common stock outstanding.
We are required to report our investments at fair value. As a result, the most significant determination inherent in the preparation of our consolidated financial statements is the valuation of our Investment Portfolio and the related amounts of unrealized appreciation and depreciation. We follow the provisions of the Financial Accounting Standards Board Accounting Standards Codification ("ASC") 820, Fair Value Measurements and Disclosures ("ASC 820"). ASC 820 defines fair value, establishes a framework for measuring fair value, establishes a fair value hierarchy based on the quality of inputs used to measure fair value and enhances disclosure requirements for fair value measurements. ASC 820 requires us to assume that the portfolio investment is to be sold in the principal market to independent market participants, which may be a hypothetical market. Market participants are defined as buyers and sellers in the principal market that are independent, knowledgeable and willing and able to transact.
11
We determine in good faith the fair value of our Investment Portfolio pursuant to a valuation policy in accordance with ASC 820 and a valuation process approved by our Board of Directors and in accordance with the 1940 Act. Our valuation policies and processes are intended to provide a consistent basis for determining the fair value of our Investment Portfolio. See "Note B.1. — Valuation of the Investment Portfolio" in the notes to consolidated financial statements for a detailed discussion of our investment portfolio valuation process and procedures.
Due to the inherent uncertainty in the valuation process, our determination of fair value for our Investment Portfolio may differ materially from the values that would have been determined had a ready market for the securities existed. In addition, changes in the market environment, portfolio company performance and other events that may occur over the lives of the investments may cause the gains or losses ultimately realized on these investments to be materially different than the valuations currently assigned. We determine the fair value of each individual investment and record changes in fair value as unrealized appreciation or depreciation.
As described below, we undertake a multi-step valuation process each quarter in connection with determining the fair value of our investments, with our Board of Directors having final responsibility for overseeing, reviewing and approving, in good faith, our determination of the fair value for our Investment Portfolio and our valuation procedures, consistent with 1940 Act requirements. In addition, the Audit Committee of our Board of Directors periodically evaluates the performance and methodologies of the financial advisory services firm that we consult in connection with valuing our LMM and Private Loan portfolio company investments.
Determination of fair value involves subjective judgments and estimates. The notes to our consolidated financial statements refer to the uncertainty with respect to the possible effect of such valuations, and any change in such valuations, on our financial results and financial condition.
COMPETITION
We compete for investments with a number of investment funds (including private equity funds, mezzanine funds, BDCs, and SBICs), as well as traditional financial services companies such as commercial banks and other sources of financing. Many of the entities that compete with us are larger and have more resources available to them. We believe we are able to be competitive with these entities primarily on the basis of our focus toward the underserved LMM, the experience and contacts of our management team, our
12
responsive and efficient investment analysis and decision-making processes, our comprehensive suite of customized financing solutions and the investment terms we offer.
We believe that some of our competitors make senior secured loans, junior secured loans and subordinated debt investments with interest rates and returns that are comparable to or lower than the rates and returns that we target. Therefore, we do not seek to compete primarily on the interest rates and returns that we offer to potential portfolio companies. For additional information concerning the competitive risks we face, see "Risk Factors — Risks Relating to Our Business and Structure — We may face increasing competition for investment opportunities."
EMPLOYEES
As of December 31, 2019, we had 71 employees. These employees include investment and portfolio management professionals, operations professionals and administrative staff. As necessary, we will hire additional investment professionals and administrative personnel. All of our employees are located in our Houston, Texas office.
REGULATION
Regulation as a Business Development Company
We have elected to be regulated as a BDC under the 1940 Act. The 1940 Act contains prohibitions and restrictions relating to transactions between BDCs and their affiliates, principal underwriters and affiliates of those affiliates or underwriters. The 1940 Act requires that a majority of the members of the board of directors of a BDC be persons other than "interested persons," as that term is defined in the 1940 Act. In addition, the 1940 Act provides that we may not change the nature of our business so as to cease to be, or to withdraw our election as, a BDC unless approved by a majority of our outstanding voting securities.
The 1940 Act defines "a majority of the outstanding voting securities" as the lesser of (i) 67% or more of the voting securities present at a meeting if the holders of more than 50% of our outstanding voting securities are present or represented by proxy or (ii) more than 50% of our outstanding voting securities.
Qualifying Assets
Under the 1940 Act, a BDC may not acquire any asset other than assets of the type listed in Section 55(a) of the 1940 Act, which are referred to as qualifying assets, unless, at the time the acquisition is made, qualifying assets represent at least 70% of the company's total assets. The principal categories of qualifying assets relevant to our business are any of the following:
13
In addition, a BDC must have been organized and have its principal place of business in the United States and must be operated for the purpose of making investments in the types of securities described in (1), (2) or (3) above.
An eligible portfolio company is defined in the 1940 Act as any issuer which:
Managerial Assistance to Portfolio Companies
As noted above, a BDC must be operated for the purpose of making investments in the type of securities described in (1), (2) or (3) above under the heading entitled "— Qualifying Assets." In addition, BDCs must generally offer to make available to such issuer of the securities (other than small and solvent companies described above) significant managerial assistance; except that, where we purchase such securities in conjunction with one or more other persons acting together, one of the other persons in the group may make available such managerial assistance. Making available managerial assistance means, among other things, any arrangement whereby the BDC, through its directors, officers or employees, offers to provide, and, if accepted, does so provide, significant guidance and counsel concerning the management, operations or business objectives and policies of a portfolio company.
Temporary Investments
Pending investment in "qualifying assets," as described above, our investments may consist of cash, cash equivalents, U.S. government securities and high-quality debt securities maturing in one year or less from time of investment therein, so that 70% of our assets are qualifying assets.
Senior Securities
Under the provisions of the 1940 Act, we are permitted, as a BDC, to issue senior securities only in amounts such that our asset coverage, as defined in the 1940 Act, equals at least 200% of all debt and/or senior stock immediately after each such issuance. However, 2018 legislation modified the 1940 Act by allowing a BDC to increase the maximum amount of leverage it may incur from an asset coverage ratio of 200% to an asset coverage ratio of 150%, if certain requirements are met. We are permitted to increase our leverage capacity if stockholders representing at least a majority of the votes cast, when quorum is met, approve a proposal to do so. If we receive such stockholder approval, we would be permitted to increase our leverage capacity on the first day after such approval. Alternatively, we may increase the maximum amount of
14
leverage we may incur to an asset coverage ratio of 150% if the "required majority" of our independent directors as defined in Section 57(o) of the 1940 Act approve such increase with such approval becoming effective after one year. In either case, we would be required to make certain disclosures on our website and in SEC filings regarding, among other things, the receipt of approval to increase our leverage, our leverage capacity and usage, and risks related to leverage. In addition, while any senior securities remain outstanding (other than senior securities representing indebtedness issued in consideration of a privately arranged loan which is not intended to be publicly distributed), we must make provisions to prohibit any distribution to our stockholders or the repurchase of such securities or shares unless we meet the applicable asset coverage ratios at the time of the distribution or repurchase. We may also borrow amounts up to 5% of the value of our total assets for temporary or emergency purposes without regard to asset coverage. For a discussion of the risks associated with leverage, see "Risk Factors — Risks Relating to Our Business and Structure," including, without limitation, "— Because we borrow money, the potential for gain or loss on amounts invested in us is magnified and may increase the risk of investing in us."
We have previously received an exemptive order from the SEC to exclude debt securities issued by MSMF and any other wholly owned subsidiaries of ours which operate as SBICs from the asset coverage requirements of the 1940 Act as applicable to Main Street. The exemptive order provides for the exclusion of all debt securities issued by the Funds, including the $311.8 million of outstanding debt as of December 31, 2019, issued pursuant to the SBIC program. This exemptive order provides us with expanded capacity and flexibility in obtaining future sources of capital for our investment and operational objectives.
Common Stock
We are not generally able to issue and sell our common stock at a price below net asset value per share. We may, however, sell our common stock, warrants, options or rights to acquire our common stock, at a price below the current net asset value of the common stock if our Board of Directors determines that such sale is in our best interests and that of our stockholders, and our stockholders approve such sale. In any such case, the price at which our securities are to be issued and sold may not be less than a price which, in the determination of our Board of Directors, closely approximates the market value of such securities (less any distributing commission or discount). We did not seek stockholder authorization to sell shares of our common stock below the then current net asset value per share of our common stock at our 2019 annual meeting of stockholders because our common stock price had been trading significantly above the net asset value per share of our common stock since 2011. Our stockholders have previously approved a proposal that authorizes us to issue securities to subscribe to, convert to, or purchase shares of our common stock in one or more offerings. We may also make rights offerings to our stockholders at prices per share less than the net asset value per share, subject to applicable requirements of the 1940 Act. See "Risk Factors — Risks Relating to Our Business and Structure — Stockholders may incur dilution if we sell shares of our common stock in one or more offerings at prices below the then current net asset value per share of our common stock or issue securities to subscribe to, convert to or purchase shares of our common stock."
Code of Ethics
We have adopted a code of ethics pursuant to Rule 17j-1 under the 1940 Act that establishes procedures for personal investments and restricts certain personal securities transactions. Personnel subject to the code may invest in securities for their personal investment accounts, including securities that may be purchased or held by us, so long as such investments are made in accordance with the code's requirements. The code of ethics is available on the EDGAR Database on the SEC's Web site at http://www.sec.gov.
Proxy Voting Policies and Procedures
We vote proxies relating to our portfolio securities in a manner in which we believe is consistent with the best interest of our stockholders. We review on a case-by-case basis each proposal submitted to a stockholder vote to determine its impact on the portfolio securities held by us. Although we generally vote against
15
proposals that we expect would have a negative impact on our portfolio securities, we may vote for such a proposal if there exists compelling long-term reasons to do so.
Our proxy voting decisions are made by the investment team which is responsible for monitoring each of our investments. To ensure that our vote is not the product of a conflict of interest, we require that anyone involved in the decision-making process discloses to our chief compliance officer any potential conflict regarding a proxy vote of which he or she is aware.
Stockholders may obtain information, without charge, regarding how we voted proxies with respect to our portfolio securities by making a written request for proxy voting information to: Chief Compliance Officer, 1300 Post Oak Boulevard, 8th Floor, Houston, Texas 77056.
Other 1940 Act Regulations
We are also prohibited under the 1940 Act from knowingly participating in certain transactions with our affiliates without the prior approval of our Board of Directors who are not interested persons and, in some cases, prior approval by the SEC.
We are required to provide and maintain a bond issued by a reputable fidelity insurance company to protect us against larceny and embezzlement. Furthermore, as a BDC, we are prohibited from protecting any director or officer against any liability to us or our stockholders arising from willful misfeasance, bad faith, gross negligence or reckless disregard of the duties involved in the conduct of such person's office.
We are required to adopt and implement written policies and procedures reasonably designed to prevent violation of the federal securities laws, review these policies and procedures no less frequently than annually for their adequacy and the effectiveness of their implementation, and to designate a chief compliance officer to be responsible for administering the policies and procedures.
We may be periodically examined by the SEC for compliance with the 1940 Act.
Small Business Investment Company Regulations
Each of the Funds is licensed by the SBA to operate as a SBIC under Section 301(c) of the Small Business Investment Act of 1958. MSMF obtained its SBIC license in 2002, MSC II obtained its license in 2006 and MSC III obtained its license in 2016.
SBICs are designed to stimulate the flow of private capital to eligible small businesses. Under SBIC regulations, SBICs may make loans to eligible small businesses, invest in the equity securities of such businesses and provide them with consulting and advisory services. Each of the Funds has typically invested in secured debt, acquired warrants and/or made equity investments in qualifying small businesses.
The Funds are subject to regulation and oversight by the SBA, including requirements with respect to reporting financial information, such as the extent of capital impairment if applicable, on a regular basis and annual examinations conducted by the SBA. The SBA, as a creditor, will have a superior claim to the Funds' assets over our securities holders in the event the Funds are liquidated or the SBA exercises its remedies under the SBA-guaranteed debentures issued by the Funds upon an event of default.
We have received exemptive relief from the SEC to permit us to exclude the SBA-guaranteed debentures of the Funds from our 200% asset coverage test under the 1940 Act. As such, our ratio of total consolidated assets to outstanding indebtedness may be less than 200%. This provides us with increased investment flexibility but also increases our risks related to leverage. See "Risk Factors — Risks Relating to Our Business and Structure — Because we borrow money, the potential for gain or loss on amounts invested in us is magnified and may increase the risk of investing in us."
Under present SBIC regulations, eligible small businesses generally include businesses that (together with their affiliates) have a tangible net worth not exceeding $19.5 million or have average annual net income after U.S. federal income taxes not exceeding $6.5 million (average net income to be computed without benefit of
16
any carryover loss) for the two most recent fiscal years. In addition, an SBIC must devote 25% of its investment activity to "smaller" enterprises as defined by the SBA. A smaller enterprise generally includes businesses that have a tangible net worth not exceeding $6 million and have average annual net income after U.S. federal income taxes not exceeding $2 million (average net income to be computed without benefit of any net carryover loss) for the two most recent fiscal years. SBIC regulations also provide alternative size standard criteria to determine eligibility for designation as an eligible small business or smaller enterprise, which criteria depend on the primary industry in which the business is engaged and are based on such factors as the number of employees and gross revenue. However, once an SBIC has invested in a company, it generally may continue to make follow-on investments in the company, regardless of the size of the portfolio company at the time of the follow-on investment, up to the time of the portfolio company's initial public offering.
The SBA prohibits an SBIC from providing funds to small businesses for certain purposes, such as relending and investment outside the United States, to businesses engaged in certain prohibited industries, and to certain "passive" (non-operating) companies. In addition, without prior SBA approval, an SBIC may not invest an amount equal to more than approximately 30% of the SBIC's regulatory capital, as defined by the SBA, in any one portfolio company and its affiliates.
The SBA places certain limitations on the financing terms of investments by SBICs in portfolio companies (such as limiting the permissible interest rate on debt securities held by an SBIC in a portfolio company). Included in such limitations are SBIC regulations which allow an SBIC to exercise control over a small business for a period of seven years from the date on which the SBIC initially acquires its control position. This control period may be extended for an additional period of time with the SBA's prior written approval.
The SBA restricts the ability of an SBIC to lend money to any of its officers, directors and employees or to invest in affiliates thereof. The SBA also prohibits, without prior SBA approval, a "change of control" of an SBIC or transfers that would result in any person (or a group of persons acting in concert) owning 10% or more of a class of equity of a licensed SBIC. A "change of control" is any event which would result in the transfer of the power, direct or indirect, to direct the management and policies of an SBIC, whether through ownership, contractual arrangements or otherwise.
The SBIC licenses allow the Funds to incur leverage by issuing SBA-guaranteed debentures, subject to the issuance of a capital commitment and certain approvals by the SBA and customary procedures. SBA-guaranteed debentures carry long-term fixed rates that are generally lower than rates on comparable bank and other debt. Under applicable regulations, an SBIC may generally have outstanding debentures guaranteed by the SBA in amounts up to twice the amount of the privately raised funds of the SBIC. Debentures guaranteed by the SBA have a maturity of ten years, require semiannual payments of interest, do not require any principal payments prior to maturity, and are not subject to prepayment penalties. As of December 31, 2019, we, through the Funds, had $311.8 million of outstanding SBA-guaranteed debentures, which had an annual weighted-average interest rate of approximately 3.6%.
SBICs must invest idle funds that are not being used to make loans in investments permitted under SBIC regulations in the following limited types of securities: (i) direct obligations of, or obligations guaranteed as to principal and interest by, the United States government, which mature within 15 months from the date of the investment; (ii) repurchase agreements with federally insured institutions with a maturity of seven days or less (and the securities underlying the repurchase obligations must be direct obligations of or guaranteed by the federal government); (iii) certificates of deposit with a maturity of one year or less, issued by a federally insured institution; (iv) a deposit account in a federally insured institution that is subject to a withdrawal restriction of one year or less; (v) a checking account in a federally insured institution; or (vi) a reasonable petty cash fund.
SBICs are periodically examined and audited by the SBA's staff to determine their compliance with SBIC regulations and are periodically required to file certain financial information and other documents with the SBA.
17
Neither the SBA nor the U.S. government or any of its agencies or officers has approved any ownership interest to be issued by us or any obligation that we or any of our subsidiaries may incur.
Securities Exchange Act of 1934 and Sarbanes-Oxley Act Compliance
We are subject to the reporting and disclosure requirements of the Securities Exchange Act of 1934 (the "Exchange Act"), including the filing of quarterly, annual and current reports, proxy statements and other required items. In addition, we are subject to the Sarbanes-Oxley Act of 2002, which imposes a wide variety of regulatory requirements on publicly-held companies and their insiders. For example:
The New York Stock Exchange Corporate Governance Regulations
The New York Stock Exchange ("NYSE") has adopted corporate governance regulations that listed companies must comply with. We believe we are in compliance with such corporate governance listing standards. We intend to monitor our compliance with all future listing standards and to take all necessary actions to ensure that we stay in compliance.
Investment Adviser Regulations
The External Investment Manager, which is wholly owned by us, is subject to regulation under the Advisers Act. The Advisers Act establishes, among other things, recordkeeping and reporting requirements, disclosure requirements, limitations on transactions between the adviser's account and an advisory client's account, limitations on transactions between the accounts of advisory clients, and general anti-fraud prohibitions. The External Investment Manager may be examined by the SEC from time to time for compliance with the Advisers Act.
Taxation as a Regulated Investment Company
MSCC has elected to be treated for U.S. federal income tax purposes as a RIC under Subchapter M of the Code. MSCC's taxable income includes the taxable income generated by MSCC and certain of its subsidiaries, including the Funds, which are treated as disregarded entities for tax purposes. As a RIC, we generally will not pay corporate-level U.S. federal income taxes on any income that we distribute to our stockholders as dividends. To qualify as a RIC, we must, among other things, meet certain source-of-income and asset diversification requirements (as described below). In addition, in order to obtain RIC tax treatment, we must distribute to our stockholders, for each taxable year, at least 90% of our "investment company taxable income," which is generally our net ordinary taxable income plus the excess of realized net short-term capital gains over realized net long-term capital losses, and 90% of our tax-exempt income (the "Annual Distribution Requirement"). As part of maintaining RIC status, undistributed taxable income (subject to a 4% non-deductible U.S. federal excise tax) pertaining to a given fiscal year may be distributed up to 12 months subsequent to the end of that fiscal year, provided such dividends are declared on or prior to the
18
later of (i) filing of the U.S. federal income tax return for the applicable fiscal year or (ii) the fifteenth day of the ninth month following the close of the year in which such taxable income was generated.
For any taxable year in which we qualify as a RIC and satisfy the Annual Distribution Requirement, we will not be subject to U.S. federal income tax on the portion of our income or capital gains we distribute (or are deemed to distribute) to stockholders. We will be subject to U.S. federal income tax at the regular corporate rates on any income or capital gains not distributed (or deemed distributed) to our stockholders.
We are subject to a 4% non-deductible U.S. federal excise tax on certain undistributed income unless we distribute in a timely manner an amount at least equal to the sum of (1) 98% of our net ordinary taxable income for each calendar year, (2) 98.2% of our capital gain net income for the one-year period ending December 31 in that calendar year and (3) any taxable income recognized, but not distributed, in preceding years on which we paid no U.S. federal income tax (the "Excise Tax Avoidance Requirement"). Dividends declared and paid by us in a year will generally differ from taxable income for that year as such dividends may include the distribution of current year taxable income, exclude amounts carried over into the following year, and include the distribution of prior year taxable income carried over into and distributed in the current year. For amounts we carry over into the following year, we will be required to pay the 4% U.S. federal excise tax on the excess of 98% of our annual investment company taxable income and 98.2% of our capital gain net income over our distributions for the year.
In order to qualify as a RIC for U.S. federal income tax purposes, we must, among other things:
In order to comply with the 90% Income Test, we formed the Taxable Subsidiaries as wholly owned taxable subsidiaries for the primary purpose of permitting us to own equity interests in portfolio companies which are "pass-through" entities for tax purposes. Absent the taxable status of the Taxable Subsidiaries, a portion of the gross income from such portfolio companies would flow directly to us for purposes of the 90% Income Test. To the extent such income did not consist of income derived from securities, such as dividends and interest, it could jeopardize our ability to qualify as a RIC and, therefore, cause us to incur significant U.S. federal income taxes. The Taxable Subsidiaries are consolidated with Main Street for generally accepted accounting principles in the United States of America ("U.S. GAAP") purposes and are included in our consolidated financial statements, and the portfolio investments held by the Taxable Subsidiaries are included in our consolidated financial statements. The Taxable Subsidiaries are not consolidated with Main Street for income tax purposes and may generate income tax expense, or benefit, as a result of their ownership of the portfolio investments. The income tax expense, or benefit, if any, and any related tax assets and liabilities, are reflected in our consolidated financial statements.
19
The External Investment Manager is accounted for as a portfolio investment for U.S. GAAP purposes and is an indirect wholly owned subsidiary of MSCC, owned through a Taxable Subsidiary. The External Investment Manager is owned by a Taxable Subsidiary in order to comply with the 90% Income Test, since the External Investment Manager's income would likely not consist of income derived from securities, such as dividends and interest, and as result, it could jeopardize our ability to qualify as a RIC and, therefore, cause us to incur significant U.S. federal income taxes. As a result of its ownership by a Taxable Subsidiary, the External Investment Manager is a disregarded entity for tax purposes. The External Investment Manager has also entered into a tax sharing agreement with its Taxable Subsidiary owner. Since the External Investment Manager is accounted for as a portfolio investment of MSCC and is not included as a consolidated subsidiary of MSCC in MSCC's consolidated financial statements, and as a result of the tax sharing agreement with its Taxable Subsidiary owner, for its stand-alone financial reporting purposes the External Investment Manager is treated as if it is taxed at normal corporate tax rates based on its taxable income and, as a result of its activities, may generate income tax expense or benefit. The income tax expense, or benefit, if any, and the related tax assets and liabilities, of the External Investment Manager are reflected in the External Investment Manager's separate financial statements.
We may be required to recognize taxable income in circumstances in which we do not receive cash. For example, if we hold debt obligations that are treated under applicable tax rules as having original issue discount (such as debt instruments issued with warrants and debt securities invested in at a discount to par), we must include in income each year a portion of the original issue discount that accrues over the life of the obligation, regardless of whether cash representing such income is received by us in the same taxable year. We may also have to include in income other amounts that we have not yet received in cash such as PIK interest, cumulative dividends or amounts that are received in non-cash compensation such as warrants or stock. Because any original issue discount or other amounts accrued will be included in our investment company taxable income for the year of accrual, we may be required to make a distribution to our stockholders in order to satisfy the Annual Distribution Requirement, even though we will not have received any corresponding cash amount.
Although we do not presently expect to do so, we are authorized to borrow funds and to sell assets in order to satisfy distribution requirements. However, under the 1940 Act, we are not permitted to make distributions to our stockholders in certain circumstances while our debt obligations and other senior securities are outstanding unless certain "asset coverage" tests are met. See "Regulation — Regulation as a Business Development Company — Senior Securities." Moreover, our ability to dispose of assets to meet our distribution requirements may be limited by (1) the illiquid nature of our portfolio and/or (2) other requirements relating to our status as a RIC, including the Diversification Tests. If we dispose of assets in order to meet the Annual Distribution Requirement or the Excise Tax Avoidance Requirement, we may make such dispositions at times that, from an investment standpoint, are not advantageous.
We may distribute taxable dividends that are payable in part in our stock. Under certain applicable provisions of the Code and the U.S. Department of the Treasury ("Treasury") regulations, distributions payable by us in cash or in shares of stock (at the stockholders election) would satisfy the Annual Distribution Requirement. The Internal Revenue Service has issued guidance indicating that this rule will apply even where the total amount of cash that may be distributed is limited to no more than 20% of the total distribution. According to this guidance, if too many stockholders elect to receive their distributions in cash, each such stockholder would receive a pro rata share of the total cash to be distributed and would receive the remainder of their distribution in shares of stock. Taxable stockholders receiving such dividends will be required to include the full amount of the dividend (whether received in cash, our stock, or a combination thereof) as (i) ordinary income (including any qualified dividend income that, in the case of a noncorporate stockholder, may be eligible for the same reduced maximum tax rate applicable to long-term capital gains to the extent such distribution is properly reported by us as qualified dividend income and such stockholder satisfies certain minimum holding period requirements with respect to our stock) or (ii) long-term capital gain (to the extent such distribution is properly reported as a capital gain dividend), to the extent of our current and accumulated earnings and profits for U.S. federal income tax purposes. As a result, a U.S. stockholder
20
may be required to pay tax with respect to such dividends in excess of any cash received. If a U.S. stockholder sells the stock it receives in order to pay this tax, the sales proceeds may be less than the amount included in income with respect to the dividend, depending on the market price of our stock at the time of the sale. Furthermore, with respect to non-U.S. stockholders, we may be required to withhold U.S. tax with respect to such dividends, including in respect of all or a portion of such dividend that is payable in stock. In addition, if a significant number of our stockholders determine to sell shares of our stock in order to pay taxes owed on dividends, it may put downward pressure on the trading price of our stock.
Failure to Qualify as a RIC
If we fail to satisfy the 90% Income Test or the Diversification Tests for any taxable year, we may nevertheless continue to qualify as a RIC for such year if certain relief provisions are applicable (which may, among other things, require us to pay certain corporate-level U.S. federal taxes or to dispose of certain assets).
If we were unable to qualify for treatment as a RIC and the foregoing relief provisions are not applicable, we would be subject to tax on all of our taxable income at regular corporate rates. We would not be able to deduct distributions to stockholders, nor would they be required to be made. If we were subject to tax on all of our taxable income at regular corporate rates, then distributions we make after being subject to such tax would be taxable to our stockholders and, provided certain holding period and other requirements were met, could qualify for treatment as "qualified dividend income" eligible for the maximum 20% rate (plus a 3.8% Medicare surtax, if applicable) applicable to qualified dividends to the extent of our current and accumulated earnings and profits. Subject to certain limitations under the Code, corporate taxpayers would be eligible for a dividends-received deduction on distributions they receive. Distributions in excess of our current and accumulated earnings and profits would be treated first as a return of capital to the extent of the stockholder's tax basis, and any remaining distributions would be treated as a capital gain. To requalify as a RIC in a subsequent taxable year, we would be required to satisfy the RIC qualification requirements for that year and dispose of any earnings and profits from any year in which we failed to qualify as a RIC. Subject to a limited exception applicable to RICs that qualified as such under Subchapter M of the Code for at least one year prior to disqualification and that requalify as a RIC no later than the second year following the nonqualifying year, we could be subject to tax on any unrealized net built-in gains in the assets held by us during the period in which we failed to qualify as a RIC that are recognized within the subsequent five years, unless we made a special election to pay corporate-level U.S. federal income tax on such built-in gain at the time of our requalification as a RIC.
Investing in our securities involves a number of significant risks. In addition to the other information contained in this Annual Report on Form 10-K, you should consider carefully the following information before making an investment in our securities. The risks set out below are not the only risks we face. Additional risks and uncertainties not presently known to us or not presently deemed material by us might also impair our operations and performance. If any of the following events occur, our business, financial condition and results of operations could be materially and adversely affected. In such case, our net asset value, the trading price of our common stock and the value of our other securities could decline, and you may lose all or part of your investment.
21
RISKS RELATING TO ECONOMIC CONDITIONS
Deterioration in the economy and financial markets increases the likelihood of adverse effects on our financial position and results of operations. Such economic adversity could impair our portfolio companies' financial positions and operating results and affect the industries in which we invest, which could, in turn, harm our operating results.
The broader fundamentals of the United States economy remain mixed. In the event that the United States economy contracts, it is likely that the financial results of small to mid-sized companies, like those in which we invest, could experience deterioration or limited growth from current levels, which could ultimately lead to difficulty in meeting their debt service requirements and an increase in defaults. In addition, a decline in oil and natural gas prices would adversely affect the credit quality of our debt investments and the underlying operating performance of our equity investments in energy-related businesses. Consequently, we can provide no assurance that the performance of certain portfolio companies will not be negatively impacted by economic cycles, industry cycles or other conditions, which could also have a negative impact on our future results.
Although we have been able to secure access to additional liquidity, including through our multi-year revolving credit facility (the "Credit Facility"), public debt issuances, leverage available through the SBIC program and equity offerings, the potential for volatility in the debt and equity capital markets provides no assurance that debt or equity capital will be available to us in the future on favorable terms, or at all. Further, if the price of our common stock falls below our net asset value per share, we will be limited in our ability to sell new shares if we do not have stockholder authorization to sell shares at a price below net asset value per share. We did not seek stockholder authorization to sell shares of our common stock below the then current net asset value per share of our common stock at our 2019 annual meeting of stockholders because our common stock price had been trading significantly above the net asset value per share of our common stock since 2011.
Global capital markets could enter a period of severe disruption and instability. These conditions have historically affected and could again materially and adversely affect debt and equity capital markets in the United States, which could have a materially negative impact on our business, financial condition and results of operations.
The U.S. and global capital markets have, from time to time, experienced periods of disruption characterized by the freezing of available credit, a lack of liquidity in the debt capital markets, significant losses in the principal value of investments, the re-pricing of credit risk in the broadly syndicated credit market, the failure of major financial institutions and general volatility in the financial markets. During these periods of disruption, general economic conditions deteriorated with material and adverse consequences for the broader financial and credit markets, and the availability of debt and equity capital for the market as a whole, and financial services firms in particular, was reduced significantly. These conditions may reoccur for a prolonged period of time or materially worsen in the future. In addition, the United Kingdom's withdrawal agreement to leave the European Union (the so called "Brexit") could lead to further market disruptions and currency volatility, potentially weakening consumer, corporate and financial confidence and resulting in lower economic growth for companies that rely significantly on Europe for their business activities and revenues. The implications of the United Kingdom's withdrawal from the European Union, including the possibility of a "No-deal Brexit," are unclear at present. Additionally, trade wars and volatility in the global markets for stocks and commodities may affect other financial markets worldwide. We may in the future have difficulty accessing debt and equity capital markets, and a severe disruption in the global financial markets, deterioration in credit and financing conditions or uncertainty regarding U.S. government spending and deficit levels, Brexit or other global economic conditions could have a material adverse effect on our business, financial condition and results of operations.
22
RISKS RELATING TO OUR BUSINESS AND STRUCTURE
Our Investment Portfolio is and will continue to be recorded at fair value, with our Board of Directors having final responsibility for overseeing, reviewing and approving, in good faith, our determination of fair value and, as a result, there is and will continue to be uncertainty as to the value of our portfolio investments.
Under the 1940 Act, we are required to carry our portfolio investments at market value or, if there is no readily available market value, at fair value as determined by us with our Board of Directors having final responsibility for overseeing, reviewing and approving, in good faith, our determination of fair value and our valuation procedures. Typically, there is not a public market for the securities of the privately held LMM or Private Loan companies in which we have invested and will generally continue to invest. As a result, we value these securities quarterly at fair value based on inputs from management, a nationally recognized independent financial advisory services firm (on a rotational basis) and the Audit Committee of our Board of Directors with the oversight, review and approval of our Board of Directors. In addition, the market for investments in Middle Market companies is generally not a liquid market, and therefore, we primarily use a combination of observable inputs in non-active markets for which sufficient observable inputs were not available to determine the fair value of these investments and unobservable inputs, which are reviewed by the Audit Committee with the oversight, review and approval of our Board of Directors. See "Note B.1. — Valuation of the Investment Portfolio" in the notes to consolidated financial statements for a more detailed description of our investment portfolio valuation process and procedures.
The determination of fair value and consequently, the amount of unrealized gains and losses in our portfolio, are to a certain degree, subjective and dependent on a valuation process approved by our Board of Directors. Certain factors that may be considered in determining the fair value of our investments include external events, such as private mergers, sales and acquisitions involving comparable companies. Because such valuations, and particularly valuations of securities in privately held companies, are inherently uncertain, may fluctuate over short periods of time and may be based on estimates, our determinations of fair value may differ materially from the values that would have been used if a ready market for these securities existed. Due to this uncertainty, our fair value determinations may cause our net asset value on a given date to materially understate or overstate the value that we may ultimately realize on one or more of our investments. As a result, investors purchasing our securities based on an overstated net asset value would pay a higher price than the value of our investments might warrant. Conversely, investors selling our securities during a period in which the net asset value understates the value of our investments may receive a lower price for their securities than the value of our investments might warrant.
Our financial condition and results of operations depends on our ability to effectively manage and deploy capital.
Our ability to achieve our investment objective of maximizing our portfolio's total return by generating current income from our debt investments and capital appreciation from our equity and equity-related investments, including warrants, convertible securities and other rights to acquire equity securities in a portfolio company, depends on our ability to effectively manage and deploy capital, which depends, in turn, on our investment team's ability to identify, evaluate and monitor, and our ability to finance and invest in, companies that meet our investment criteria.
Accomplishing our investment objective on a cost-effective basis is largely a function of our investment team's handling of the investment process, its ability to provide competent, attentive and efficient services and our access to investments offering acceptable terms. In addition to monitoring the performance of our existing investments, members of our investment team are also called upon, from time to time, to provide managerial assistance to some of our portfolio companies. These demands on their time may distract them or slow the rate of investment.
Even if we are able to grow and build upon our investment operations, any failure to manage our growth effectively could have a material adverse effect on our business, financial condition, results of operations and
23
prospects. The results of our operations will depend on many factors, including the availability of opportunities for investment, readily accessible short and long-term funding alternatives in the financial markets and economic conditions. Furthermore, if we cannot successfully operate our business or implement our investment policies and strategies as described herein, it could negatively impact our ability to pay dividends.
We may face increasing competition for investment opportunities.
We compete for investments with other investment funds (including private equity funds, debt funds, mezzanine funds, collateralized loan obligation funds, or CLOs, BDCs and SBICs), as well as traditional financial services companies such as commercial banks and other sources of funding. Many of our competitors are substantially larger and have considerably greater financial, technical and marketing resources than we do. For example, some competitors may have a lower cost of capital and access to funding sources that are not available to us. In addition, some of our competitors may have higher risk tolerances or different risk assessments than we have. These characteristics could allow our competitors to consider a wider variety of investments, establish more relationships and offer better pricing and more flexible structuring than we are able to do. We may lose investment opportunities if we do not match our competitors' pricing, terms and structure. If we are forced to match our competitors' pricing, terms and structure, we may not be able to achieve acceptable returns on our investments or may bear substantial risk of capital loss. A significant part of our competitive advantage stems from the fact that the market for investments in LMM companies is underserved by traditional commercial banks and other financing sources. A significant increase in the number and/or the size of our competitors in this target market could force us to accept less attractive investment terms. Furthermore, many of our competitors are not subject to the regulatory restrictions that the 1940 Act imposes on us as a BDC.
We are dependent upon our key investment personnel for our future success.
We depend on the members of our investment team, particularly Dwayne L. Hyzak, David L. Magdol, Vincent D. Foster, Jesse E. Morris, K. Colton Braud, III, Damian T. Burke, Nicholas T. Meserve, Samuel A. Cashiola and Watt R. Matthews, for the identification, review, final selection, structuring, closing and monitoring of our investments. These employees have significant investment expertise and relationships that we rely on to implement our business plan. Although we have entered into non-compete arrangements with all of our executive officers and other key employees, we cannot guarantee that any employees will remain employed with us. If we lose the services of the individuals mentioned above, we may not be able to operate our business as we expect, and our ability to compete could be harmed, which could cause our operating results to suffer.
Our success depends on attracting and retaining qualified personnel in a competitive environment.
Our growth will require that we retain new investment and administrative personnel in a competitive market. Our ability to attract and retain personnel with the requisite credentials, experience and skills depends on several factors including, but not limited to, our ability to offer competitive wages, benefits and professional growth opportunities. Many of the entities, including investment funds (such as private equity funds, debt funds and mezzanine funds) and traditional financial services companies, with which we compete for experienced personnel have greater resources than we have.
The competitive environment for qualified personnel may require us to take certain measures to ensure that we are able to attract and retain experienced personnel. Such measures may include increasing the attractiveness of our overall compensation packages, altering the structure of our compensation packages through the use of additional forms of compensation, or other steps. The inability to attract and retain experienced personnel would have a material adverse effect on our business.
24
Our business model depends to a significant extent upon strong referral relationships, and our inability to maintain or develop these relationships, as well as the failure of these relationships to generate investment opportunities, could adversely affect our business.
We expect that members of our management team will maintain their relationships with intermediaries, financial institutions, investment bankers, commercial bankers, financial advisors, attorneys, accountants, consultants and other individuals within our network, and we will rely to a significant extent upon these relationships to provide us with potential investment opportunities. If our management team fails to maintain its existing relationships or develop new relationships with sources of investment opportunities, we will not be able to grow our Investment Portfolio. In addition, individuals with whom members of our management team have relationships are not obligated to provide us with investment opportunities, and, therefore, there is no assurance that such relationships will generate investment opportunities for us.
Our executive officers and employees, through the External Investment Manager, may manage other investment funds, including HMS Income, that operate in the same or a related line of business as we do, which may result in significant conflicts of interest.
Our executive officers and employees, through the External Investment Manager, may manage other investment funds that operate in the same or a related line of business as we do, and which funds may be invested in by us and/or our executive officers and employees. Accordingly, they may have obligations to such other entities, the fulfillment of which obligations may not be in the best interests of us or our stockholders. During May 2012, we entered into an investment sub-advisory agreement with HMS Adviser, which is the investment advisor to HMS Income, a non-listed BDC, to provide certain investment advisory services to HMS Adviser. In December 2013, after obtaining required no-action relief from the SEC to allow us to own a registered investment adviser, we assigned the sub-advisory agreement to the External Investment Manager since the fees received from such arrangement could otherwise have negative consequences on our ability to meet the source-of-income requirement necessary for us to maintain our RIC tax treatment. Under the investment sub-advisory agreement, the External Investment Manager is entitled to 50% of the base management fee and the incentive fees earned by HMS Adviser under its advisory agreement with HMS Income. The sub-advisory relationship requires us to commit resources to achieving HMS Income's investment objective, while such resources were previously solely devoted to achieving our investment objective. Our investment objective and investment strategies are very similar to those of HMS Income and it is likely that an investment appropriate for us or HMS Income would be appropriate for the other entity. As a result, we and HMS Income requested an exemptive order from the SEC permitting co-investments by us and HMS Income in certain negotiated transactions where our co-investing would otherwise be prohibited under the 1940 Act. The SEC granted the exemptive order in April 2014, and we have made, and in the future intend to continue to make, such co-investments with HMS Income in accordance with the conditions of the order. The order requires, among other things, that we and the External Investment Manager consider whether each such investment opportunity is appropriate for HMS Income and, if it is appropriate, to propose an allocation of the investment opportunity between us and HMS Income. As a consequence, it may be more difficult for us to maintain or increase the size of our Investment Portfolio in the future. Although we will endeavor to allocate investment opportunities in a fair and equitable manner, including in accordance with the conditions set forth in the exemptive order issued by the SEC when relying on such order, we may face conflicts in allocating investment opportunities between us and other funds managed by the External Investment Manager, including HMS Income. Because the External Investment Manager may receive performance-based fee compensation from HMS Income and any other funds it manages, this may provide an incentive to allocate opportunities to HMS Income and any other funds it manages instead of us. We have implemented an allocation policy to ensure the equitable distribution of investment opportunities and, as a result, may be unable to participate in certain investments based upon such allocation policy.
25
We, through the External Investment Manager, derive revenues from managing third-party funds pursuant to management agreements that may be terminated pursuant to the terms of such agreements or requirements under the 1940 Act.
The External Investment Manager earns management fees based on the assets of the funds under management and may earn incentive fees, or a carried interest, based on the performance of the funds managed, including HMS Income. The terms of fund investment management agreements generally give the manager of the fund and the fund itself the right to terminate the management agreement in certain circumstances. With respect to funds that are not exempt from regulation under the 1940 Act, the fund's investment management agreement must be approved annually by (a) such fund's board of directors or by the vote of a majority of such fund's stockholders and (b) the majority of the independent members of such fund's board of directors and, in certain cases, by its stockholders, as required by law. The funds' investment management agreements can also be terminated by the majority of such fund's stockholders. Termination of any such management agreements would reduce the fees we earn from the relevant funds through the External Investment Manager, which could have a material adverse effect on our results of operations. Currently, HMS Income, an investment company that has elected to be regulated as a BDC under the 1940 Act, is subject to these provisions of the 1940 Act.
Regulations governing our operation as a BDC will affect our ability to, and the way in which we, raise additional capital.
Our business will require capital to operate and grow. We may acquire such additional capital from the following sources:
Senior Securities. We may issue debt securities or preferred stock and/or borrow money from banks or other financial institutions, which we refer to collectively as senior securities. As a result of issuing senior securities, we will be exposed to additional risks, including the following:
26
Additional Common Stock. The 1940 Act prohibits us from selling shares of our common stock at a price below the current net asset value per share of such stock, with certain exceptions. One such exception is prior stockholder approval of issuances below current net asset value per share provided that our Board of Directors makes certain determinations. We did not seek stockholder authorization to sell shares of our common stock below the then current net asset value per share of our common stock at our 2019 annual meeting of stockholders because our common stock price had been trading significantly above the net asset value per share of our common stock since 2011. We may, however, sell our common stock, warrants, options or rights to acquire our common stock, at a price below the current net asset value of the common stock if our Board of Directors determines that such sale is in the best interests of our stockholders, and our stockholders approve such sale. See "— Stockholders may incur dilution if we sell shares of our common stock in one or more offerings at prices below the then current net asset value per share of our common stock or issue securities to subscribe to, convert to or purchase shares of our common stock" for a discussion of the risks related to us issuing shares of our common stock below net asset value. Our stockholders have authorized us to issue warrants, options or rights to subscribe for, convert to, or purchase shares of our common stock at a price per share below the net asset value per share, subject to the applicable requirements of the 1940 Act. There is no expiration date on our ability to issue such warrants, options, rights or convertible securities based on this stockholder approval. If we raise additional funds by issuing more common stock or senior securities convertible into, or exchangeable for, our common stock, the percentage ownership of our stockholders at that time would decrease, and they may experience dilution. Moreover, we can offer no assurance that we will be able to issue and sell additional equity securities in the future, on favorable terms or at all.
The Funds are licensed by the SBA, and therefore subject to SBIC regulations.
The Funds, our wholly owned subsidiaries, are licensed to act as SBICs and are regulated by the SBA. The SBA also places certain limitations on the financing terms of investments by SBICs in portfolio companies and prohibits SBICs from providing funds for certain purposes or to businesses in a few prohibited industries. Compliance with SBA requirements may cause the Funds to forego attractive investment opportunities that are not permitted under SBIC regulations.
Further, the SBIC regulations require, among other things, that a licensed SBIC be periodically examined by the SBA and audited by an independent auditor, in each case to determine the SBIC's compliance with the relevant SBIC regulations. The SBA prohibits, without prior SBA approval, a "change of control" of an SBIC or transfers that would result in any person (or a group of persons acting in concert) owning 10% or more of a class of capital stock of a licensed SBIC. If the Funds fail to comply with applicable SBIC regulations, the SBA could, depending on the severity of the violation, limit or prohibit their use of SBIC debentures, declare outstanding SBIC debentures immediately due and payable, and/or limit them from making new investments. In addition, the SBA can revoke or suspend a license for willful or repeated violation of, or willful or repeated failure to observe, any provision of the Small Business Investment Act of 1958 or any rule or regulation promulgated thereunder. Such actions by the SBA would, in turn, negatively affect us.
Because we borrow money, the potential for gain or loss on amounts invested in us is magnified and may increase the risk of investing in us.
Borrowings, also known as leverage, magnify the potential for loss on investments in our indebtedness and gain or loss on investments in our equity capital. As we use leverage to partially finance our investments, you will experience increased risks of investing in our securities. We, through the Funds, issue debt securities guaranteed by the SBA and sold in the capital markets. As a result of its guarantee of the debt securities, the
27
SBA has fixed dollar claims on the assets of the Funds that are superior to the claims of our securities holders. We may also borrow from banks and other lenders, including under our Credit Facility, and may issue debt securities or enter into other types of borrowing arrangements in the future. See "Management's Discussion and Analysis of Financial Condition and Results of Operations — Liquidity and Capital Resources — Capital Resources" for a discussion regarding our outstanding indebtedness. If the value of our assets decreases, leveraging would cause net asset value to decline more sharply than it otherwise would have had we not leveraged our business. Similarly, any decrease in our income would cause net investment income to decline more sharply than it would have had we not leveraged our business. Such a decline could negatively affect our ability to pay common stock dividends, scheduled debt payments or other payments related to our securities. Use of leverage is generally considered a speculative investment technique.
As of December 31, 2019, we, through the Funds, had $311.8 million of outstanding indebtedness guaranteed by the SBA, which had a weighted-average annualized interest cost of approximately 3.6%. The debentures guaranteed by the SBA have a maturity of ten years, with a current weighted-average remaining maturity of 5.1 years as of December 31, 2019, and require semiannual payments of interest. We will need to generate sufficient cash flow to make required interest payments on the debentures. If we are unable to meet the financial obligations under the debentures, the SBA, as a creditor, will have a superior claim to the assets of the Funds over our securities holders in the event we liquidate or the SBA exercises its remedies under such debentures as the result of a default by us.
In addition, as of December 31, 2019, we had $300.0 million outstanding under our Credit Facility. Borrowings under the Credit Facility bear interest, subject to our election, on a per annum basis at a rate equal to the applicable LIBOR rate (1.8% as of December 31, 2019) plus (i) 1.875% (or the applicable base rate (Prime Rate of 4.75% as of December 31, 2019) plus 0.875%), as long as we meet certain agreed upon excess collateral and maximum leverage requirements or (ii) 2.0% (or the applicable base rate plus 1.0%) otherwise. We pay unused commitment fees of 0.25% per annum on the unused lender commitments under the Credit Facility. If we are unable to meet the financial obligations under the Credit Facility, the Credit Facility lending group will have a superior claim to the assets of MSCC and its subsidiaries (excluding the assets of the Funds) over our stockholders in the event we liquidate or the lending group exercises its remedies under the Credit Facility as the result of a default by us.
In November 2017, we issued $185.0 million in aggregate principal amount of 4.50% unsecured notes due 2022 (the "4.50% Notes due 2022") at an issue price of 99.16%. As of December 31, 2019, the outstanding balance of the 4.50% Notes due 2022 was $185.0 million. The 4.50% Notes due 2022 are unsecured obligations and rank pari passu with our current and future unsecured indebtedness; senior to any of our future indebtedness that expressly provides it is subordinated to the 4.50% Notes due 2022; effectively subordinated to all of our existing and future secured indebtedness, to the extent of the value of the assets securing such indebtedness, including borrowings under our Credit Facility; and structurally subordinated to all existing and future indebtedness and other obligations of any of our subsidiaries, including without limitation, the indebtedness of the Funds. The 4.50% Notes due 2022 mature on December 1, 2022, and may be redeemed in whole or in part at any time at our option subject to certain make-whole provisions.
In April 2019, we issued $250.0 million in aggregate principal amount of 5.20% unsecured Notes due 2024 (the "5.20% Notes" and, together with the 4.50% Notes due 2022, the "Notes") at an issue price of 99.125%. Subsequently, in December 2019, Main Street issued an additional $75.0 million of the 5.20% Notes at an issue price of 105.0%. As of December 31, 2019, the outstanding balance of the 5.20% Notes was $325.0 million. The 5.20% Notes issued in December 2019 have identical terms as, and are a part of a single series with, the 5.20% Notes issued in April 2019. The aggregate net proceeds from the 5.20% Notes issuances were used to repay a portion of the borrowings outstanding under the Credit Facility. The 5.20% Notes are unsecured obligations and rank pari passu with our current and future unsecured indebtedness; senior to any of our future indebtedness that expressly provides it is subordinated to the 5.20% Notes; effectively subordinated to all of our existing and future secured indebtedness, to the extent of the value of the assets securing such indebtedness, including borrowings under our Credit Facility; and structurally subordinated to all existing and future indebtedness and other obligations of any of our subsidiaries, including
28
without limitation, the indebtedness of the Funds. The 5.20% Notes mature on May 1, 2024, and may be redeemed in whole or in part at any time at our option subject to certain make-whole provisions.
Illustration. The following table illustrates the effect of leverage on returns from an investment in our common stock assuming various annual returns, net of expenses. The calculations in the table below are hypothetical and actual returns may be higher or lower than those appearing below.
Assumed Return on Our Portfolio(1)
(net of expenses)
| |
(10.0)% | (5.0)% | 0.0% | 5.0% | 10.0% | |||||||||||
|---|---|---|---|---|---|---|---|---|---|---|---|---|---|---|---|---|
Corresponding net return to common stockholder(2) |
(20.8)% | (12.0)% | (3.1)% | 5.7% | 14.5% | |||||||||||
Our ability to achieve our investment objective may depend in part on our ability to access additional leverage on favorable terms by issuing debentures guaranteed by the SBA through the Funds, by borrowing from banks or insurance companies or by issuing other debt securities and there can be no assurance that such additional leverage can in fact be achieved.
All of our assets are subject to security interests under our secured Credit Facility or subject to a superior claim over our stockholders by the SBA and if we default on our obligations under the Credit Facility or with respect to our SBA-guaranteed debentures, we may suffer adverse consequences, including foreclosure on our assets.
Substantially all of our assets are currently pledged as collateral under our Credit Facility or are subject to a superior claim over our stockholders by the SBA. If we default on our obligations under the Credit Facility or our SBA-guaranteed debentures, the lenders and/or the SBA may have the right to foreclose upon and sell, or otherwise transfer, the collateral subject to their security interests or their superior claim. In such event, we may be forced to sell our investments to raise funds to repay our outstanding borrowings in order to avoid foreclosure and these forced sales may be at times and at prices we would not consider advantageous. Moreover, such deleveraging of our company could significantly impair our ability to effectively operate our business in the manner in which we have historically operated. As a result, we could be forced to curtail or cease new investment activities and lower or eliminate the dividends that we have historically paid to our stockholders. In addition, if the lenders exercise their right to sell the assets pledged under our Credit Facility, such sales may be completed at distressed sale prices, thereby diminishing or potentially eliminating the amount of cash available to us after repayment of the amounts outstanding under the Credit Facility.
Previously enacted legislation may allow us to incur additional leverage.
The 1940 Act generally prohibits us from incurring indebtedness unless immediately after such borrowing we have an asset coverage for total borrowings of at least 200% (i.e., the amount of debt may not exceed 50% of the value of our assets). However, legislation passed in March 2018 modified the 1940 Act by allowing a BDC to increase the maximum amount of leverage it may incur by lowering the required asset coverage ratio of 200% to an asset coverage ratio of 150% (i.e., the amount of debt may not exceed 662/3% of the value of our assets), if certain requirements are met. Under the legislation, we are allowed to increase our leverage capacity if stockholders representing at least a majority of the votes cast, when a quorum is met, approve a proposal to do so. If we receive stockholder approval, we would be allowed to increase our leverage capacity on the first day after such approval. Alternatively, the legislation allows a "required majority" (as defined in Section 57(o) of the 1940 Act) of the members of our board of directors to approve an increase in
29
our leverage capacity, and such approval would become effective after one year from the date of approval. In either case, we would be required to make certain disclosures on our website and in SEC filings regarding, among other things, the receipt of approval to increase our leverage, our leverage capacity and usage, and risks related to leverage. As a result of this legislation, we may be able to increase our leverage up to an amount that reduces our asset coverage ratio from 200% to 150% (i.e., the amount of debt may not exceed 662/3% of the value of our assets). See "Risk Factors — Risks Relating to Our Business and Structure — Because we borrow money, the potential for gain or loss on amounts invested in us is magnified and may increase the risk of investing in us" for a discussion of the risks associated with leverage.
Further downgrades of the U.S. credit rating, automatic spending cuts or another government shutdown could negatively impact our liquidity, financial condition and earnings.
Recent U.S. debt ceiling and budget deficit concerns have increased the possibility of additional credit-rating downgrades and economic slowdowns, or a recession in the U.S. Although U.S. lawmakers passed legislation to raise the federal debt ceiling on multiple occasions, ratings agencies have lowered or threatened to lower the long-term sovereign credit rating on the United States. The impact of this or any further downgrades to the U.S. government's sovereign credit rating or its perceived creditworthiness could adversely affect the U.S. and global financial markets and economic conditions. Absent further quantitative easing by the Federal Reserve, these developments could cause interest rates and borrowing costs to rise, which may negatively impact our ability to access the debt markets on favorable terms. In addition, disagreement over the federal budget has caused the U.S. federal government to shut down for periods of time. Continued adverse political and economic conditions could have a material adverse effect on our business, financial condition and results of operations.
The interest rates of our floating-rate loans to our portfolio companies and for any of our borrowings that extend beyond 2021 might be subject to change based on recent regulatory changes
LIBOR is the basic rate of interest used in lending transactions between banks on the London interbank market and is widely used as a reference for setting the interest rate on loans globally. We typically use LIBOR as a reference rate in floating rate loans we extend to portfolio companies such that the interest due to us pursuant to a term loan extended to a portfolio company is calculated using LIBOR and we use LIBOR as a reference rate in connection with our Credit Facility. The terms of our debt investments generally include minimum interest rate floors which are calculated based on LIBOR.
On July 27, 2017, the United Kingdom's Financial Conduct Authority, which regulates LIBOR, announced that it intends to phase out LIBOR by the end of 2021. It is unclear if at that time whether LIBOR will cease to exist or if new methods of calculating LIBOR will be established such that it continues to exist after 2021. As such, the potential effect of any such event on our net investment income cannot yet be determined. The U.S. Federal Reserve, in conjunction with the Alternative Reference Rates Committee, a steering committee comprised of large U.S. financial institutions, has identified the Secured Overnight Financing Rate ("SOFR") as its preferred alternative rate for LIBOR. SOFR is a measure of the cost of borrowing cash overnight, collateralized by U.S. Treasury securities, and is based on directly observable U.S. Treasury-based repurchase transactions. Although SOFR appears to be the preferred replacement rate for U.S. dollar LIBOR, at this time, it is not possible to predict whether SOFR will attain market traction as a LIBOR replacement tool or the effect of any such changes as the establishment of alternative reference rates or other reforms to LIBOR may be enacted in the United States, United Kingdom or elsewhere. If LIBOR ceases to exist, we may need to renegotiate the credit agreements extending beyond 2021 with our portfolio companies that utilize LIBOR as a factor in determining the interest rate to replace LIBOR with the new standard that is established. In addition, any further changes or reforms to the determination or supervision of LIBOR may result in a sudden or prolonged increase or decrease in reported LIBOR, which could have an adverse impact on the market value for or value of any LIBOR-linked securities, loans and other financial obligations or extensions of credit held by or due to us and could have a material adverse effect on our business, financial condition, tax position and results of operations.
30
We may experience fluctuations in our operating results.
We could experience fluctuations in our operating results due to a number of factors, including our ability or inability to make investments in companies that meet our investment criteria, the interest rate payable on the debt securities we acquire, the level of portfolio dividend and fee income, the level of our expenses, variations in and the timing of the recognition of realized and unrealized gains or losses, the degree to which we encounter competition in our markets and general economic conditions. As a result of these factors, operating results for any period should not be relied upon as being indicative of performance in future periods.
Our Board of Directors may change our operating policies and strategies without prior notice or stockholder approval, the effects of which may be adverse.
Our Board of Directors has the authority to modify or waive our current operating policies, investment criteria and strategies without prior notice and without stockholder approval. We cannot predict the effect any changes to our current operating policies, investment criteria and strategies would have on our business, net asset value, operating results and value of our stock. However, the effects might be adverse, which could negatively impact our ability to pay interest and principal payments to holders of our debt instruments and dividends to our stockholders and cause our investors to lose all or part of their investment in us.
We will be subject to corporate-level U.S. federal income tax if we are unable to qualify as a RIC under Subchapter M of the Code.
To maintain RIC tax treatment under the Code, we must meet the following annual distribution, income source and asset diversification requirements:
31
Failure to meet these requirements may result in our having to dispose of certain investments quickly in order to prevent the loss of RIC status. Because most of our investments are in privately held companies, and therefore illiquid, any such dispositions could be made at disadvantageous prices and could result in substantial losses. Moreover, if we fail to maintain RIC tax treatment for any reason and are subject to corporate income tax, the resulting corporate taxes could substantially reduce our net assets, the amount of income available for distribution and the amount of our distributions.
We may not be able to pay distributions to our stockholders, our distributions may not grow over time, and a portion of distributions paid to our stockholders may be a return of capital, which is a distribution of the stockholders' invested capital.
We intend to pay distributions to our stockholders out of assets legally available for distribution. We cannot assure you that we will achieve investment results that will allow us to pay a specified level of cash distributions, previously projected distributions for future periods, or year-to-year increases in cash distributions. Our ability to pay distributions might be adversely affected by, among other things, the impact of one or more of the risk factors described herein. In addition, the inability to satisfy the asset coverage test applicable to us as a BDC could limit our ability to pay distributions. All distributions will be paid at the discretion of our Board of Directors and will depend on our earnings, our financial condition, maintenance of our RIC status, compliance with applicable BDC regulations, compliance with our debt covenants, each of the Funds' compliance with applicable SBIC regulations and such other factors as our Board of Directors may deem relevant from time to time. We cannot assure you that we will pay distributions to our stockholders in the future.
When we make distributions, we will be required to determine the extent to which such distributions are paid out of current or accumulated taxable earnings, recognized capital gains or capital. To the extent there is a return of capital, investors will be required to reduce their basis in our stock for U.S. federal income tax purposes, which may result in higher tax liability when the shares are sold, even if they have not increased in value or have lost value. In addition, any return of capital will be net of any sales load and offering expenses associated with sales of shares of our common stock. In the future, our distributions may include a return of capital.
We may have difficulty paying the distributions required to maintain RIC tax treatment under the Code if we recognize income before or without receiving cash representing such income.
We will include in income certain amounts that we have not yet received in cash, such as: (i) amortization of original issue discount, which may arise if we receive warrants in connection with the origination of a loan such that ascribing a value to the warrants creates original issue discount in the debt instrument, if we invest in a debt investment at a discount to the par value of the debt security or possibly in other circumstances; (ii) contractual payment-in-kind, or PIK, interest, which represents contractual interest added to the loan balance and due at the end of the loan term; (iii) contractual preferred dividends, which represents contractual dividends added to the preferred stock and due at the end of the preferred stock term, subject to adequate profitability at the portfolio company; or (iv) amortization of market discount, which is associated with loans purchased in the secondary market at a discount to par value. Such amortization of original issue discounts, increases in loan balances as a result of contractual PIK arrangements, cumulative preferred dividends, or amortization of market discount will be included in income before we receive the corresponding cash payments. We also may be required to include in income certain other amounts before we receive such amounts in cash. Investments structured with these features may represent a higher level of credit risk compared to investments generating income which must be paid in cash on a current basis. For the year ended December 31, 2019, (i) approximately 2.0% of our total investment income was attributable to PIK income not paid currently in cash, (ii) approximately 0.5% of our total investment income was attributable to amortization of original issue discount, (iii) approximately 1.0% of our total investment income was attributable to cumulative dividend income not paid currently in cash, and (iv) approximately 2.2% of our
32
total investment income was attributable to amortization of market discount on loans purchased in the secondary market at a discount.
Since, in certain cases, we may recognize taxable income before or without receiving cash representing such income, we may have difficulty meeting the Annual Distribution Requirement necessary to maintain RIC tax treatment under the Code. Accordingly, we may have to sell some of our investments at times and/or at prices we would not consider advantageous, raise additional debt or equity capital or forgo new investment opportunities for this purpose. If we are not able to obtain cash from other sources, we may fail to qualify for RIC tax treatment and thus become subject to corporate-level U.S. federal income tax. For additional discussion regarding the tax implications of a RIC, please see "Business — Regulation — Taxation as a Regulated Investment Company."
We may in the future choose to pay dividends in our own stock, in which case you may be required to pay tax in excess of the cash you receive.
We may distribute taxable dividends that are payable in part in our stock. Under certain applicable provisions of the Code and the Treasury regulations, distributions payable by us in cash or in shares of stock (at the stockholders election) would satisfy the Annual Distribution Requirement. The Internal Revenue Service has issued guidance providing that a dividend payable in stock or in cash at the election of the stockholders will be treated as a taxable dividend eligible for the dividends paid deduction provided that at least 20% of the total dividend is payable in cash and certain other requirements are satisfied. Taxable stockholders receiving such dividends will be required to include the full amount of the dividend as ordinary income (or as long-term capital gain to the extent such dividend is properly reported as a capital gain dividend) to the extent of our current and accumulated earnings and profits for U.S. federal income tax purposes. As a result, a U.S. stockholder may be required to pay tax with respect to such dividends in excess of any cash received. If a U.S. stockholder sells the stock it receives as a dividend in order to pay this tax, the sales proceeds may be less than the amount included in income with respect to the dividend, depending on the market price of our stock at the time of the sale. Furthermore, with respect to non-U.S. stockholders, we may be required to withhold U.S. tax with respect to such dividends, including in respect of all or a portion of such dividend that is payable in stock. In addition, if a significant number of our stockholders determine to sell shares of our stock in order to pay taxes owed on dividends, it may put downward pressure on the trading price of our stock.
Each of the Funds, as an SBIC, may be unable to make distributions to us that will enable us to meet or maintain RIC status, which could result in the imposition of an entity-level tax.
In order for us to continue to qualify for RIC tax treatment and to minimize corporate-level U.S. federal taxes, we will be required to distribute substantially all of our net ordinary taxable income and net capital gain income, including taxable income from certain of our subsidiaries, which includes the income from the Funds. We will be partially dependent on the Funds for cash distributions to enable us to meet the RIC distribution requirements. The Funds may be limited by SBIC regulations from making certain distributions to us that may be necessary to enable us to maintain our status as a RIC. We may have to request a waiver of the SBA's restrictions for the Funds to make certain distributions to maintain our eligibility for RIC status. We cannot assure you that the SBA will grant such waiver and if the Funds are unable to obtain a waiver, compliance with the SBIC regulations may result in loss of RIC tax treatment and a consequent imposition of an entity-level tax on us.
Because we intend to distribute substantially all of our taxable income to our stockholders to maintain our status as a RIC, we will continue to need additional capital to finance our growth, and regulations governing our operation as a BDC will affect our ability to, and the way in which we, raise additional capital and make distributions.
In order to satisfy the requirements applicable to a RIC and to minimize corporate-level U.S. federal taxes, we intend to distribute to our stockholders substantially all of our net ordinary taxable income and net
33
capital gain income. We may carry forward excess undistributed taxable income into the next year. Any such carryover taxable income must be distributed through a dividend declared prior to filing the final tax return related to the year which generated such taxable income. As a BDC, we generally are required to meet an asset coverage ratio, as defined in the 1940 Act, of at least 200% (or 150% if certain requirements are met) immediately after each issuance of senior securities. This requirement limits the amount that we may borrow and may prohibit us from making distributions. Because we will continue to need capital to grow our Investment Portfolio, this limitation may prevent us from incurring debt and require us to raise additional equity at a time when it may be disadvantageous to do so.
While we expect to be able to borrow and to issue additional debt and equity securities, we cannot assure you that debt and equity financing will be available to us on favorable terms, or at all. In addition, as a BDC, we generally are not permitted to issue equity securities priced below net asset value without stockholder approval. If additional funds are not available to us, we could be forced to curtail or cease new investment activities, and our net asset value could decline.
Stockholders may incur dilution if we sell shares of our common stock in one or more offerings at prices below the then current net asset value per share of our common stock or issue securities to subscribe to, convert to or purchase shares of our common stock.
The 1940 Act prohibits us from selling shares of our common stock at a price below the current net asset value per share of such stock, with certain exceptions. One such exception is prior stockholder approval of issuances below net asset value provided that our Board of Directors makes certain determinations. We did not seek stockholder authorization to sell shares of our common stock below the then current net asset value per share of our common stock at our 2019 annual meeting of stockholders because our common stock price per share had been trading significantly above the net asset value per share of our common stock since 2011. We may, however, seek such authorization at future annual or special meetings of stockholders. Our stockholders have previously approved a proposal to authorize us to issue securities to subscribe to, convert to, or purchase shares of our common stock in one or more offerings. Any decision to sell shares of our common stock below the then current net asset value per share of our common stock or securities to subscribe to, convert to, or purchase shares of our common stock would be subject to the determination by our Board of Directors that such issuance is in our and our stockholders' best interests.
If we were to sell shares of our common stock below net asset value per share, such sales would result in an immediate dilution to the net asset value per share. This dilution would occur as a result of the sale of shares at a price below the then current net asset value per share of our common stock and a proportionately greater decrease in a stockholder's interest in our earnings and assets and voting interest in us than the increase in our assets resulting from such issuance. In addition, if we issue securities to subscribe to, convert to or purchase shares of common stock, the exercise or conversion of such securities would increase the number of outstanding shares of our common stock. Any such exercise would be dilutive on the voting power of existing stockholders, and could be dilutive with regard to dividends and our net asset value, and other economic aspects of the common stock.
Because the number of shares of common stock that could be so issued and the timing of any issuance is not currently known, the actual dilutive effect cannot be predicted; however, the example below illustrates the effect of dilution to existing stockholders resulting from the sale of common stock at prices below the net asset value of such shares.
Illustration: Example of Dilutive Effect of the Issuance of Shares Below Net Asset Value. Assume that Company XYZ has 1,000,000 total shares outstanding, $15,000,000 in total assets and $5,000,000 in total liabilities. The net asset value per share of the common stock of Company XYZ is $10.00. The following table illustrates the reduction to net asset value, or NAV, and the dilution experienced by Stockholder A
34
following the sale of 40,000 shares of the common stock of Company XYZ at $9.50 per share, a price below its NAV per share.
| |
Prior to Sale Below NAV |
Following Sale Below NAV |
Percentage Change |
|||||||
|---|---|---|---|---|---|---|---|---|---|---|
Reduction to NAV |
||||||||||
Total Shares Outstanding |
1,000,000 | 1,040,000 | 4.0% | |||||||
NAV per share |
$ | 10.00 | $ | 9.98 | (0.2)% | |||||
Dilution to Existing Stockholder |
||||||||||
Shares Held by Stockholder A |
10,000 | 10,000 | (1) | 0.0% | ||||||
Percentage Held by Stockholder A |
1.00% | 0.96% | (3.8)% | |||||||
Total Interest of Stockholder A in NAV |
$ | 100,000 | $ | 99,808 | (0.2)% | |||||
Failure to comply with applicable laws or regulations and changes in laws or regulations governing our operations may adversely affect our business or cause us to alter our business strategy.
We, the Funds, and our portfolio companies are subject to applicable local, state and federal laws and regulations. Failure to comply with any applicable local, state or federal law or regulation could negatively impact our reputation and our business results. New legislation may also be enacted or new interpretations, rulings or regulations could be adopted, including those governing the types of investments we are permitted to make, any of which could harm us and our stockholders, potentially with retroactive effect. In addition, any change to the SBA's current debenture SBIC program could have a significant impact on our ability to obtain lower-cost leverage through the Funds, and therefore, our ability to compete with other finance companies.
Additionally, any changes to the laws and regulations governing our operations relating to permitted investments may cause us to alter our investment strategy in order to avail ourselves of new or different opportunities. Such changes could result in material differences to the strategies and plans set forth herein and may result in our investment focus shifting from the areas of expertise of our investment team to other types of investments in which our investment team may have less expertise or little or no experience. Thus, any such changes, if they occur, could have a material adverse effect on our results of operations and the value of your investment.
The Tax Cuts and Jobs Act could have a negative effect on us, our subsidiaries, our portfolio companies and the holders of our securities.
In December 2017, President Trump signed into law significant tax reform legislation (commonly referred to as the "Tax Cuts and Jobs Act"). The Tax Cuts and Jobs Act made significant changes to the U.S. federal income tax rules applicable to both individuals and entities, including corporations. The Tax Cuts and Jobs Act included provisions that, among other things, reduced the U.S. corporate tax rate, introduced a capital investment deduction, limited the interest deduction, limited the use of net operating losses to offset future taxable income and made extensive changes to the U.S. international tax system. The effects of the various provisions of the Tax Cuts and Jobs Act listed above on the respective positions of us, our stockholders and our portfolio companies may be material and depend on the factual circumstances of each, over time. In addition, Treasury and the Internal Revenue Service continue to release guidance in the form of regulations providing rules for implementation and interpretation of the Tax Cuts and Jobs Act provisions. Uncertainty remains regarding provisions of the Tax Cuts and Jobs Act while some of the Treasury regulations and guidance remain in proposed form. Accordingly, we cannot predict any additional future impact the enactment of such legislation will have on us, our subsidiaries, our portfolio companies and the holders of our securities.
35
Terrorist attacks, acts of war, public health crises or natural disasters may affect any market for our securities, impact the businesses in which we invest and harm our business, operating results and financial condition.
Terrorist acts, acts of war, public health crises (including the recent coronavirus outbreak) or natural disasters may disrupt our operations, as well as the operations of the businesses in which we invest. Such acts have created, and continue to create, economic and political uncertainties and have contributed to global economic instability. Future terrorist activities, military or security operations, public health crises, or natural disasters could further weaken the domestic/global economies and create additional uncertainties, which may negatively impact the businesses in which we invest directly or indirectly and, in turn, could have a material adverse impact on our business, operating results and financial condition. Losses from terrorist attacks, public health crises and natural disasters are generally uninsurable.
We are highly dependent on information systems and systems failures could significantly disrupt our business, which may, in turn, negatively affect the market price of our common stock and our ability to pay dividends.
Our business is highly dependent on our and third parties' communications and information systems. Any failure or interruption of those systems, including as a result of the termination of an agreement with any third-party service providers, could cause delays or other problems in our activities. Our financial, accounting, data processing, backup or other operating systems and facilities may fail to operate properly or become disabled or damaged as a result of a number of factors including events that are wholly or partially beyond our control and adversely affect our business. There could be:
The failure in cyber security systems, as well as the occurrence of events unanticipated in our disaster recovery systems and management continuity planning could impair our ability to conduct business effectively.
The occurrence of a disaster such as a cyber-attack, a natural catastrophe, an industrial accident, a terrorist attack or war, events unanticipated in our disaster recovery systems, or a support failure from external providers, could have an adverse effect on our ability to conduct business and on our results of operations and financial condition, particularly if those events affect our computer-based data processing, transmission, storage, and retrieval systems or destroy data. If a significant number of our managers were unavailable in the event of a disaster, our ability to effectively conduct our business could be severely compromised.
We depend heavily upon computer systems to perform necessary business functions. Despite our implementation of a variety of security measures, our computer systems could be subject to cyber-attacks and unauthorized access, such as physical and electronic break-ins or unauthorized tampering. Like other companies, we may experience threats to our data and systems, including malware and computer virus attacks, unauthorized access, system failures and disruptions. If one or more of these events occurs, it could potentially jeopardize the confidential, proprietary and other information processed and stored in, and transmitted through, our computer systems and networks, or otherwise cause interruptions or malfunctions in our operations, which could result in damage to our reputation, financial losses, litigation, increased costs, regulatory penalties and/or customer dissatisfaction or loss.
Third parties with which we do business (including, but not limited to, service providers, such as accountants, custodians, transfer agents and administrators, and the issuers of securities in which we invest)
36
may also be sources or targets of cyber security or other technological risks. While we engage in actions to reduce our exposure resulting from outsourcing, we cannot control the cyber security plans and systems put in place by these third parties and ongoing threats may result in unauthorized access, loss, exposure or destruction of data, or other cybersecurity incidents, with increased costs and other consequences, including those described above. Privacy and information security laws and regulation changes, and compliance with those changes, may also result in cost increases due to system changes and the development of new administrative processes.
We are subject to risks related to corporate social responsibility.
Our business faces increasing public scrutiny related to environmental, social and governance ("ESG") activities. We risk damage to our brand and reputation if we fail to act responsibly in a number of areas, such as diversity and inclusion, environmental stewardship, support for local communities, corporate governance and transparency and considering ESG factors in our investment processes. Adverse incidents with respect to ESG activities could impact the value of our brand, the cost of our operations and relationships with investors, all of which could adversely affect our business and results of operations. Additionally, new regulatory initiatives related to ESG could adversely affect our business.
RISKS RELATED TO OUR INVESTMENTS
Our investments in portfolio companies involve higher levels of risk, and we could lose all or part of our investment.
Investing in our portfolio companies exposes us indirectly to a number of significant risks. Among other things, these companies:
In addition, in the course of providing significant managerial assistance to certain of our portfolio companies, certain of our officers and directors may serve as directors on the boards of such companies. To the extent that litigation arises out of our investments in these companies, our officers and directors may be
37
named as defendants in such litigation, which could result in an expenditure of funds (through our indemnification of such officers and directors) and the diversion of management time and resources.
A decline in oil and natural gas prices could have a material adverse effect on us.
A decline in oil and natural gas prices could adversely affect (i) the credit quality of our debt investments and (ii) the underlying operating performance of our equity investments in energy-related businesses and in portfolio companies located in geographic areas which are more sensitive to the health of the oil and gas industries. A decrease in credit quality and the operating performance would, in turn, negatively affect the fair value of these investments, which would consequently negatively affect our net asset value. Should a decline in oil and natural gas prices persist for an extended period of time, it is likely that the ability of these investments to satisfy financial or operating covenants imposed by us or other lenders will be adversely affected, thereby negatively impacting their financial condition and their ability to satisfy their debt service and other obligations to us. Likewise, should a decline in oil and natural gas prices persist, it is likely that our energy-related portfolio companies' and other affected companies' cash flow and profit generating capacities would also be adversely affected thereby negatively impacting their ability to pay us dividends or distributions on our equity investments.
We may be exposed to higher risks with respect to our investments that include original issue discount or PIK interest.
Our investments may include original issue discount and contractual PIK interest, which represents contractual interest added to a loan balance and due at the end of such loan's term. To the extent original issue discount or PIK interest constitute a portion of our income, we are exposed to typical risks associated with such income being required to be included in taxable and accounting income prior to receipt of cash, including the following:
The lack of liquidity in our investments may adversely affect our business.
We invest in companies whose securities are not publicly traded, and whose securities will be subject to legal and other restrictions on resale or will otherwise be less liquid than publicly traded securities. The illiquidity of these investments may make it difficult for us to sell these investments when desired. In addition, if we are required to liquidate all or a portion of our portfolio quickly, we may realize significantly less than the value at which we had previously recorded these investments. As a result, we do not expect to achieve liquidity in our investments in the near-term. Our investments are usually subject to contractual or legal restrictions on resale or are otherwise illiquid because there is usually no established trading market for
38
such investments. The illiquidity of most of our investments may make it difficult for us to dispose of them at a favorable price, and, as a result, we may suffer losses.
We may not have the funds or ability to make additional investments in our portfolio companies.
We may not have the funds or ability to make additional investments in our portfolio companies. After our initial investment in a portfolio company, we may be called upon from time to time to provide additional funds to such company or have the opportunity to increase our investment through the extension of additional loans, the exercise of a warrant to purchase equity securities, or the funding of additional equity investments. There is no assurance that we will make, or will have sufficient funds to make, follow-on investments. Any decisions not to make a follow-on investment or any inability on our part to make such an investment may have a negative impact on a portfolio company in need of such an investment, may result in a missed opportunity for us to increase our participation in a successful operation, may reduce our ability to protect an existing investment or may reduce the expected yield on the investment.
Our portfolio companies may incur debt that ranks equally with, or senior to, our investments in such companies.
We invest primarily in the secured term debt of LMM, Private Loan and Middle Market companies and equity issued by LMM companies. Our portfolio companies may have, or may be permitted to incur, other debt that ranks equally with, or senior to, the debt in which we invest. By their terms, such debt instruments may entitle the holders to receive payment of interest or principal on or before the dates on which we are entitled to receive payments with respect to the debt instruments in which we invest. Also, in the event of insolvency, liquidation, dissolution, reorganization or bankruptcy of a portfolio company, holders of debt instruments ranking senior to our investment in that portfolio company would typically be entitled to receive payment in full before we receive any distribution. After repaying such senior creditors, such portfolio company may not have any remaining assets to use for repaying its obligation to us. In the case of debt ranking equally with debt instruments in which we invest, we would have to share on an equal basis any distributions with other creditors holding such debt in the event of an insolvency, liquidation, dissolution, reorganization or bankruptcy of the relevant portfolio company.
There may be circumstances where our debt investments could be subordinated to claims of other creditors or we could be subject to lender liability claims.
Even though we may have structured certain of our investments as secured loans, if one of our portfolio companies were to go bankrupt, depending on the facts and circumstances, and based upon principles of equitable subordination as defined by existing case law, a bankruptcy court could subordinate all or a portion of our claim to that of other creditors and transfer any lien securing such subordinated claim to the bankruptcy estate. The principles of equitable subordination defined by case law have generally indicated that a claim may be subordinated only if its holder is guilty of misconduct or where the senior loan is re-characterized as an equity investment and the senior lender has actually provided significant managerial assistance to the bankrupt debtor. We may also be subject to lender liability claims for actions taken by us with respect to a borrower's business or instances where we exercise control over the borrower. It is possible that we could become subject to a lender liability claim, including as a result of actions taken in rendering significant managerial assistance or actions to compel and collect payments from the borrower outside the ordinary course of business.
Second priority liens on collateral securing loans that we make to our portfolio companies may be subject to control by senior creditors with first priority liens. If there is a default, the value of the collateral may not be sufficient to repay in full both the first priority creditors and us.
Certain loans that we make are secured by a second priority security interest in the same collateral pledged by a portfolio company to secure senior debt owed by the portfolio company to commercial banks or other traditional lenders. Often the senior lender has procured covenants from the portfolio company
39
prohibiting the incurrence of additional secured debt without the senior lender's consent. Prior to and as a condition of permitting the portfolio company to borrow money from us secured by the same collateral pledged to the senior lender, the senior lender will require assurances that it will control the disposition of any collateral in the event of bankruptcy or other default. In many such cases, the senior lender will require us to enter into an "intercreditor agreement" prior to permitting the portfolio company to borrow from us. Typically the intercreditor agreements we are requested to execute expressly subordinate our debt instruments to those held by the senior lender and further provide that the senior lender shall control: (1) the commencement of foreclosure or other proceedings to liquidate and collect on the collateral; (2) the nature, timing and conduct of foreclosure or other collection proceedings; (3) the amendment of any collateral document; (4) the release of the security interests in respect of any collateral; and (5) the waiver of defaults under any security agreement. Because of the control we may cede to senior lenders under intercreditor agreements we may enter, we may be unable to realize the proceeds of any collateral securing some of our loans.
Finally, the value of the collateral securing our debt investment will ultimately depend on market and economic conditions, the availability of buyers and other factors. Therefore, there can be no assurance that the proceeds, if any, from the sale or sales of all of the collateral would be sufficient to satisfy the loan obligations secured by our first or second priority liens. There is also a risk that such collateral securing our investments will decrease in value over time, will be difficult to sell in a timely manner, will be difficult to appraise and will fluctuate in value based upon the success of the portfolio company and market conditions. If such proceeds are not sufficient to repay amounts outstanding under the loan obligations secured by our second priority liens, then we, to the extent not repaid from the proceeds of the sale of the collateral, will only have an unsecured claim against the company's remaining assets, if any.
We are a non-diversified investment company within the meaning of the 1940 Act, and therefore we are not limited with respect to the proportion of our assets that may be invested in securities of a single issuer.
We are classified as a non-diversified investment company within the meaning of the 1940 Act, which means that we are not limited by the 1940 Act with respect to the proportion of our assets that we may invest in securities of a single issuer. To the extent that we assume large positions in the securities of a small number of issuers, our net asset value may fluctuate to a greater extent than that of a diversified investment company as a result of changes in the financial condition or the market's assessment of the issuer. We may also be more susceptible to any single economic or regulatory occurrence than a diversified investment company. Beyond our RIC asset diversification requirements, we do not have fixed guidelines for diversification, and our investments could be concentrated in relatively few portfolio companies. See "Risk Factors — Risks Relating to Our Business and Structure — We will be subject to corporate-level U.S. federal income tax if we are unable to qualify as a RIC under Subchapter M of the Code."
We generally will not control our portfolio companies.
We do not, and do not expect to, control the decision making in many of our portfolio companies, even though we may have board representation or board observation rights, and our debt agreements may contain certain restrictive covenants. As a result, we are subject to the risk that a portfolio company in which we invest will make business decisions with which we disagree and the management of such company will take risks or otherwise act in ways that do not serve our interests as debt investors or minority equity holders. Due to the lack of liquidity for our investments in non-traded companies, we may not be able to dispose of our interests in our portfolio companies as readily as we would like or at an appropriate valuation. As a result, a portfolio company may make decisions that would decrease the value of our portfolio holdings.
Defaults by our portfolio companies will harm our operating results.
A portfolio company's failure to satisfy financial or operating covenants imposed by us or other lenders could lead to non-payment of interest and other defaults and, potentially, termination of its loans and
40
foreclosure on its secured assets, which could trigger cross-defaults under other agreements and jeopardize a portfolio company's ability to meet its obligations under the debt or equity securities that we hold. We may incur expenses to the extent necessary to seek recovery upon default or to negotiate new terms, which may include the waiver of certain financial covenants, with a defaulting portfolio company.
Any unrealized depreciation we experience in our portfolio may be an indication of future realized losses, which could reduce our income and gains available for distribution.
As a BDC, we are required to carry our investments at market value or, if no market value is ascertainable, at the fair value as determined in good faith by our Board of Directors. Decreases in the market values or fair values of our investments will be recorded as unrealized depreciation. Any unrealized depreciation in our portfolio could be an indication of a portfolio company's inability to meet its repayment obligations to us with respect to affected loans or a potential impairment of the value of affected equity investments. This could result in realized losses in the future and ultimately in reductions of our income and gains available for distribution in future periods.
Prepayments of our debt investments by our portfolio companies could adversely impact our results of operations and reduce our return on equity.
We are subject to the risk that the investments we make in our portfolio companies may be repaid prior to maturity. When this occurs, we will generally reinvest these proceeds in temporary investments, pending their future investment in new portfolio companies. These temporary investments will typically have substantially lower yields than the debt being prepaid and we could experience significant delays in reinvesting these amounts. Any future investment in a new portfolio company may also be at lower yields than the debt that was repaid. As a result, our results of operations could be materially adversely affected if one or more of our portfolio companies elect to prepay amounts owed to us. Additionally, prepayments could negatively impact our return on equity, which could result in a decline in the market price of our securities.
Changes in interest rates may affect our cost of capital, net investment income and value of our investments.
Some of our debt investments will bear interest at variable rates and may be negatively affected by changes in market interest rates. An increase in market interest rates would increase the interest costs and reduce the cash flows of our portfolio companies that have variable rate debt instruments, a situation which could reduce the value of the investment. The value of our investments could also be reduced from an increase in market interest rates as rates available to investors could make an investment in our securities less attractive than alternative investments. In addition, an increase in interest rates would make it more expensive for us to use debt to finance our investments. As a result, a significant increase in market interest rates could increase our cost of capital, which would reduce our net investment income. Conversely, decreases in market interest rates could negatively impact the interest income from our variable rate debt investments. A decrease in market interest rates may also have an adverse impact on our returns by requiring us to accept lower yields on our debt investments and by increasing the risk that our portfolio companies will prepay our debt investments, resulting in the need to redeploy capital at potentially lower rates. See further discussion and analysis at "Item 7A. Quantitative and Qualitative Disclosures about Market Risk".
We may not realize gains from our equity investments.
Certain investments that we have made in the past and may make in the future include warrants or other equity securities. Investments in equity securities involve a number of significant risks, including the risk of further dilution as a result of additional issuances, inability to access additional capital and failure to pay current distributions. Investments in preferred securities involve special risks, such as the risk of deferred distributions, credit risk, illiquidity and limited voting rights. In addition, we may from time to time make non-control, equity investments in portfolio companies. Our goal is ultimately to realize gains upon our disposition of such equity interests. However, the equity interests we receive may not appreciate in value and,
41
in fact, may decline in value. Accordingly, we may not be able to realize gains from our equity interests, and any gains that we do realize on the disposition of any equity interests may not be sufficient to offset any other losses we experience. We also may be unable to realize any value if a portfolio company does not have a liquidity event, such as a sale of the business, recapitalization or public offering, which would allow us to sell the underlying equity interests. We often seek puts or similar rights to give us the right to sell our equity securities back to the portfolio company issuer; however, we may be unable to exercise these put rights for the consideration provided in our investment documents if the issuer is in financial distress.
Our investments in foreign securities may involve significant risks in addition to the risks inherent in U.S. investments.
Our investment strategy contemplates potential investments in debt securities of foreign companies. Investing in foreign companies may expose us to additional risks not typically associated with investing in securities of U.S. companies. These risks include changes in exchange control regulations, political and social instability, expropriation, imposition of foreign taxes, less liquid markets and less available information than is generally the case in the U.S., higher transaction costs, less government supervision of exchanges, brokers and issuers, less developed bankruptcy laws, difficulty in enforcing contractual obligations, lack of uniform accounting and auditing standards and greater price volatility.
Although most of our investments will be U.S. dollar denominated, any investments denominated in a foreign currency will be subject to the risk that the value of a particular currency will change in relation to one or more other currencies. Among the factors that may affect currency values are trade balances, the level of short-term interest rates, differences in relative values of similar assets in different currencies, long-term opportunities for investment and capital appreciation, and political developments.
RISKS RELATING TO OUR SECURITIES
Shares of closed-end investment companies, including BDCs, may trade at a discount to their net asset value.
Shares of closed-end investment companies, including BDCs, may trade at a discount to net asset value. This characteristic of closed-end investment companies and BDCs is separate and distinct from the risk that our net asset value per share may decline. We cannot predict whether our common stock will trade at, above or below net asset value. In addition, if our common stock trades below our net asset value per share, we will generally not be able to issue additional common stock at the market price unless our stockholders approve such a sale and our Board of Directors makes certain determinations. See "Risk Factors — Risks Relating to Our Business and Structure — Stockholders may incur dilution if we sell shares of our common stock in one or more offerings at prices below the then current net asset value per share of our common stock or issue securities to subscribe to, convert to or purchase shares of our common stock" for a discussion related to us issuing shares of our common stock below net asset value.
We may be unable to invest a significant portion of the net proceeds from an offering or from exiting an investment or other capital on acceptable terms, which could harm our financial condition and operating results.
Delays in investing the net proceeds raised in an offering or other capital raised or proceeds resulting from exiting an investment may cause our performance to be worse than that of other fully invested BDCs or other lenders or investors pursuing comparable investment strategies. We cannot assure you that we will be able to identify any investments that meet our investment objective or that any investment that we make will produce a positive return. We may be unable to invest the net proceeds of any offering or other capital raised or proceeds resulting from exiting an investment on acceptable terms within the time period that we anticipate or at all, which could harm our financial condition and operating results.
We anticipate that, depending on market conditions and the amount of the capital, it may take us a substantial period of time to invest substantially all the capital in securities meeting our investment objective.
42
During this period, we may invest the capital primarily in marketable securities and idle funds investments, which generally consist of debt investments, independently rated debt investments, certificates of deposit with financial institutions, diversified bond funds and publicly traded debt and equity investments and may produce returns that are significantly lower than the returns which we expect to achieve when our portfolio is fully invested in securities meeting our investment objective. Most of the debt investments that meet our investment criteria are, or would be if rated, below investment grade quality. Indebtedness of below investment grade quality, which is often referred to as "junk," is regarded as having predominantly speculative characteristics with respect to the issuer's capacity to pay interest and repay principal. As a result, any distributions that we pay during such period may be substantially lower than the distributions that we may be able to pay when our portfolio is fully invested in securities meeting our investment objective. In addition, until such time as the net proceeds of any offering or from exiting an investment or other capital are invested in new securities meeting our investment objective, the market price for our securities may decline. Thus, the initial return on your investment may be lower than when, if ever, our portfolio is fully invested in securities meeting our investment objective.
Investing in our securities may involve a high degree of risk.
The investments we make in accordance with our investment objective may result in a higher amount of risk than alternative investment options and a higher risk of volatility or loss of principal. Our investments in portfolio companies involve higher levels of risk, and therefore, an investment in our securities may not be suitable for someone with lower risk tolerance.
The market price of our securities may be volatile and fluctuate significantly.
Fluctuations in the trading prices of our securities may adversely affect the liquidity of the trading market for our securities and, if we seek to raise capital through future securities offerings, our ability to raise such capital. The market price and liquidity of the market for our securities may be significantly affected by numerous factors, some of which are beyond our control and may not be directly related to our operating performance. These factors include:
43
Provisions of the Maryland General Corporation Law and our articles of incorporation and bylaws could deter takeover attempts and have an adverse impact on the price of our common stock.
The Maryland General Corporation Law and our articles of incorporation and bylaws contain provisions that may have the effect of discouraging, delaying or making difficult a change in control of our company or the removal of our incumbent directors. The existence of these provisions, among others, may have a negative impact on the price of our common stock and may discourage third-party bids for ownership of our company. These provisions may prevent any premiums being offered to you for our common stock.
The Notes are unsecured and therefore effectively subordinated to any current or future secured indebtedness, including indebtedness under the Credit Facility.
The Notes are not secured by any of our assets or any of the assets of our subsidiaries and rank equally in right of payment with all of our existing and future unsubordinated, unsecured indebtedness. As a result, the Notes are effectively subordinated to any secured indebtedness we or our subsidiaries have currently incurred and may incur in the future (or any indebtedness that is initially unsecured to which we subsequently grant security) to the extent of the value of the assets securing such indebtedness. In any liquidation, dissolution, bankruptcy or other similar proceeding, the holders of any of our existing or future secured indebtedness and the secured indebtedness of our subsidiaries may assert rights against the assets pledged to secure that indebtedness in order to receive full payment of their indebtedness before the assets may be used to pay other creditors, including the holders of the Notes. As of December 31, 2019, we had $300.0 million outstanding under the Credit Facility out of $705.0 million in commitments. The indebtedness under the Credit Facility is senior to the Notes to the extent of the value of the assets securing such indebtedness.
The Notes are structurally subordinated to the indebtedness and other liabilities of our subsidiaries.
The Notes are obligations exclusively of Main Street Capital Corporation and not of any of our subsidiaries. None of our subsidiaries is a guarantor of the Notes, and the Notes are not required to be guaranteed by any subsidiaries we may acquire or create in the future. In addition, several of our subsidiaries, specifically the Funds, maintain significant indebtedness and as a result the Notes are structurally subordinated to the indebtedness of these subsidiaries. For example, as of December 31, 2019, the Funds had collectively issued $311.8 million of the current regulatory maximum of $350.0 million of SBA-guaranteed debentures, which are included in our consolidated financial statements. The assets of such subsidiaries are not directly available to satisfy the claims of our creditors, including holders of the Notes. See "Management's Discussion and Analysis of Financial Condition and Results of Operations — Liquidity and Capital Resources" for more detail on the SBA-guaranteed debentures.
Except to the extent we are a creditor with recognized claims against our subsidiaries, all claims of other creditors of our subsidiaries have priority over our equity interests in such subsidiaries (and therefore the claims of our creditors, including holders of the Notes) with respect to the assets of such subsidiaries. Even if we are recognized as a creditor of one or more of our subsidiaries, our claims would still be effectively subordinated to any security interests in the assets of any such subsidiary and to any indebtedness or other liabilities of any such subsidiary senior to our claims. Consequently, the Notes are structurally subordinated to all indebtedness, including the SBA-guaranteed debentures, and other liabilities of any of our subsidiaries and any subsidiaries that we may in the future acquire or establish. In addition, our subsidiaries may incur substantial additional indebtedness in the future, all of which would be structurally senior to the Notes.
44
The Notes may or may not have an established trading market. If a trading market in the Notes is developed, it may not be maintained.
The Notes may or may not have an established trading market. If a trading market in the Notes is developed, it may not be maintained. If the Notes are traded, they may trade at a discount to their initial offering price depending on prevailing interest rates, the market for similar securities, our credit ratings, our financial condition or other relevant factors. Accordingly, we cannot assure you that a liquid trading market has been or will develop for the Notes, that you will be able to sell your Notes at a particular time or that the price you receive when you sell will be favorable. To the extent an active trading market does not develop or is not maintained, the liquidity and trading price for the Notes may be harmed. Accordingly, you may be required to bear the financial risk of an investment in the Notes for an indefinite period of time.
A downgrade, suspension or withdrawal of the credit rating assigned by a rating agency to us or the Notes, if any, or change in the debt markets could cause the liquidity or market value of the Notes to decline significantly.
Our credit ratings are an assessment by rating agencies of our ability to pay our debts when due. Consequently, real or anticipated changes in our credit ratings will generally affect the market value of the Notes. These credit ratings may not reflect the potential impact of risks relating to the structure or marketing of the Notes. Credit ratings are not a recommendation to buy, sell or hold any security, and may be revised or withdrawn at any time by the issuing organization in its sole discretion. We undertake no obligation to maintain our credit ratings or to advise holders of Notes of any changes in our credit ratings. The Notes are currently rated by Standard & Poor's Ratings Services. There can be no assurance that our credit ratings will remain for any given period of time or that such credit ratings will not be lowered or withdrawn entirely by the rating agency if in their judgment future circumstances relating to the basis of the credit ratings, such as adverse changes in our company, so warrant. The conditions of the financial markets and prevailing interest rates have fluctuated in the past and are likely to fluctuate in the future, which could have an adverse effect on the market prices of the Notes.
The indentures under which the Notes were issued contain limited protection for holders of the Notes.
The indentures under which the Notes were issued offer limited protection to holders of the Notes. The terms of the indentures and the Notes do not restrict our or any of our subsidiaries' ability to engage in, or otherwise be a party to, a variety of corporate transactions, circumstances or events that could have an adverse impact on investments in the Notes. In particular, the terms of the indentures and the Notes do not place any restrictions on our or our subsidiaries' ability to:
45
Furthermore, the terms of the indentures and the Notes do not protect holders of the Notes in the event that we experience changes (including significant adverse changes) in our financial condition, results of operations or credit ratings, if any, as they do not require that we or our subsidiaries adhere to any financial tests or ratios or specified levels of net worth, revenues, income, cash flow or liquidity.
Our ability to recapitalize, incur additional debt and take a number of other actions that are not limited by the terms of the Notes may have important consequences for you as a holder of the Notes, including making it more difficult for us to satisfy our obligations with respect to the Notes or negatively affecting the trading value of the Notes.
Other debt we issue or incur in the future could contain more protections for its holders than the indentures and the Notes, including additional covenants and events of default. For example, the indentures under which the Notes are issued do not contain cross-default provisions like those that are contained in the Credit Facility. The issuance or incurrence of any such debt with incremental protections could affect the market for and trading levels and prices of the Notes.
The optional redemption provision may materially adversely affect your return on the Notes.
The Notes are redeemable in whole or in part upon certain conditions at any time or from time to time at our option. We may choose to redeem the Notes at times when prevailing interest rates are lower than the interest rate paid on the Notes. In this circumstance, you may not be able to reinvest the redemption proceeds in a comparable security at an effective interest rate as high as the Notes being redeemed.
We may not be able to repurchase the Notes upon a Change of Control Repurchase Event.
We may not be able to repurchase the Notes upon certain change in control events described in the indentures under which the Notes were issued (each, a "Change of Control Repurchase Event") because we may not have sufficient funds. Upon a Change of Control Repurchase Event, holders of the Notes may require us to repurchase for cash some or all of the Notes at a repurchase price equal to 100% of the aggregate principal amount of the Notes being repurchased, plus accrued and unpaid interest to, but not including, the repurchase date. The terms of our Credit Facility provide that certain change of control events will constitute an event of default thereunder entitling the lenders to accelerate any indebtedness outstanding under our Credit Facility at that time and to terminate the Credit Facility. In addition, the occurrence of a Change of Control Repurchase Event enabling the holders of the Notes to require the mandatory purchase of the Notes would constitute an event of default under our Credit Facility entitling the lenders to accelerate any indebtedness outstanding under our Credit Facility at that time and to terminate the Credit Facility. Our and our subsidiaries' future financing facilities may contain similar restrictions and provisions. Our failure to purchase such tendered Notes upon the occurrence of such Change of Control Repurchase Event would cause an event of default under the indentures governing the Notes and a cross-default under the agreements governing certain of our other indebtedness, which may result in the acceleration of such indebtedness requiring us to repay that indebtedness immediately. If a Change of Control Repurchase Event were to occur, we may not have sufficient funds to repay any such accelerated indebtedness.
46
If we default on our obligations to pay our other indebtedness, we may not be able to make payments on the Notes.
As of December 31, 2019, we had approximately $1,121.8 million of principal indebtedness, including $300.0 million outstanding under the Credit Facility, $311.8 million outstanding from SBA-guaranteed debentures, $185.0 million of the 4.50% Notes due 2022 and $325.0 million of the 5.20% Notes outstanding. Any default under the agreements governing our indebtedness, including a default under the Credit Facility, under the Notes or under other indebtedness to which we may be a party that is not waived by the required lenders or debt holders, and the remedies sought by the holders of such indebtedness could make us unable to pay principal, premium, if any, and interest on the Notes and substantially decrease the market value of the Notes. If we are unable to generate sufficient cash flow and are otherwise unable to obtain funds necessary to meet required payments of principal, premium, if any, and interest on our indebtedness, or if we otherwise fail to comply with the various covenants, including financial and operating covenants, in the instruments governing our indebtedness, we could be in default under the terms of the agreements governing such indebtedness. In the event of such default, the holders of such indebtedness could elect to declare all the funds borrowed thereunder to be due and payable, together with accrued and unpaid interest, the lenders under the Credit Facility or other debt we may incur in the future could elect to terminate their commitments, cease making further loans and institute foreclosure proceedings against our assets, and we could be forced into bankruptcy or liquidation. Our ability to generate sufficient cash flow in the future is, to some extent, subject to general economic, financial, competitive, legislative and regulatory factors as well as other factors that are beyond our control. We cannot assure you that our business will generate cash flow from operations, or that future borrowings will be available to us under the Credit Facility or otherwise, in an amount sufficient to enable us to meet our payment obligations under the Notes and our other debt and to fund other liquidity needs.
If our operating performance declines and we are not able to generate sufficient cash flow to service our debt obligations, we may in the future need to refinance or restructure our debt, including the Notes, sell assets, reduce or delay capital investments, seek to raise additional capital or seek to obtain waivers from the required lenders under the Credit Facility or the required holders of the Notes or other debt that we may incur in the future to avoid being in default. If we are unable to implement one or more of these alternatives, we may not be able to meet our payment obligations under the Notes and our other debt. If we breach our covenants under the Credit Facility, the Notes or other debt and seek a waiver, we may not be able to obtain a waiver from the required lenders or debt holders. If this occurs, we would be in default under the Credit Facility, the Notes or other debt, the lenders or debt holders could exercise their rights as described above, and we could be forced into bankruptcy or liquidation. If we are unable to repay debt, lenders having secured obligations could proceed against the collateral securing the debt. Because the Credit Facility has, and any future credit facilities will likely have, customary cross-default provisions, if the indebtedness under the Notes, the Credit Facility or under any future credit facility is accelerated, we may be unable to repay or finance the amounts due.
We may in the future determine to issue preferred stock, which could adversely affect the market value of our common stock.
The issuance of shares of preferred stock with dividend or conversion rights, liquidation preferences or other economic terms favorable to the holders of preferred stock could adversely affect the market price for our common stock by making an investment in the common stock less attractive. In addition, the dividends on any preferred stock we issue must be cumulative. Payment of dividends and repayment of the liquidation preference of preferred stock must take preference over any dividends or other payments to our common stockholders, and holders of preferred stock are not subject to any of our expenses or losses and are not entitled to participate in any income or appreciation in excess of their stated preference (other than convertible preferred stock that converts into common stock). In addition, under the 1940 Act, preferred stock constitutes a "senior security" for purposes of the asset coverage test.
47
Item 1B. Unresolved Staff Comments
None.
We do not own any real estate or other physical properties materially important to our operations. Currently, we lease office space in Houston, Texas for our corporate headquarters.
We may, from time to time, be involved in litigation arising out of our operations in the normal course of business or otherwise. Furthermore, third parties may seek to impose liability on us in connection with the activities of our portfolio companies. While the outcome of any current legal proceedings cannot at this time be predicted with certainty, we do not expect any current matters will materially affect our financial condition or results of operations; however, there can be no assurance whether any pending legal proceedings will have a material adverse effect on our financial condition or results of operations in any future reporting period.
Item 4. Mine Safety Disclosures
Not applicable.
48
Item 5. Market for Registrant's Common Equity, Related Stockholder Matters and Issuer Purchases of Equity Securities
COMMON STOCK, HOLDERS AND DISTRIBUTIONS
Our common stock is traded on the New York Stock Exchange ("NYSE") under the symbol "MAIN."
The following table sets forth, for the periods indicated, the range of high and low closing prices of our common stock as reported on the NYSE, and the sales price as a percentage of the net asset value per share of our common stock.
| |
|
Price Range | Premium of High Sales Price to NAV(2) |
Premium of Low Sales Price to NAV(2) |
||||||||||||
|---|---|---|---|---|---|---|---|---|---|---|---|---|---|---|---|---|
| |
NAV(1) | High | Low | |||||||||||||
Year ending December 31, 2020 |
||||||||||||||||
First Quarter (through February 26,2020) |
* | $ | 45.00 | $ | 39.25 | * | * | |||||||||
Year ending December 31, 2019 |
||||||||||||||||
Fourth Quarter |
$ | 23.91 | $ | 43.68 | $ | 41.27 | 83% | 73% | ||||||||
Third Quarter |
24.20 | 44.34 | 40.90 | 83% | 69% | |||||||||||
Second Quarter |
24.17 | 41.80 | 37.49 | 73% | 55% | |||||||||||
First Quarter |
24.41 | 39.21 | 33.99 | 61% | 39% | |||||||||||
Year ending December 31, 2018 |
||||||||||||||||
Fourth Quarter |
$ | 24.09 | $ | 39.06 | $ | 32.58 | 62% | 35% | ||||||||
Third Quarter |
24.69 | 40.68 | 38.05 | 65% | 54% | |||||||||||
Second Quarter |
23.96 | 38.86 | 36.76 | 62% | 53% | |||||||||||
First Quarter |
23.67 | 39.90 | 35.41 | 69% | 50% | |||||||||||
On February 26, 2020, the last sale price of our common stock on the NYSE was $40.12 per share, and there were approximately 417 holders of record of the common stock which did not include stockholders for whom shares are held in "nominee" or "street name." The net asset value per share of our common stock on December 31, 2019 was $23.91, and the premium of the February 26, 2020 closing price of our common stock was 68% to this net asset value per share.
Shares of BDCs may trade at a market price that is less than the value of the net assets attributable to those shares. The possibility that our shares of common stock will trade at a discount from net asset value per share or at premiums that are unsustainable over the long term are separate and distinct from the risk that our net asset value per share will decrease. It is not possible to predict whether our common stock will trade at, above, or below net asset value per share. Since our IPO in October 2007, our shares of common stock have traded at prices both less than and exceeding our net asset value per share.
We currently pay regular monthly dividends and semiannual supplemental dividends to our stockholders. Our monthly dividends, if any, will be determined by our Board of Directors on a quarterly basis. Our semiannual supplemental dividends, if any, will also be determined by our Board of Directors on a periodic basis. During 2019, we paid supplemental dividends of $0.250 per share in June 2019 and $0.240 per share in December 2019, regular monthly dividends of $0.195 per share for each month of January through March 2019, regular monthly dividends of $0.200 per share for each month of April through June 2019 and regular
49
monthly dividends of $0.205 per share for each month of July through December 2019, with such dividends totaling $182.8 million, or $2.905 per share. The 2019 regular monthly dividends, which total $151.6 million, or $2.415 per share, represent a 5.2% increase from the regular monthly dividends paid per share for the year ended 2018. For tax purposes, the 2019 dividends, which included the effects of dividends on an accrual basis, total $2.915 per share and were comprised of (i) ordinary income totaling approximately $2.636 per share, (ii) qualified dividend income totaling approximately $0.249 per share and (iii) long term capital gain totaling approximately $0.031 per share. As we have previously discussed, it is our current intention to fully absorb our semi-annual supplemental dividends into our regular monthly dividends by gradually reducing our semi-annual supplemental dividends while increasing our regular monthly dividends over multiple years. Our ability to maintain or grow our level of total annual dividends during the transition period will depend on many factors, including some that are outside of our control. Factors that may impact our level of total dividends include, but are not limited to, market interest rate levels and related volatility, level of investment originations and repayments, overall performance of our investment portfolio and the overall performance of the specific industries and markets that we invest in and the overall U.S. economy.
In accordance with the IRC sections 871(k) and 881(e), the following percentages represent the portion of our dividends that constitute interest related dividends and short-term capital gains dividends for non-U.S. residents and foreign corporations. Including the long-term capital gains discussed above, the following percentages represent the total dividends which are exempt from U.S. withholding tax.
Payment Dates
|
Interest-Related Dividends and Short-Term Capital Gain Dividend |
Distributions Exempt from U.S. Withholding Tax(1) |
|||||
|---|---|---|---|---|---|---|---|
2/15/2019 |
52.51% | 68.15% | |||||
3/15/2019 to 4/15/2019 |
68.15% | 68.15% | |||||
5/15/2019 |
33.46% | 33.46% | |||||
6/14/2019 |
35.68% | 35.68% | |||||
6/25/2019 to 1/15/2020 |
56.22% | 56.22% | |||||
To the extent non-U.S. resident taxes were withheld on ordinary dividends distributed, this information may be considered in connection with any claims for refund of such taxes to be filed by the non-U.S. resident stockholder with the Internal Revenue Service.
To obtain and maintain RIC tax treatment, we must, among other things, distribute at least 90% of our net ordinary taxable income and realized net short-term capital gains in excess of realized net long-term capital losses, if any. We will be subject to a 4% non-deductible U.S. federal excise tax on certain undistributed taxable income unless we distribute in a timely manner an amount at least equal to the sum of (1) 98% of our net ordinary taxable income for each calendar year, (2) 98.2% of our capital gain net income for the one-year period ending December 31 in that calendar year and (3) any taxable income recognized, but not distributed, in preceding years on which we paid no U.S. federal income tax. Dividends declared and paid by us in a year will generally differ from taxable income for that year, as such dividends may include the distribution of current year taxable income, less amounts carried over into the following year, and the distribution of prior year taxable income carried over into and distributed in the current year. For amounts we carry over into the following year, we will be required to pay the 4% U.S. federal excise tax on the excess of 98% of our annual investment company taxable income and 98.2% of our capital gain net income over our distributions for the year. We may retain for investment some or all of our net capital gains (i.e., realized net long-term capital gains in excess of realized net short-term capital losses) and treat such amounts as deemed distributions to our stockholders. If we do this, our stockholders will be treated as if they had received actual distributions of the capital gains we retained and then reinvested the net after-tax proceeds in our common stock. In general, our stockholders also would be eligible to claim a tax credit (or, in certain circumstances, a
50
tax refund) equal to their allocable shares of the tax we paid on the capital gains deemed distributed to them. We can offer no assurance that we will achieve results that will permit the payment of any cash distributions and, if we issue senior securities, we may be prohibited from making distributions if doing so causes us to fail to maintain the asset coverage ratios stipulated by the 1940 Act or if distributions are limited by the terms of any of our borrowings.
We may distribute taxable dividends that are payable in part in our stock. Under certain applicable provisions of the Code and the Treasury regulations, distributions payable by us in cash or in shares of stock (at the stockholders election) would satisfy the Annual Distribution Requirement. The Internal Revenue Service has issued guidance providing that a dividend payable in stock or in cash at the election of the stockholders will be treated as a taxable dividend eligible for the dividends paid deduction provided that at least 20% of the total dividend is payable in cash and certain other requirements are satisfied. Taxable stockholders receiving such dividends will be required to include the full amount of the dividend as ordinary income (or as long-term capital gain to the extent such dividend is properly reported as a capital gain dividend), to the extent of our current and accumulated earnings and profits for U.S. federal income tax purposes. As a result, a U.S. stockholder may be required to pay tax with respect to such dividends in excess of any cash received. If a U.S. stockholder sells the stock it receives as a dividend in order to pay this tax, the sales proceeds may be less than the amount included in income with respect to the dividend, depending on the market price of our stock at the time of the sale. Furthermore, with respect to non-U.S. stockholders, we may be required to withhold U.S. tax with respect to such dividends, including in respect of all or a portion of such dividend that is payable in stock. In addition, if a significant number of our stockholders determine to sell shares of our stock in order to pay taxes owed on dividends, it may put downward pressure on the trading price of our stock.
We have adopted a dividend reinvestment plan ("DRIP") that provides for the reinvestment of dividends on behalf of our stockholders, unless a stockholder has elected to receive dividends in cash. As a result, if we declare a cash dividend, our stockholders who have not "opted out" of the DRIP by the dividend record date will have their cash dividend automatically reinvested into additional shares of MSCC common stock. The share requirements of the DRIP may be satisfied through the issuance of new shares of common stock or through open market purchases of common stock by the DRIP plan administrator. Newly issued shares will be valued based upon the final closing price of MSCC's common stock on a valuation date determined for each dividend by our Board of Directors. Shares purchased in the open market to satisfy the DRIP requirements will be valued based upon the average price of the applicable shares purchased by the DRIP plan administrator, before any associated brokerage or other costs. Our DRIP is administered by its transfer agent on behalf of our record holders and participating brokerage firms. Brokerage firms and other financial intermediaries may decide not to participate in our DRIP but may provide a similar dividend reinvestment plan for their clients.
SALES OF UNREGISTERED SECURITIES
During the year ended December 31, 2019, we issued a total of 441,927 shares of our common stock under the DRIP. These issuances were not subject to the registration requirements of the Securities Act of 1933, as amended. The aggregate value of the shares of our common stock issued under the DRIP during 2019 was approximately $18.1 million.
PURCHASES OF EQUITY SECURITIES
Upon vesting of restricted stock awarded pursuant to our employee equity compensation plan, shares may be withheld to meet applicable tax withholding requirements. Any withheld shares are treated as common stock purchases by the Company in our consolidated financial statements as they reduce the number of shares received by employees upon vesting (see "Purchase of vested stock for employee payroll tax withholding" in the consolidated statements of changes in net assets for share amounts withheld).
51
STOCK PERFORMANCE GRAPH
The following graph compares the stockholder return on our common stock from October 5, 2007 to December 31, 2019 with the S&P 500 Index, the Russell 2000 Index, the KBW Regional Bank Index and the Main Street Peer Group (as defined below). This comparison assumes $100.00 was invested on October 5, 2007 (the date our common stock began to trade in connection with our initial public offering) in our common stock and in the comparison groups and assumes the reinvestment of all cash dividends prior to any tax effect. The comparisons in the graph below are based on historical data and are not intended to forecast the possible future performance of our common stock.
COMPARISON OF STOCKHOLDER RETURN(1)
Among Main Street Capital Corporation, the S&P 500 Index, the Russell 2000 Index, the KBW
Regional Bank Index, and the Main Street Peer Group(2)
(For the Period
October 5, 2007 to December 31, 2019)
TOTAL RETURN PERFORMANCE SINCE IPO
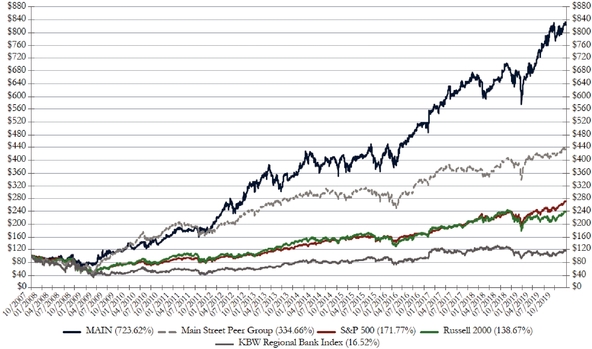
52
Item 6. Selected Financial Data
The selected financial and other data as of and for the years ended December 31, 2019, 2018, 2017, 2016 and 2015 have been derived from consolidated financial statements that have been audited by Grant Thornton LLP, an independent registered public accounting firm. You should read this selected financial and other data in conjunction with our "Management's Discussion and Analysis of Financial Condition and Results of Operations" and the consolidated financial statements and related notes included in this Annual Report on Form 10-K.
| |
Twelve Months Ended December 31, | |||||||||||||||
|---|---|---|---|---|---|---|---|---|---|---|---|---|---|---|---|---|
| |
2019 | 2018 | 2017 | 2016 | 2015 | |||||||||||
| |
(dollars in thousands, except per share amounts) |
|||||||||||||||
Statement of operations data: |
||||||||||||||||
Investment income: |
||||||||||||||||
Total interest, fee and dividend income |
243,373 | $ | 233,355 | $ | 205,741 | $ | 178,165 | $ | 163,603 | |||||||
Interest from idle funds and other |
— | — | — | 174 | 986 | |||||||||||
| | | | | | | | | | | | | | | | | |
Total investment income |
243,373 | 233,355 | 205,741 | 178,339 | 164,589 | |||||||||||
| | | | | | | | | | | | | | | | | |
Expenses: |
||||||||||||||||
Interest |
(50,258 | ) | (43,493 | ) | (36,479 | ) | (33,630 | ) | (32,115 | ) | ||||||
Compensation |
(19,792 | ) | (18,966 | ) | (18,560 | ) | (16,408 | ) | (14,852 | ) | ||||||
General and administrative |
(12,546 | ) | (11,868 | ) | (11,674 | ) | (9,284 | ) | (8,621 | ) | ||||||
Share-based compensation |
(10,083 | ) | (9,151 | ) | (10,027 | ) | (8,304 | ) | (6,262 | ) | ||||||
Expenses allocated to the External Investment Manager |
6,672 | 6,768 | 6,370 | 5,089 | 4,335 | |||||||||||
| | | | | | | | | | | | | | | | | |
Total expenses |
(86,007 | ) | (76,710 | ) | (70,370 | ) | (62,537 | ) | (57,515 | ) | ||||||
| | | | | | | | | | | | | | | | | |
Net investment income |
157,366 | 156,645 | 135,371 | 115,802 | 107,074 | |||||||||||
Total net realized gain (loss) from investments |
(15,112 | ) | 1,341 | 16,182 | 29,389 | (21,316 | ) | |||||||||
Realized loss on extinguishment of debt |
(5,689 | ) | (2,896 | ) | (5,217 | ) | — | — | ||||||||
Total net unrealized appreciation (depreciation) from investments |
(10,204 | ) | 17,981 | 42,545 | (6,576 | ) | 10,871 | |||||||||
Total net unrealized appreciation (depreciation) from SBIC debentures |
4,450 | 1,294 | 6,212 | (943 | ) | (879 | ) | |||||||||
Income tax benefit (provision) |
(1,242 | ) | (6,152 | ) | (24,471 | ) | 1,227 | 8,687 | ||||||||
| | | | | | | | | | | | | | | | | |
Net increase in net assets resulting from operations attributable to common stock |
$ | 129,569 | $ | 168,213 | $ | 170,622 | $ | 138,899 | $ | 104,437 | ||||||
| | | | | | | | | | | | | | | | | |
| | | | | | | | | | | | | | | | | |
| | | | | | | | | | | | | | | | | |
Net investment income per share — basic and diluted |
$ | 2.50 | $ | 2.60 | $ | 2.39 | $ | 2.23 | $ | 2.18 | ||||||
Net increase in net assets resulting from operations attributable to common stock per share — basic and diluted |
$ | 2.06 | $ | 2.80 | $ | 3.01 | $ | 2.67 | $ | 2.13 | ||||||
Weighted-average shares outstanding — basic and diluted |
62,960,591 | 60,176,843 | 56,691,913 | 52,025,002 | 49,071,492 | |||||||||||
53
| |
As of December 31, | |||||||||||||||
|---|---|---|---|---|---|---|---|---|---|---|---|---|---|---|---|---|
| |
2019 | 2018 | 2017 | 2016 | 2015 | |||||||||||
| |
|
(dollars in thousands) |
||||||||||||||
Balance sheet data: |
||||||||||||||||
Assets: |
||||||||||||||||
Total portfolio investments at fair value |
$ | 2,602,324 | $ | 2,453,909 | $ | 2,171,305 | $ | 1,996,906 | $ | 1,799,996 | ||||||
Marketable securities and idle funds investments |
— | — | — | — | 3,693 | |||||||||||
Cash and cash equivalents |
55,246 | 54,181 | 51,528 | 24,480 | 20,331 | |||||||||||
Interest receivable and other assets |
50,458 | 40,875 | 38,725 | 37,123 | 37,638 | |||||||||||
Deferred financing costs, net of accumulated amortization |
3,521 | 4,461 | 3,837 | 12,645 | 13,267 | |||||||||||
Deferred tax asset, net |
— | — | — | 9,125 | 4,003 | |||||||||||
| | | | | | | | | | | | | | | | | |
Total assets |
$ | 2,711,549 | $ | 2,553,426 | $ | 2,265,395 | $ | 2,080,279 | $ | 1,878,928 | ||||||
| | | | | | | | | | | | | | | | | |
| | | | | | | | | | | | | | | | | |
| | | | | | | | | | | | | | | | | |
Liabilities and net assets: |
||||||||||||||||
Credit facility |
$ | 300,000 | $ | 301,000 | $ | 64,000 | $ | 343,000 | $ | 291,000 | ||||||
SBIC debentures at fair value(1) |
306,188 | 338,186 | 288,483 | 239,603 | 223,660 | |||||||||||
5.20% Notes due 2024 |
324,595 | — | — | — | — | |||||||||||
4.50% Notes due 2022 |
183,229 | 182,622 | 182,015 | — | — | |||||||||||
4.50% Notes due 2019 |
— | 174,338 | 173,616 | 175,000 | 175,000 | |||||||||||
6.125% Notes |
— | — | 89,057 | 90,655 | 90,738 | |||||||||||
Accounts payable and other liabilities |
24,532 | 17,962 | 20,168 | 14,205 | 12,292 | |||||||||||
Payable for securities purchased |
— | 28,254 | 40,716 | 2,184 | 2,311 | |||||||||||
Interest payable |
7,292 | 6,041 | 5,273 | 4,103 | 3,959 | |||||||||||
Dividend payable |
13,174 | 11,948 | 11,146 | 10,048 | 9,074 | |||||||||||
Deferred tax liability, net |
16,149 | 17,026 | 10,553 | — | — | |||||||||||
| | | | | | | | | | | | | | | | | |
Total liabilities |
1,175,159 | 1,077,377 | 885,027 | 878,798 | 808,034 | |||||||||||
Total net asset value |
1,536,390 | 1,476,049 | 1,380,368 | 1,201,481 | 1,070,894 | |||||||||||
| | | | | | | | | | | | | | | | | |
Total liabilities and net assets |
$ | 2,711,549 | $ | 2,553,426 | $ | 2,265,395 | $ | 2,080,279 | $ | 1,878,928 | ||||||
| | | | | | | | | | | | | | | | | |
| | | | | | | | | | | | | | | | | |
| | | | | | | | | | | | | | | | | |
Other data: |
||||||||||||||||
Weighted-average effective yield on LMM debt investments(2),(3) |
11.8% | 12.3% | 12.0% | 12.5% | 12.2% | |||||||||||
Number of LMM portfolio companies |
69 | 69 | 70 | 73 | 71 | |||||||||||
Weighted-average effective yield on Middle Market debt investments(2),(3) |
8.6% | 9.6% | 9.0% | 8.5% | 8.0% | |||||||||||
Number of Middle Market portfolio companies |
51 | 56 | 62 | 78 | 86 | |||||||||||
Weighted-average effective yield on Private Loan debt investments(2),(3) |
9.5% | 10.4% | 9.2% | 9.6% | 9.5% | |||||||||||
Number of Private Loan portfolio companies |
65 | 59 | 54 | 46 | 40 | |||||||||||
Expense ratios (as percentage of average net assets): |
||||||||||||||||
Total expenses, including income tax expense |
5.7% | 5.7% | 7.4% | 5.5% | 4.6% | |||||||||||
Operating expenses |
5.7% | 5.3% | 5.5% | 5.6% | 5.5% | |||||||||||
Operating expenses, excluding interest expense |
2.4% | 2.3% | 2.6% | 2.6% | 2.4% | |||||||||||
Total investment return(4) |
36.9% | –8.3% | 16.0% | 37.4% | 8.5% | |||||||||||
Total return based on change in NAV(5) |
8.8% | 12.2% | 14.2% | 13.0% | 11.1% | |||||||||||
54
Item 7. Management's Discussion and Analysis of Financial Condition and Results of Operations
The following discussion should be read in conjunction with our consolidated financial statements and the notes thereto included elsewhere in this Annual Report on Form 10-K.
Statements we make in the following discussion which express a belief, expectation or intention, as well as those that are not historical fact, are forward-looking statements that are subject to risks, uncertainties and assumptions. Our actual results, performance or achievements, or industry results, could differ materially from those we express in the following discussion as a result of a variety of factors, including the risks and uncertainties we have referred to under the headings "Cautionary Statement Concerning Forward-Looking Statements" and "Risk Factors" in Part I of this report.
ORGANIZATION
Main Street Capital Corporation ("MSCC") is a principal investment firm primarily focused on providing customized debt and equity financing to lower middle market ("LMM") companies and debt capital to middle market ("Middle Market") companies. The portfolio investments of MSCC and its consolidated subsidiaries are typically made to support management buyouts, recapitalizations, growth financings, refinancings and acquisitions of companies that operate in a variety of industry sectors. MSCC seeks to partner with entrepreneurs, business owners and management teams and generally provides "one stop" financing alternatives within its LMM portfolio. MSCC and its consolidated subsidiaries invest primarily in secured debt investments, equity investments, warrants and other securities of LMM companies based in the United States and in secured debt investments of Middle Market companies generally headquartered in the United States.
MSCC was formed in March 2007 to operate as an internally managed business development company ("BDC") under the Investment Company Act of 1940, as amended (the "1940 Act"). MSCC wholly owns several investment funds, including Main Street Mezzanine Fund, LP ("MSMF"), Main Street Capital II, LP ("MSC II") and Main Street Capital III, LP ("MSC III" and, collectively with MSMF and MSC II, the "Funds"), and each of their general partners. The Funds are each licensed as a Small Business Investment Company ("SBIC") by the United States Small Business Administration ("SBA"). Because MSCC is internally managed, all of the executive officers and other employees are employed by MSCC. Therefore, MSCC does not pay any external investment advisory fees, but instead directly incurs the operating costs associated with employing investment and portfolio management professionals.
MSC Adviser I, LLC (the "External Investment Manager") was formed in November 2013 as a wholly owned subsidiary of MSCC to provide investment management and other services to parties other than MSCC and its subsidiaries or their portfolio companies ("External Parties") and receives fee income for such services. MSCC has been granted no-action relief by the Securities and Exchange Commission ("SEC") to allow the External Investment Manager to register as a registered investment adviser under the Investment Advisers Act of 1940, as amended. Since the External Investment Manager conducts all of its investment management activities for External Parties, it is accounted for as a portfolio investment of MSCC and is not included as a consolidated subsidiary of MSCC in MSCC's consolidated financial statements.
MSCC has elected to be treated for U.S. federal income tax purposes as a regulated investment company ("RIC") under Subchapter M of the Internal Revenue Code of 1986, as amended (the "Code"). As a result, MSCC generally will not pay corporate-level U.S. federal income taxes on any net ordinary taxable income or capital gains that it distributes to its stockholders.
MSCC has certain direct and indirect wholly owned subsidiaries that have elected to be taxable entities (the "Taxable Subsidiaries"). The primary purpose of the Taxable Subsidiaries is to permit MSCC to hold equity investments in portfolio companies which are "pass-through" entities for tax purposes.
Unless otherwise noted or the context otherwise indicates, the terms "we," "us," "our," the "Company" and "Main Street" refer to MSCC and its consolidated subsidiaries, which include the Funds and the Taxable Subsidiaries.
55
OVERVIEW
Our principal investment objective is to maximize our portfolio's total return by generating current income from our debt investments and capital appreciation from our equity and equity-related investments, including warrants, convertible securities and other rights to acquire equity securities in a portfolio company. Our LMM companies generally have annual revenues between $10 million and $150 million, and our LMM portfolio investments generally range in size from $5 million to $50 million. Our Middle Market investments are made in businesses that are generally larger in size than our LMM portfolio companies, with annual revenues typically between $150 million and $1.5 billion, and our Middle Market investments generally range in size from $3 million to $20 million. Our private loan ("Private Loan") portfolio investments are primarily debt securities in privately held companies which have been originated through strategic relationships with other investment funds on a collaborative basis. Private Loan investments are typically similar in size, structure, terms and conditions to investments we hold in our LMM portfolio and Middle Market portfolio.
We seek to fill the financing gap for LMM businesses, which, historically, have had limited access to financing from commercial banks and other traditional sources. The underserved nature of the LMM creates the opportunity for us to meet the financing needs of LMM companies while also negotiating favorable transaction terms and equity participations. Our ability to invest across a company's capital structure, from secured loans to equity securities, allows us to offer portfolio companies a comprehensive suite of financing options, or a "one stop" financing solution. Providing customized, "one stop" financing solutions is important to LMM portfolio companies. We generally seek to partner directly with entrepreneurs, management teams and business owners in making our investments. Our LMM portfolio debt investments are generally secured by a first lien on the assets of the portfolio company and typically have a term of between five and seven years from the original investment date.
Our Middle Market portfolio investments primarily consist of direct investments in or secondary purchases of interest-bearing debt securities in privately held companies that are generally larger in size than the companies included in our LMM portfolio. Our Middle Market portfolio debt investments are generally secured by either a first or second priority lien on the assets of the portfolio company and typically have an expected duration of between three and seven years from the original investment date.
Our Private Loan portfolio investments are primarily debt securities in privately held companies which have been originated through strategic relationships with other investment funds on a collaborative basis, and are often referred to in the debt markets as "club deals." Private Loan investments are typically similar in size, structure, terms and conditions to investments we hold in our LMM portfolio and Middle Market portfolio. Our Private Loan portfolio debt investments are generally secured by either a first or second priority lien on the assets of the portfolio company and typically have a term of between three and seven years from the original investment date.
Our other portfolio ("Other Portfolio") investments primarily consist of investments which are not consistent with the typical profiles for our LMM, Middle Market or Private Loan portfolio investments, including investments which may be managed by third parties. In our Other Portfolio, we may incur indirect fees and expenses in connection with investments managed by third parties, such as investments in other investment companies or private funds.
Our external asset management business is conducted through the External Investment Manager. The External Investment Manager earns management fees based on the assets of the funds under management and may earn incentive fees, or a carried interest, based on the performance of the funds managed. We have entered into an agreement with the External Investment Manager to share employees in connection with its asset management business generally, and specifically for its relationship with HMS Income Fund, Inc. ("HMS Income"). Through this agreement, we share employees with the External Investment Manager, including their related infrastructure, business relationships, management expertise and capital raising capabilities.
56
The following tables provide a summary of our investments in the LMM, Middle Market and Private Loan portfolios as of December 31, 2019 and 2018 (this information excludes the Other Portfolio investments and the External Investment Manager which are discussed further below):
| |
As of December 31, 2019 | |||||||||
|---|---|---|---|---|---|---|---|---|---|---|
| |
LMM(a) | Middle Market | Private Loan | |||||||
| |
(dollars in millions) |
|||||||||
Number of portfolio companies |
69 | 51 | 65 | |||||||
Fair value |
$ | 1,206.9 | $ | 522.1 | $ | 692.1 | ||||
Cost |
$ | 1,002.2 | $ | 572.3 | $ | 734.8 | ||||
% of portfolio at cost — debt |
65.9% | 94.8% | 94.6% | |||||||
% of portfolio at cost — equity |
34.1% | 5.2% | 5.4% | |||||||
% of debt investments at cost secured by first priority lien |
98.1% | 91.3% | 95.4% | |||||||
Weighted-average annual effective yield(b) |
11.8% | 8.6% | 9.5% | |||||||
Average EBITDA(c) |
$ | 5.1 | $ | 85.0 | $ | 57.8 | ||||
| |
As of December 31, 2018 | |||||||||
|---|---|---|---|---|---|---|---|---|---|---|
| |
LMM(a) | Middle Market | Private Loan | |||||||
| |
(dollars in millions) |
|||||||||
Number of portfolio companies |
69 | 56 | 59 | |||||||
Fair value |
$ | 1,195.0 | $ | 576.9 | $ | 507.9 | ||||
Cost |
$ | 990.9 | $ | 608.8 | $ | 553.3 | ||||
% of portfolio at cost — debt |
68.7% | 96.3% | 93.0% | |||||||
% of portfolio at cost — equity |
31.3% | 3.7% | 7.0% | |||||||
% of debt investments at cost secured by first priority lien |
98.5% | 87.9% | 92.0% | |||||||
Weighted-average annual effective yield(b) |
12.3% | 9.6% | 10.4% | |||||||
Average EBITDA(c) |
$ | 4.7 | $ | 99.1 | $ | 46.1 | ||||
57
effective yield is higher than what an investor in shares of our common stock will realize on its investment because it does not reflect our expenses or any sales load paid by an investor.
As of December 31, 2019, we had Other Portfolio investments in eleven companies, collectively totaling approximately $106.7 million in fair value and approximately $118.4 million in cost basis and which comprised approximately 4.1% of our Investment Portfolio (as defined in "Critical Accounting Policies — Basis of Presentation" below) at fair value. As of December 31, 2018, we had Other Portfolio investments in eleven companies, collectively totaling approximately $108.3 million in fair value and approximately $116.0 million in cost basis and which comprised approximately 4.4% of our Investment Portfolio at fair value.
As previously discussed, the External Investment Manager is a wholly owned subsidiary that is treated as a portfolio investment. As of December 31, 2019, there was no cost basis in this investment and the investment had a fair value of approximately $74.5 million, which comprised approximately 2.9% of our Investment Portfolio at fair value. As of December 31, 2018, there was no cost basis in this investment and the investment had a fair value of approximately $65.7 million, which comprised approximately 2.7% of our Investment Portfolio at fair value.
Our portfolio investments are generally made through MSCC and the Funds. MSCC and the Funds share the same investment strategies and criteria, although they are subject to different regulatory regimes. An investor's return in MSCC will depend, in part, on the Funds' investment returns as they are wholly owned subsidiaries of MSCC.
The level of new portfolio investment activity will fluctuate from period to period based upon our view of the current economic fundamentals, our ability to identify new investment opportunities that meet our investment criteria, and our ability to consummate the identified opportunities. The level of new investment activity, and associated interest and fee income, will directly impact future investment income. In addition, the level of dividends paid by portfolio companies and the portion of our portfolio debt investments on non-accrual status will directly impact future investment income. While we intend to grow our portfolio and our investment income over the long term, our growth and our operating results may be more limited during depressed economic periods. However, we intend to appropriately manage our cost structure and liquidity position based on applicable economic conditions and our investment outlook. The level of realized gains or losses and unrealized appreciation or depreciation on our investments will also fluctuate depending upon portfolio activity, economic conditions and the performance of our individual portfolio companies. The changes in realized gains and losses and unrealized appreciation or depreciation could have a material impact on our operating results.
Because we are internally managed, we do not pay any external investment advisory fees, but instead directly incur the operating costs associated with employing investment and portfolio management professionals. We believe that our internally managed structure provides us with a beneficial operating expense structure when compared to other publicly traded and privately held investment firms which are externally managed, and our internally managed structure allows us the opportunity to leverage our non-interest operating expenses as we grow our Investment Portfolio. For both of the years ended December 31, 2019 and 2018, the ratio of our total operating expenses, excluding interest expense, as a percentage of our quarterly average total assets was 1.4%.
During May 2012, we entered into an investment sub-advisory agreement with HMS Adviser, LP ("HMS Adviser"), which is the investment advisor to HMS Income, a non-listed BDC, to provide certain investment
58
advisory services to HMS Adviser. In December 2013, after obtaining required no-action relief from the SEC to allow us to own a registered investment adviser, we assigned the sub-advisory agreement to the External Investment Manager since the fees received from such arrangement could otherwise have negative consequences on our ability to meet the source-of-income requirement necessary for us to maintain our RIC tax treatment. Under the investment sub-advisory agreement, the External Investment Manager is entitled to 50% of the base management fee and the incentive fees earned by HMS Adviser under its advisory agreement with HMS Income. The External Investment Manager agreed to waive the historical incentive fees otherwise earned through December 31, 2018. During the years ended December 31, 2019, 2018 and 2017, the External Investment Manager earned $13.1 million, $11.6 million and $10.9 million, respectively, in fee income, which consisted of $11.1 million of base management fees and $2.0 million in incentive fees in 2019 compared to $11.6 million and $10.9 million of base management fees for the comparable period in 2018 and 2017, respectively, under the sub-advisory agreement with HMS Adviser.
During April 2014, we received an exemptive order from the SEC permitting co-investments by us and HMS Income in certain negotiated transactions where co-investing would otherwise be prohibited under the 1940 Act. We have made, and in the future intend to continue to make, such co-investments with HMS Income in accordance with the conditions of the order. The order requires, among other things, that we and the External Investment Manager consider whether each such investment opportunity is appropriate for HMS Income and, if it is appropriate, to propose an allocation of the investment opportunity between us and HMS Income. Because the External Investment Manager may receive performance-based fee compensation from HMS Income, this may provide it an incentive to allocate opportunities to HMS Income instead of us. However, both we and the External Investment Manager have policies and procedures in place to manage this conflict.
CRITICAL ACCOUNTING POLICIES
Basis of Presentation
Our consolidated financial statements are prepared in accordance with generally accepted accounting principles in the United States of America ("U.S. GAAP"). For each of the periods presented herein, our consolidated financial statements include the accounts of MSCC and its consolidated subsidiaries. The Investment Portfolio, as used herein, refers to all of our investments in LMM portfolio companies, investments in Middle Market portfolio companies, Private Loan portfolio investments, Other Portfolio investments, and the investment in the External Investment Manager. Our results of operations and cash flows for the years ended December 31, 2019, 2018 and 2017 and financial position as of December 31, 2019 and 2018, are presented on a consolidated basis. The effects of all intercompany transactions between us and our consolidated subsidiaries have been eliminated in consolidation. Certain reclassifications have been made to prior period balances to conform with the current presentation.
We are an investment company following the accounting and reporting guidance in Financial Accounting Standards Board ("FASB") Accounting Standards Codification ("ASC") 946, Financial Services — Investment Companies ("ASC 946"). Under ASC 946, we are precluded from consolidating other entities in which we have equity investments, including those in which we have a controlling interest, unless the other entity is another investment company. An exception to this general principle in ASC 946 occurs if we hold a controlling interest in an operating company that provides all or substantially all of its services directly to us or to any of our portfolio companies. Accordingly, as noted above, our consolidated financial statements include the financial position and operating results for the Funds and the Taxable Subsidiaries. We have determined that all of our portfolio investments do not qualify for this exception, including the investment in the External Investment Manager. Therefore, our Investment Portfolio is carried on the consolidated balance sheet at fair value with any adjustments to fair value recognized as "Net Unrealized Appreciation (Depreciation)" on the consolidated statements of operations until the investment is realized, usually upon exit, resulting in any gain or loss being recognized as a "Net Realized Gain (Loss)."
59
Investment Portfolio Valuation
The most significant determination inherent in the preparation of our consolidated financial statements is the valuation of our Investment Portfolio and the related amounts of unrealized appreciation and depreciation. As of both December 31, 2019 and 2018, our Investment Portfolio valued at fair value represented approximately 96% of our total assets. We are required to report our investments at fair value. We follow the provisions of FASB ASC 820, Fair Value Measurements and Disclosures ("ASC 820"). ASC 820 defines fair value, establishes a framework for measuring fair value, establishes a fair value hierarchy based on the quality of inputs used to measure fair value and enhances disclosure requirements for fair value measurements. ASC 820 requires us to assume that the portfolio investment is to be sold in the principal market to independent market participants, which may be a hypothetical market. Market participants are defined as buyers and sellers in the principal market that are independent, knowledgeable and willing and able to transact. See "Note B.1. — Valuation of the Investment Portfolio" in the notes to consolidated financial statements for a detailed discussion of our investment portfolio valuation process and procedures.
Due to the inherent uncertainty in the valuation process, our determination of fair value for our Investment Portfolio may differ materially from the values that would have been determined had a ready market for the securities existed. In addition, changes in the market environment, portfolio company performance and other events that may occur over the lives of the investments may cause the gains or losses ultimately realized on these investments to be materially different than the valuations currently assigned. We determine the fair value of each individual investment and record changes in fair value as unrealized appreciation or depreciation.
Our Board of Directors has the final responsibility for overseeing, reviewing and approving, in good faith, our determination of the fair value for our Investment Portfolio and our valuation procedures, consistent with 1940 Act requirements. We believe our Investment Portfolio as of December 31, 2019 and 2018 approximates fair value as of those dates based on the markets in which we operate and other conditions in existence on those reporting dates.
Revenue Recognition
Interest and Dividend Income
We record interest and dividend income on the accrual basis to the extent amounts are expected to be collected. Dividend income is recorded as dividends are declared by the portfolio company or at the point an obligation exists for the portfolio company to make a distribution. In accordance with our valuation policies, we evaluate accrued interest and dividend income periodically for collectability. When a loan or debt security becomes 90 days or more past due, and if we otherwise do not expect the debtor to be able to service all of its debt or other obligations, we will generally place the loan or debt security on non-accrual status and cease recognizing interest income on that loan or debt security until the borrower has demonstrated the ability and intent to pay contractual amounts due. If a loan or debt security's status significantly improves regarding the debtor's ability to service the debt or other obligations, or if a loan or debt security is sold or written off, we remove it from non-accrual status.
Fee Income
We may periodically provide services, including structuring and advisory services, to our portfolio companies or other third parties. For services that are separately identifiable and evidence exists to substantiate fair value, fee income is recognized as earned, which is generally when the investment or other applicable transaction closes. Fees received in connection with debt financing transactions for services that do not meet these criteria are treated as debt origination fees and are deferred and accreted into income over the life of the financing.
60
Payment-in-Kind ("PIK") Interest and Cumulative Dividends
We hold certain debt and preferred equity instruments in our Investment Portfolio that contain PIK interest and cumulative dividend provisions. The PIK interest, computed at the contractual rate specified in each debt agreement, is periodically added to the principal balance of the debt and is recorded as interest income. Thus, the actual collection of this interest may be deferred until the time of debt principal repayment. Cumulative dividends are recorded as dividend income, and any dividends in arrears are added to the balance of the preferred equity investment. The actual collection of these dividends in arrears may be deferred until such time as the preferred equity is redeemed or sold. To maintain RIC tax treatment (as discussed below), these non-cash sources of income may need to be paid out to stockholders in the form of distributions, even though we may not have collected the PIK interest and cumulative dividends in cash. We stop accruing PIK interest and cumulative dividends and write off any accrued and uncollected interest and dividends in arrears when we determine that such PIK interest and dividends in arrears are no longer collectible. For the years ended December 31, 2019, 2018 and 2017, (i) approximately 2.0%, 1.0%, and 2.4%, respectively, of our total investment income was attributable to PIK interest income not paid currently in cash and (ii) approximately 1.0%, 1.0%, and 1.6%, respectively, of our total investment income was attributable to cumulative dividend income not paid currently in cash.
Share-Based Compensation
We account for our share-based compensation plans using the fair value method, as prescribed by ASC 718, Compensation — Stock Compensation. Accordingly, for restricted stock awards, we measure the grant date fair value based upon the market price of our common stock on the date of the grant and amortize the fair value of the awards as share-based compensation expense over the requisite service period, which is generally the vesting term.
We have also adopted Accounting Standards Update ("ASU") 2016-09, Compensation — Stock Compensation: Improvements to Employee Share-Based Payment Accounting, which requires that all excess tax benefits and tax deficiencies (including tax benefits of dividends on share-based payment awards) be recognized as income tax expense or benefit in the income statement and not delay recognition of a tax benefit until the tax benefit is realized through a reduction to taxes payable. Accordingly, the tax effects of exercised or vested awards are treated as discrete items in the reporting period in which they occur. Additionally, we have elected to account for forfeitures as they occur.
Income Taxes
MSCC has elected to be treated for U.S. federal income tax purposes as a RIC. MSCC's taxable income includes the taxable income generated by MSCC and certain of its subsidiaries, including the Funds, which are treated as disregarded entities for tax purposes. As a RIC, MSCC generally will not pay corporate-level U.S. federal income taxes on any net ordinary taxable income or capital gains that MSCC distributes to its stockholders. MSCC must generally distribute at least 90% of its "investment company taxable income" (which is generally its net ordinary taxable income and realized net short-term capital gains in excess of realized net long-term capital losses) and 90% of its tax-exempt income to maintain its RIC status (pass-through tax treatment for amounts distributed). As part of maintaining RIC status, undistributed taxable income (subject to a 4% non-deductible U.S. federal excise tax) pertaining to a given fiscal year may be distributed up to 12 months subsequent to the end of that fiscal year, provided such dividends are declared on or prior to the later of (i) filing of the U.S. federal income tax return for the applicable fiscal year or (ii) the fifteenth day of the ninth month following the close of the year in which such taxable income was generated.
The Taxable Subsidiaries primarily hold certain portfolio investments for us. The Taxable Subsidiaries permit us to hold equity investments in portfolio companies which are "pass-through" entities for tax purposes and to continue to comply with the "source-of-income" requirements contained in the RIC tax provisions of the Code. The Taxable Subsidiaries are consolidated with us for U.S. GAAP financial reporting purposes, and the portfolio investments held by the Taxable Subsidiaries are included in our consolidated
61
financial statements as portfolio investments and recorded at fair value. The Taxable Subsidiaries are not consolidated with MSCC for income tax purposes and may generate income tax expense, or benefit, and tax assets and liabilities, as a result of their ownership of certain portfolio investments. The taxable income, or loss, of the Taxable Subsidiaries may differ from their book income, or loss, due to temporary book and tax timing differences and permanent differences. The Taxable Subsidiaries are each taxed at their normal corporate tax rates based on their taxable income. The income tax expense, or benefit, if any, and the related tax assets and liabilities, of the Taxable Subsidiaries are reflected in our consolidated financial statements.
The External Investment Manager is an indirect wholly owned subsidiary of MSCC owned through a Taxable Subsidiary and is a disregarded entity for tax purposes. The External Investment Manager has entered into a tax sharing agreement with its Taxable Subsidiary owner. Since the External Investment Manager is accounted for as a portfolio investment of MSCC and is not included as a consolidated subsidiary of MSCC in MSCC's consolidated financial statements, and as a result of the tax sharing agreement with its Taxable Subsidiary owner, for its stand-alone financial reporting purposes the External Investment Manager is treated as if it is taxed at normal corporate tax rates based on its taxable income and, as a result of its activities, may generate income tax expense or benefit. The income tax expense, or benefit, if any, and the related tax assets and liabilities, of the External Investment Manager are reflected in the External Investment Manager's separate financial statements.
In December 2017, the "Tax Cuts and Jobs Act" legislation was enacted. The Tax Cuts and Jobs Act included significant changes to the U.S. corporate tax system, including a U.S. federal corporate income tax rate reduction from 35% to 21% and other changes. ASC 740, Income Taxes, requires the effects of changes in tax rates and laws on deferred tax balances to be recognized in the period in which the legislation was enacted. As such, we have accounted for the tax effects as a result of the enactment of the Tax Cuts and Jobs Act beginning with the period ended December 31, 2017.
The Taxable Subsidiaries and the External Investment Manager use the liability method in accounting for income taxes. Deferred tax assets and liabilities are recorded for temporary differences between the tax basis of assets and liabilities and their reported amounts in the consolidated financial statements, using statutory tax rates in effect for the year in which the temporary differences are expected to reverse. A valuation allowance is provided, if necessary, against deferred tax assets when it is more likely than not that some portion or all of the deferred tax asset will not be realized.
Taxable income generally differs from net income for financial reporting purposes due to temporary and permanent differences in the recognition of income and expenses. Taxable income generally excludes net unrealized appreciation or depreciation, as investment gains or losses are not included in taxable income until they are realized. Our stockholders' equity includes an adjustment to classification as a result of permanent book-to-tax differences, which include differences in the book and tax treatment of income and expenses.
INVESTMENT PORTFOLIO COMPOSITION
Our LMM portfolio investments primarily consist of secured debt, equity warrants and direct equity investments in privately held, LMM companies based in the United States. Our LMM portfolio companies generally have annual revenues between $10 million and $150 million, and our LMM investments generally range in size from $5 million to $50 million. The LMM debt investments are typically secured by either a first or second priority lien on the assets of the portfolio company, can include either fixed or floating rate terms and generally have a term of between five and seven years from the original investment date. In most LMM portfolio investments, we receive nominally priced equity warrants and/or make direct equity investments in connection with a debt investment.
Our Middle Market portfolio investments primarily consist of direct investments in or secondary purchases of interest-bearing debt securities in privately held companies based in the United States that are generally larger in size than the companies included in our LMM portfolio. Our Middle Market portfolio companies generally have annual revenues between $150 million and $1.5 billion, and our Middle Market investments generally range in size from $3 million to $20 million. Our Middle Market portfolio debt
62
investments are generally secured by either a first or second priority lien on the assets of the portfolio company and typically have a term of between three and seven years from the original investment date.
Our Private Loan portfolio investments are primarily debt securities in privately held companies which have been originated through strategic relationships with other investment funds on a collaborative basis, and are often referred to in the debt markets as "club deals." Private Loan investments are typically similar in size, structure, terms and conditions to investments we hold in our LMM portfolio and Middle Market portfolio. Our Private Loan portfolio debt investments are generally secured by either a first or second priority lien on the assets of the portfolio company and typically have a term of between three and seven years from the original investment date.
Our Other Portfolio investments primarily consist of investments which are not consistent with the typical profiles for LMM, Middle Market and Private Loan portfolio investments, including investments which may be managed by third parties. In the Other Portfolio, we may incur indirect fees and expenses in connection with investments managed by third parties, such as investments in other investment companies or private funds.
Our external asset management business is conducted through the External Investment Manager. The External Investment Manager earns management fees based on the assets of the funds under management and may earn incentive fees, or a carried interest, based on the performance of the funds managed. We have entered into an agreement with the External Investment Manager to share employees in connection with its asset management business generally, and specifically for its relationship with HMS Income. Through this agreement, we share employees with the External Investment Manager, including their related infrastructure, business relationships, management expertise and capital raising capabilities, and we allocate the related expenses to the External Investment Manager pursuant to the sharing agreement. Our total expenses for the years ended December 31, 2019, 2018 and 2017 are net of expenses allocated to the External Investment Manager of $6.7 million, $6.8 million and $6.4 million, respectively. The External Investment Manager earns management fees based on the assets of the funds under management and may earn incentive fees, or a carried interest, based on the performance of the funds managed. The total contribution of the External Investment Manager to our net investment income consists of the combination of the expenses allocated to the External Investment Manager and the dividend income received from the External Investment Manager. For the years ended December 31, 2019, 2018 and 2017, the total contribution to our net investment income was $11.7 million, $10.6 million and $9.4 million, respectively.
The following tables summarize the composition of our total combined LMM portfolio investments, Middle Market portfolio investments and Private Loan portfolio investments at cost and fair value by type of investment as a percentage of the total combined LMM portfolio investments, Middle Market portfolio investments and Private Loan portfolio investments as of December 31, 2019 and 2018 (this information excludes the Other Portfolio investments and the External Investment Manager).
Cost:
|
December 31, 2019 | December 31, 2018 | |||||
|---|---|---|---|---|---|---|---|
First lien debt |
78.2% | 77.1% | |||||
Equity |
17.2% | 16.6% | |||||
Second lien debt |
3.5% | 5.3% | |||||
Equity warrants |
0.6% | 0.6% | |||||
Other |
0.5% | 0.4% | |||||
| | | | | | | | |
|
100.0% | 100.0% | |||||
| | | | | | | | |
| | | | | | | | |
| | | | | | | | |
63
Fair Value:
|
December 31, 2019 | December 31, 2018 | |||||
|---|---|---|---|---|---|---|---|
First lien debt |
70.1% | 69.0% | |||||
Equity |
26.0% | 25.5% | |||||
Second lien debt |
3.0% | 4.6% | |||||
Equity warrants |
0.4% | 0.5% | |||||
Other |
0.5% | 0.4% | |||||
| | | | | | | | |
|
100.0% | 100.0% | |||||
| | | | | | | | |
| | | | | | | | |
| | | | | | | | |
Our LMM portfolio investments, Middle Market portfolio investments and Private Loan portfolio investments carry a number of risks including: (1) investing in companies which may have limited operating histories and financial resources; (2) holding investments that generally are not publicly traded and which may be subject to legal and other restrictions on resale; and (3) other risks common to investing in below investment grade debt and equity investments in our Investment Portfolio. Please see "Risk Factors — Risks Related to Our Investments" for a more complete discussion of the risks involved with investing in our Investment Portfolio.
PORTFOLIO ASSET QUALITY
We utilize an internally developed investment rating system to rate the performance of each LMM portfolio company and to monitor our expected level of returns on each of our LMM investments in relation to our expectations for the portfolio company. The investment rating system takes into consideration various factors, including each investment's expected level of returns, the collectability of our debt investments and the ability to receive a return of the invested capital in our equity investments, comparisons to competitors and other industry participants, the portfolio company's future outlook and other factors that are deemed to be significant to the portfolio company.
As of December 31, 2019, our total Investment Portfolio had eight investments on non-accrual status, which comprised approximately 1.4% of its fair value and 4.8% of its cost. As of December 31, 2018, our total Investment Portfolio had six investments on non-accrual status, which comprised approximately 1.3% of its fair value and 3.9% of its cost.
The operating results of our portfolio companies are impacted by changes in the broader fundamentals of the United States economy. In the event that the United States economy contracts, it is likely that the financial results of small to mid-sized companies, like those in which we invest, could experience deterioration or limited growth from current levels, which could ultimately lead to difficulty in meeting their debt service requirements, to an increase in defaults on our debt investments or in realized losses on our investments and to difficulty in maintaining historical dividend payment rates and unrealized appreciation on our equity investments. Consequently, we can provide no assurance that the performance of certain portfolio companies will not be negatively impacted by economic cycles or other conditions, which could also have a negative impact on our future results.
64
DISCUSSION AND ANALYSIS OF RESULTS OF OPERATIONS
Set forth below is a comparison of the results of operations for the years ended December 31, 2019 and 2018. For a comparison of the results of operations for the years ended December 31, 2018 and 2017, see the Company's Form 10-K for the year ended December 31, 2018, as filed with the SEC on March 1, 2019.
Comparison of the years ended December 31, 2019 and 2018
| |
Twelve Months Ended December 31, |
Net Change | |||||||||
|---|---|---|---|---|---|---|---|---|---|---|---|
| |
2019 | 2018 | Amount | % | |||||||
| |
(dollars in thousands) |
||||||||||
Total investment income |
$ | 243,373 | $ | 233,355 | $ | 10,018 | 4% | ||||
Total expenses |
(86,007 | ) | (76,710 | ) | (9,297 | ) | (12)% | ||||
| | | | | | | | | | | | |
Net investment income |
157,366 | 156,645 | 721 | 0% | |||||||
Net realized gain (loss) from investments |
(15,112 | ) | 1,341 | (16,453 | ) | ||||||
Net realized loss on extinguishment of debt |
(5,689 | ) | (2,896 | ) | (2,793 | ) | |||||
Net unrealized appreciation (depreciation) from: |
|||||||||||
Portfolio investments |
(10,204 | ) | 17,981 | (28,185 | ) | ||||||
SBIC debentures |
4,450 | 1,294 | 3,156 | ||||||||
| | | | | | | | | | | | |
Total net unrealized appreciation (depreciation) |
(5,754 | ) | 19,275 | (25,029 | ) | ||||||
Income tax provision |
(1,242 | ) | (6,152 | ) | 4,910 | ||||||
| | | | | | | | | | | | |
Net increase in net assets resulting from operations |
$ | 129,569 | $ | 168,213 | $ | (38,644 | ) | (23)% | |||
| | | | | | | | | | | | |
| | | | | | | | | | | | |
| | | | | | | | | | | | |
| |
Twelve Months Ended December 31, |
Net Change | |||||||||
|---|---|---|---|---|---|---|---|---|---|---|---|
| |
2019 | 2018 | Amount | % | |||||||
| |
(dollars in thousands, except per share amounts) |
||||||||||
Net investment income |
$ | 157,366 | $ | 156,645 | $ | 721 | 0% | ||||
Share-based compensation expense |
10,083 | 9,151 | 932 | 10% | |||||||
| | | | | | | | | | | | |
Distributable net investment income(a) |
$ | 167,449 | $ | 165,796 | $ | 1,653 | 1% | ||||
| | | | | | | | | | | | |
| | | | | | | | | | | | |
| | | | | | | | | | | | |
Net investment income per share — Basic and diluted |
$ | 2.50 | $ | 2.60 | $ | (0.10 | ) | (4)% | |||
| | | | | | | | | | | | |
| | | | | | | | | | | | |
| | | | | | | | | | | | |
Distributable net investment income per share — Basic and diluted(a) |
$ | 2.66 | $ | 2.76 | $ | (0.10 | ) | (4)% | |||
| | | | | | | | | | | | |
| | | | | | | | | | | | |
| | | | | | | | | | | | |
65
Investment Income
For the year ended December 31, 2019, total investment income was $243.4 million, a 4% increase over the $233.4 million of total investment income for the corresponding period of 2018. This comparable period increase was principally attributable to (i) a $10.3 million net increase in interest income primarily related to higher average levels of Investment Portfolio debt investments, partially offset by decreased levels of prepayment, repricing and other activities involving existing Investment Portfolio debt investments and by decreases in the average effective yields of the Investment Portfolio debt investments, and (ii) a $3.3 million increase in dividend income from Investment Portfolio equity investments, partially offset by a $3.6 million decrease in fee income. The $10.0 million increase in total investment income in the year ended December 31, 2019 is net of the net negative impact (i) a decrease of $8.0 million related to elevated dividend income activity in 2018 from certain Investment Portfolio equity investments that was considered to be less consistent on a recurring basis or non-recurring and (ii) a decrease of $4.0 million related to lower accelerated prepayment, repricing and other activity for certain Investment Portfolio debt investments in 2019.
Expenses
For the year ended December 31, 2019, total expenses increased to $86.0 million from $76.7 million for the corresponding period of 2018. This comparable period increase in operating expenses was principally attributable to (i) a $6.8 million increase in interest expense, primarily due to an $9.7 million increase as a result of the issuances of our 5.20% Notes (as defined below) in April 2019 and December 2019, partially offset by (a) a $1.5 million decrease from the redemption of the 6.125% Notes (as defined below) effective April 1, 2018, (b) a $0.7 million decrease from the repayment of the 4.50% Notes due 2019 (as defined below) effective December 1, 2019 and (c) a $0.7 million decrease relating to our multi-year revolving credit facility (the "Credit Facility") primarily due to the lower average balance outstanding, (ii) a $0.9 million increase in share-based compensation expense, (iii) $0.8 million increase in compensation expense and (iv) a $0.7 million increase in general and administrative expenses during the year ended December 31, 2019. The $0.8 million increase in compensation expense is primarily related to a $1.1 million increase as a result of the increase in the fair value of our deferred compensation plan assets and a $1.7 million increase in base compensation related expenses primarily as a result of an increase in the number of personnel, partially offset by a $2.0 million decrease in cash incentive compensation levels. The ratio of our total operating expenses, excluding interest expense, as a percentage of our quarterly average total assets for both of the years ended December 31, 2019 and 2018 was 1.4%.
Net Investment Income
Net investment income for the year ended December 31, 2019 was $157.4 million, compared to net investment income of $156.6 million for the corresponding period of 2018. The increase in net investment income was principally attributable to the increase in total investment income, partially offset by higher operating expenses both as discussed above.
Distributable Net Investment Income
For the year ended December 31, 2019, distributable net investment income increased 1% to $167.4 million, or $2.66 per share, compared with $165.8 million, or $2.76 per share, in the corresponding period of 2018. The increase in distributable net investment income was primarily due to the higher level of total investment income, partially offset by higher operating expenses both as discussed above. Distributable net investment income on a per share basis for the year ended December 31, 2019 reflects (i) a decrease of $0.20 per share due to a lower level of income per share attributable to the decrease in the unusual or non-recurring dividend income activity from 2018 and the decrease in interest income from accelerated prepayment, repricing and other income activity considered non-recurring, as discussed above, (ii) a decrease of $0.02 per share due to the increase in the fair value of the deferred compensation plan assets, as discussed above, and (iii) a greater number of average shares outstanding compared to the corresponding period in 2018, primarily due to shares issued through the ATM Program (as defined in "— Liquidity and Capital
66
Resources — Capital Resources" below), shares issued pursuant to our equity incentive plans and shares issued pursuant to our dividend reinvestment plan.
Net Increase in Net Assets Resulting from Operations
The net increase in net assets resulting from operations during the year ended December 31, 2019 was $129.6 million, or $2.06 per share, compared with $168.2 million, or $2.80 per share, during the year ended December 31, 2018. This $38.6 million decrease from the prior year was primarily the result of (i) a $25.0 million decrease in net unrealized appreciation (depreciation) from portfolio investments, including the impact of accounting reversals relating to realized gains/income (losses), and SBIC debentures, (ii) a $16.5 million decrease in the net realized gain (loss) from investments and (iii) a $2.8 million increase in the net realized loss on extinguishment of debt. These decreases were partially offset by (i) a $0.7 million increase in net investment income as discussed above and (ii) a $4.9 million decrease in the income tax provision.
The net realized loss from investments of $15.1 million for the year ended December 31, 2019 was primarily attributable to the net realized loss of $29.2 million in our Middle Market portfolio, which is primarily the result of (i) the realized losses of $12.2 million on the exits of two Middle Market investments, (ii) the realized losses of $9.9 million resulting from the restructure of two Middle Market investments and (iii) the realized loss of $7.0 million resulting from the partial exit of a Middle Market investment. These realized losses were partially offset by (i) the net realized gain of $13.8 million on the exits of four LMM investments and (ii) the net realized gain of $0.6 million on the exits of four Private Loan investments.
The net realized gain from investments of $1.3 million for the year ended December 31, 2018 was primarily the result of (i) the net realized gain of $13.7 million resulting from the net effect of gains on the exits of six LMM investments, partially offset by losses on the exits of four LMM investments and other activity in the LMM portfolio, (ii) the realized gains of $6.1 million due to activity in our Other Portfolio and (iii) the realized gains of $2.5 million in our Private Loan portfolio, with the effect of these net realized gains partially offset by the net realized loss of $20.9 million in our Middle Market portfolio, which is primarily the result of (i) the realized losses of $17.6 million on the restructures of two Middle Market investments and (ii) the realized losses of $4.4 million on the exits of two Middle Market investments.
The following table provides a summary of the total net unrealized depreciation of $5.8 million for the year ended December 31, 2019:
| |
The Year Ended December 31, 2019 | |||||||||||||||
|---|---|---|---|---|---|---|---|---|---|---|---|---|---|---|---|---|
| |
LMM(a) | Middle Market |
Private Loan |
Other | Total | |||||||||||
| |
(dollars in millions) |
|||||||||||||||
Accounting reversals of net unrealized (appreciation) depreciation recognized in prior periods due to net realized (gains / income) losses recognized during the current period |
$ | (14.0 | ) | $ | 23.6 | $ | (2.3 | ) | $ | 0.1 | $ | 7.4 | ||||
Net unrealized appreciation (depreciation) relating to portfolio investments |
14.5 | (42.0 | ) | 4.3 | 5.6 | (b) | (17.6 | ) | ||||||||
| | | | | | | | | | | | | | | | | |
Total net unrealized appreciation (depreciation) relating to portfolio investments |
$ | 0.5 | $ | (18.4 | ) | $ | 2.0 | $ | 5.7 | $ | (10.2 | ) | ||||
| | | | | | | | | | | | | | | | | |
| | | | | | | | | | | | | | | | | |
| | | | | | | | | | | | | | | | | |
Unrealized appreciation relating to SBIC debentures(c) |
4.4 | |||||||||||||||
| | | | | | | | | | | | | | | | | |
Total net unrealized depreciation |
$ | (5.8 | ) | |||||||||||||
| | | | | | | | | | | | | | | | | |
| | | | | | | | | | | | | | | | | |
| | | | | | | | | | | | | | | | | |
67
The following table provides a summary of the total net unrealized appreciation of $19.3 million for the year ended December 31, 2018:
| |
Twelve Months Ended December 31, 2018 | |||||||||||||||
|---|---|---|---|---|---|---|---|---|---|---|---|---|---|---|---|---|
| |
LMM(a) | Middle Market |
Private Loan |
Other | Total | |||||||||||
| |
(dollars in millions) |
|||||||||||||||
Accounting reversals of net unrealized (appreciation) depreciation recognized in prior periods due to net realized (gains / income) losses recognized during the current period |
$ | (22.2 | ) | $ | 19.6 | $ | (4.4 | ) | $ | (2.6 | ) | $ | (9.6 | ) | ||
Net unrealized appreciation (depreciation) relating to portfolio investments |
54.5 | (31.3 | ) | (19.3 | ) | 23.7 | (b) | 27.6 | ||||||||
| | | | | | | | | | | | | | | | | |
Total net unrealized appreciation (depreciation) relating to portfolio investments |
$ | 32.3 | $ | (11.7 | ) | $ | (23.7 | ) | $ | 21.1 | $ | 18.0 | ||||
| | | | | | | | | | | | | | | | | |
| | | | | | | | | | | | | | | | | |
| | | | | | | | | | | | | | | | | |
Unrealized appreciation relating to SBIC debentures(c) |
1.3 | |||||||||||||||
| | | | | | | | | | | | | | | | | |
Total net unrealized appreciation |
$ | 19.3 | ||||||||||||||
| | | | | | | | | | | | | | | | | |
| | | | | | | | | | | | | | | | | |
| | | | | | | | | | | | | | | | | |
The income tax provision for the year ended December 31, 2019 of $1.2 million principally consisted of a current tax expense of $3.5 million related to (i) a $2.4 million provision for current U.S. federal and state income taxes and (ii) a $1.1 million provision for excise tax on our estimated undistributed taxable income, partially offset by a deferred tax benefit of $2.3 million, which is primarily the result of the net activity relating to our portfolio investments held in our Taxable Subsidiaries, including changes in loss carryforwards, changes in net unrealized appreciation/depreciation and other temporary book-tax differences.
The income tax provision for the year ended December 31, 2018 of $6.2 million principally consisted of a deferred tax provision of $5.8 million, which is primarily the result of the net activity relating to our portfolio investments held in our Taxable Subsidiaries, including changes in loss carryforwards, changes in net unrealized appreciation/depreciation and other temporary book-tax differences, and other current tax expense of $0.4 million.
68
Liquidity and Capital Resources
Cash Flows
For the year ended December 31, 2019, we experienced a net increase in cash and cash equivalents in the amount of $1.1 million, which is the net result of $33.8 million of cash used in our operating activities and $34.9 million of cash provided by our financing activities.
The $33.8 million of cash was used in our operating activities resulted primarily from cash uses totaling $664.1 million for the funding of new portfolio company investments and settlement of accruals for portfolio investments existing as of December 31, 2018, partially offset by (i) cash flows we generated from the operating profits earned totaling $151.6 million, which is our distributable net investment income, excluding the non-cash effects of the accretion of unearned income, payment-in-kind interest income, cumulative dividends and the amortization expense for deferred financing costs, (ii) cash proceeds totaling $477.9 million from the sales and repayments of debt investments and sales of and return on capital of equity investments and (iii) cash proceeds of $0.8 million related to changes in other assets and liabilities.
The $34.9 million of cash was used in our financing activities principally consisted of (i) $325.0 million in cash proceeds from the issuance of the 5.20% Notes and (ii) $89.3 million in net cash proceeds from the ATM Program (described below), partially offset by (i) $175.0 million cash used in repayment of 4.50% Notes due 2019, (ii) $164.3 million in cash dividends paid to stockholders, (iii) $34.0 million in repayment of SBIC debentures, (iv) $3.9 million for purchases of vested restricted stock from employees to satisfy their tax withholding requirements upon the vesting of such restricted stock, (v) $1.2 million for payment of deferred debt issuance costs, SBIC debenture fees and other costs and (vi) and $1.0 in net repayments on the Credit Facility.
For the year ended December 31, 2018, we experienced a net increase in cash and cash equivalents in the amount of $2.7 million, which is the net result of $109.1 million of cash used in our operating activities and $111.7 million of cash provided by our financing activities.
During the year ended December 31, 2018, $109.1 million of cash was used in our operating activities, which resulted primarily from cash uses totaling $962.5 million for the funding of new portfolio company investments and settlement of accruals for portfolio investments existing as of December 31, 2017, partially offset by (i) cash flows we generated from the operating profits earned totaling $149.8 million, which is our distributable net investment income, excluding the non-cash effects of the accretion of unearned income, payment-in-kind interest income, cumulative dividends and the amortization expense for deferred financing costs, (ii) cash proceeds totaling $703.2 million from the sales and repayments of debt investments and sales of and return on capital of equity investments and (iii) cash proceeds of $0.4 million related to changes in other assets and liabilities.
During the year ended December 31, 2018, $111.7 million in cash was provided by financing activities, which principally consisted of (i) $237.0 million in net cash proceeds from the Credit Facility, (ii) $78.4 million in net cash proceeds from the ATM Program (described below), and (iii) $54.0 million in cash proceeds from issuance of SBIC debentures, partially offset by (i) $156.0 million in cash dividends paid to stockholders, (ii) $90.7 million in redemption of 6.125% Notes, (iii) $4.1 million for purchases of vested restricted stock from employees to satisfy their tax withholding requirements upon the vesting of such restricted stock, (iv) $4.0 million in repayment of SBIC debentures and (v) $2.9 million for payment of deferred debt issuance costs, SBIC debenture fees and other costs.
Capital Resources
As of December 31, 2019, we had $55.2 million in cash and cash equivalents and $405.0 million of unused capacity under the Credit Facility, which we maintain to support our investment and operating activities. As of December 31, 2019, our net asset value totaled $1,536.4 million, or $23.91 per share.
69
The Credit Facility, which provides additional liquidity to support our investment and operational activities, provides for total commitments of $705.0 million from a diversified group of 17 lenders. The Credit Facility matures in September 2023 and contains an accordion feature which allows us to increase the total commitments under the facility to up to $800.0 million from new and existing lenders on the same terms and conditions as the existing commitments.
Borrowings under the Credit Facility bear interest, subject to our election and resetting on a monthly basis on the first of each month, on a per annum basis at a rate equal to the applicable LIBOR rate (1.8% as of December 31, 2019) plus (i) 1.875% (or the applicable base rate (Prime Rate of 4.75% as of December 31, 2019) plus 0.875%) as long as we meet certain agreed upon excess collateral and maximum leverage requirements or (ii) 2.0% (or the applicable base rate plus 1.0%) otherwise. We pay unused commitment fees of 0.25% per annum on the unused lender commitments under the Credit Facility. The Credit Facility is secured by a first lien on the assets of MSCC and its subsidiaries, excluding the equity ownership or assets of the Funds and the External Investment Manager. The Credit Facility contains certain affirmative and negative covenants, including but not limited to: (i) maintaining a minimum availability of at least 10% of the borrowing base, (ii) maintaining an interest coverage ratio of at least 2.0 to 1.0, (iii) maintaining an asset coverage ratio (tangible net worth to Credit Facility borrowings) of at least 1.5 to 1.0 and (iv) maintaining a minimum tangible net worth. The Credit Facility is provided on a revolving basis through its final maturity date in September 2023, and contains two, one-year extension options which could extend the final maturity by up to two years, subject to certain conditions, including lender approval. As of December 31, 2019, we had $300.0 million in borrowings outstanding under the Credit Facility, the interest rate on the Credit Facility was 3.6% (based on the LIBOR rate of 1.7% as of the most recent reset date of December 1, 2019 plus 1.875%) and we were in compliance with all financial covenants of the Credit Facility.
Through the Funds, we have the ability to issue SBIC debentures guaranteed by the SBA at favorable interest rates and favorable terms and conditions. Under existing SBIC regulations, SBA-approved SBICs under common control have the ability to issue debentures guaranteed by the SBA up to a regulatory maximum amount of $350.0 million. Through the Funds, we have an effective maximum amount of $347.0 million as a result of certain voluntary prepayments of SBIC debentures under historical commitments from the SBA. During the year ended December 31, 2019, Main Street received a $25.0 million commitment from the SBA in order to issue new SBIC debentures in the future and opportunistically prepaid $34.0 million of existing SBIC debentures that were scheduled to mature over the next year as part of an effort to manage the maturity dates of the oldest SBIC debentures. Debentures guaranteed by the SBA have fixed interest rates that equal prevailing 10-year Treasury Note rates plus a market spread and have a maturity of ten years with interest payable semiannually. The principal amount of the debentures is not required to be paid before maturity, but may be pre-paid at any time with no prepayment penalty. We expect to issue new SBIC debentures under the SBIC program in the future in an amount up to the regulatory maximum amount for affiliated SBIC funds. As of December 31, 2019, through our three wholly owned SBICs, we had $311.8 million of outstanding SBIC debentures guaranteed by the SBA, which bear a weighted-average annual fixed interest rate of approximately 3.6%, paid semiannually, and mature ten years from issuance. The first maturity related to our SBIC debentures occurs in 2020, and the weighted-average remaining duration is approximately 5.1 years as of December 31, 2019.
In April 2013, we issued $92.0 million, including the underwriters' full exercise of their over-allotment option, in aggregate principal amount of the 6.125% Notes (the "6.125% Notes"). The 6.125% Notes bore interest at a rate of 6.125% per year payable quarterly on January 1, April 1, July 1 and October 1 of each year. On April 2, 2018, we redeemed the entire principal amount of the issued and outstanding 6.125% Notes, effective April 1, 2018 (the "Redemption Date"), at par value plus the accrued and unpaid interest thereon from January 1, 2018 through, but excluding, the Redemption Date. As part of the redemption, we recognized a realized loss on extinguishment of debt of $1.5 million in the second quarter of 2018 related to the write-off of the related unamortized deferred financing costs.
70
In November 2014, we issued $175.0 million in aggregate principal amount of 4.50% unsecured notes due 2019 (the "4.50% Notes due 2019") at an issue price of 99.53%. The 4.50% Notes due 2019 bore interest at a rate of 4.50% per year payable semiannually on June 1 and December 1 of each year. On December 2, 2019, we repaid the entire principal amount of the issued and outstanding 4.50% Notes due 2019, effective December 1, 2019 (the "Maturity Date"), at par value plus the accrued and unpaid interest thereon from June 1, 2019 through the Maturity Date.
In November 2017, we issued $185.0 million in aggregate principal amount of 4.50% unsecured notes due 2022 (the "4.50% Notes due 2022") at an issue price of 99.16%. The 4.50% Notes due 2022 are unsecured obligations and rank pari passu with our current and future unsecured indebtedness; senior to any of our future indebtedness that expressly provides it is subordinated to the 4.50% Notes due 2022; effectively subordinated to all of our existing and future secured indebtedness, to the extent of the value of the assets securing such indebtedness, including borrowings under our Credit Facility; and structurally subordinated to all existing and future indebtedness and other obligations of any of our subsidiaries, including without limitation, the indebtedness of the Funds. The 4.50% Notes due 2022 mature on December 1, 2022, and may be redeemed in whole or in part at any time at our option subject to certain make-whole provisions. The 4.50% Notes due 2022 bear interest at a rate of 4.50% per year payable semiannually on June 1 and December 1 of each year. We may from time to time repurchase 4.50% Notes due 2022 in accordance with the 1940 Act and the rules promulgated thereunder. As of December 31, 2019, the outstanding balance of the 4.50% Notes due 2022 was $185.0 million.
The indenture governing the 4.50% Notes due 2022 (the "4.50% Notes due 2022 Indenture") contains certain covenants, including covenants requiring our compliance with (regardless of whether we are subject to) the asset coverage requirements set forth in Section 18(a)(1)(A) as modified by Section 61(a)(1) of the 1940 Act, as well as covenants requiring us to provide financial information to the holders of the 4.50% Notes due 2022 and the Trustee if we cease to be subject to the reporting requirements of the Exchange Act. These covenants are subject to limitations and exceptions that are described in the 4.50% Notes due 2022 Indenture.
In April 2019, we issued $250.0 million in aggregate principal amount of 5.20% unsecured Notes due 2024 (the "5.20% Notes") at an issue price of 99.125%. Subsequently, in December 2019, we issued an additional $75.0 million of the 5.20% Notes at an issue price of 105.0%. The 5.20% Notes issued in December 2019 have identical terms as, and are a part of a single series with, the 5.20% Notes issued in April 2019. The aggregate net proceeds from the 5.20% Notes issuances were used to repay a portion of the borrowings outstanding under the Credit Facility. The 5.20% Notes are unsecured obligations and rank pari passu with our current and future unsecured indebtedness; senior to any of our future indebtedness that expressly provides it is subordinated to the 5.20% Notes; effectively subordinated to all of our existing and future secured indebtedness, to the extent of the value of the assets securing such indebtedness, including borrowings under our Credit Facility; and structurally subordinated to all existing and future indebtedness and other obligations of any of our subsidiaries, including without limitation, the indebtedness of the Funds. The 5.20% Notes mature on May 1, 2024, and may be redeemed in whole or in part at any time at our option subject to certain make-whole provisions. As of December 31, 2019, the outstanding balance of the 5.20% Notes was $325.0 million.
The indenture governing the 5.20% Notes (the "5.20% Notes Indenture") contains certain covenants, including covenants requiring our compliance with (regardless of whether we are subject to) the asset coverage requirements set forth in Section 18(a)(1)(A) as modified by Section 61(a)(1) of the 1940 Act, as well as covenants requiring us to provide financial information to the holders of the 5.20% Notes and the Trustee if we cease to be subject to the reporting requirements of the Exchange Act. These covenants are subject to limitations and exceptions that are described in the 5.20% Notes Indenture.
We maintain a program with certain selling agents through which we can sell shares of our common stock by means of at-the-market offerings from time to time (the "ATM Program").
During the year ended December 31, 2017, we sold 3,944,972 shares of our common stock at a weighted-average price of $38.72 per share and raised $152.8 million of gross proceeds under the ATM
71
Program. Net proceeds were $150.9 million after commissions to the selling agents on shares sold and offering costs.
During the year ended December 31, 2018, we sold 2,060,019 shares of our common stock at a weighted-average price of $38.48 per share and raised $79.3 million of gross proceeds under the ATM Program. Net proceeds were $78.0 million after commissions to the selling agents on shares sold and offering costs.
During the year ended December 31, 2019, we sold 2,247,187 shares of our common stock at a weighted-average price of $40.05 per share and raised $90.0 million of gross proceeds under the ATM Program. Net proceeds were $88.8 million after commissions to the selling agents on shares sold and offering costs. As of December 31, 2019, 8,359,150 shares remained available for sale under the ATM Program. As of December 31, 2019, sales transactions representing 11,596 shares had not settled and were not included in shares issued and outstanding on the face of the consolidated balance sheet, but were included in the weighted-average shares outstanding in the consolidated statements of operations and in the shares used to calculate net asset value per share.
We anticipate that we will continue to fund our investment activities through existing cash and cash equivalents, cash flows generated through our ongoing operating activities, utilization of available borrowings under our Credit Facility, and a combination of future issuances of debt and equity capital. Our primary uses of funds will be investments in portfolio companies, operating expenses and cash distributions to holders of our common stock.
We periodically invest excess cash balances into marketable securities and idle funds investments. The primary investment objective of marketable securities and idle funds investments is to generate incremental cash returns on excess cash balances prior to utilizing those funds for investment in our LMM, Middle Market and Private Loan portfolio investments. Marketable securities and idle funds investments generally consist of debt investments, independently rated debt investments, certificates of deposit with financial institutions, diversified bond funds and publicly traded debt and equity investments.
If our common stock trades below our net asset value per share, we will generally not be able to issue additional common stock at the market price unless our stockholders approve such a sale and our Board of Directors makes certain determinations. We did not seek stockholder authorization to sell shares of our common stock below the then current net asset value per share of our common stock at our 2019 annual meeting of stockholders because our common stock price per share had been trading significantly above the net asset value per share of our common stock since 2011. We would therefore need future approval from our stockholders to issue shares below the then current net asset value per share.
In order to satisfy the Code requirements applicable to a RIC, we intend to distribute to our stockholders, after consideration and application of our ability under the Code to carry forward certain excess undistributed taxable income from one tax year into the next tax year, substantially all of our taxable income. In addition, as a BDC, we generally are required to meet a coverage ratio of total assets to total senior securities, which include borrowings and any preferred stock we may issue in the future, of at least 200% (or 150% if certain requirements are met). This requirement limits the amount that we may borrow. In January 2008, we received an exemptive order from the SEC to exclude SBA-guaranteed debt securities issued by MSMF and any other wholly owned subsidiaries of ours which operate as SBICs from the asset coverage requirements of the 1940 Act as applicable to us, which, in turn, enables us to fund more investments with debt capital.
Although we have been able to secure access to additional liquidity, including through the Credit Facility, public debt issuances, leverage available through the SBIC program and equity offerings, there is no assurance that debt or equity capital will be available to us in the future on favorable terms, or at all.
Recently Issued or Adopted Accounting Standards
In May 2014, the FASB issued Accounting Standards Update ("ASU") 2014-09, Revenue from Contracts with Customers (Topic 606). ASU 2014-09 supersedes the revenue recognition requirements under ASC 605,
72
Revenue Recognition, and most industry-specific guidance throughout the Industry Topics of the ASC. The core principle of the guidance is that an entity should recognize revenue to depict the transfer of promised goods or services to customers in an amount that reflects the consideration to which an entity expects to be entitled in exchange for those goods or services. Under the guidance, an entity is required to perform the following five steps: (1) identify the contract(s) with a customer; (2) identify the performance obligations in the contract; (3) determine the transaction price; (4) allocate the transaction price to the performance obligations in the contract; and (5) recognize revenue when (or as) the entity satisfies a performance obligation. The guidance significantly enhances comparability of revenue recognition practices across entities, industries, jurisdictions and capital markets. Additionally, the guidance requires improved disclosures as to the nature, amount, timing and uncertainty of revenue that is recognized. In March 2016, the FASB issued ASU 2016-08, Revenue from Contracts with Customers (Topic 606): Principal versus Agent Considerations (Reporting Revenue Gross versus Net), which clarified the implementation guidance on principal versus agent considerations. In April 2016, the FASB issued ASU 2016-10, Revenue from Contracts with Customers (Topic 606): Identifying Performance Obligations and Licensing, which clarified the implementation guidance regarding performance obligations and licensing arrangements. In May 2016, the FASB issued ASU No. 2016-12, Revenue from Contracts with Customers (Topic 606) — Narrow-Scope Improvements and Practical Expedients, which clarified guidance on assessing collectability, presenting sales tax, measuring noncash consideration, and certain transition matters. In December 2016, the FASB issued ASU No. 2016-20, Revenue from Contracts with Customers (Topic 606) — Technical Corrections and Improvements, which provided disclosure relief, and clarified the scope and application of the new revenue standard and related cost guidance. The guidance was effective for the annual reporting period beginning after December 15, 2017, including interim periods within that reporting period. Substantially all of our income is outside the scope of ASU 2014-09. For those income items that are within the scope (primarily fee income), we have similar performance obligations as compared with deliverables and separate units of account previously identified. As a result, our timing of income recognition remains the same and the adoption of the standard did not have a material impact on the consolidated financial statements.
In February 2016, the FASB issued ASU 2016-02, Leases, which amended the FASB Accounting Standards Codification and created ASC 842, Leases ("ASC 842"), to require lessees to recognize on the balance sheet a right-of-use asset, representing its right to use the underlying asset for the lease term, and a lease liability for all leases with terms greater than 12 months, utilizing a modified retrospective transition approach, which includes a number of optional practical expedients that entities may elect to apply. The guidance in ASC 842 also requires qualitative and quantitative disclosures designed to assess the amount, timing and uncertainty of cash flows arising from leases. We adopted ASC 842 effective January 1, 2019. Under ASC 842, we evaluate leases to determine if the leases are considered financing or operating leases. We currently have one operating lease for office space for which we have recorded a right-of-use asset and lease liability for the operating lease obligation. Non-lease components (maintenance, property tax, insurance and parking) are not included in the lease cost. The lease asset is presented as a single lease cost that is amortized on a straight-line basis over the life of the lease.
In August 2016, the FASB issued ASU 2016-15, Statement of Cash Flows (Topic 230), which is intended to reduce the existing diversity in practice in how certain cash receipts and cash payments are presented and classified in the statement of cash flows. The guidance was effective for annual periods beginning after December 15, 2017, and interim periods therein. We adopted ASU 2016-15 effective January 1, 2018. The impact of the adoption of this accounting standard on our consolidated financial statements was not material.
In August 2018, the FASB issued ASU 2018-13, Fair Value Measurement (Topic 820), which is intended to improve fair value and defined benefit disclosure requirements by removing disclosures that are not cost-beneficial, clarifying disclosures' specific requirements, and adding relevant disclosure requirements. The amendments take effect for all organizations for fiscal years, and interim periods within those fiscal years, beginning after December 15, 2019. Early adoption is permitted. We elected to early adopt ASU 2018-13 during the year ended December 31, 2018. No significant changes to our fair value disclosures were necessary in the notes to the consolidated financial statements in order to comply with ASU 2018-13.
73
In August 2018, the SEC adopted rules (the "SEC Release") amending certain disclosure requirements intended to eliminate redundant, duplicative, overlapping, outdated or superseded, in light of other SEC disclosure requirements, U.S. GAAP requirements or changes in the information environment. In part, the SEC Release requires an investment company to present distributable earnings in total on the consolidated balance sheet and consolidated statement of changes in net assets, rather than showing the three components of distributable earnings as previously shown. We adopted this part of the SEC Release during the year ended December 31, 2018. The impact of the adoption of these rules on our consolidated financial statements was not material. Additionally, the SEC Release requires disclosure of changes in net assets within a registrant's Form 10-Q filing on a quarter-to-date and year-to-date basis for both the current year and prior year comparative periods. We adopted the new requirement to present changes in net assets in interim financial statements within Form 10-Q filings effective January 1, 2019. The adoption of these rules did not have a material impact on the consolidated financial statements.
From time to time, new accounting pronouncements are issued by the FASB or other standards setting bodies that are adopted by us as of the specified effective date. We believe that the impact of recently issued standards and any that are not yet effective will not have a material impact on our consolidated financial statements upon adoption.
Inflation
Inflation has not had a significant effect on our results of operations in any of the reporting periods presented herein. However, our portfolio companies have experienced, and may in the future experience, the impacts of inflation on their operating results, including periodic escalations in their costs for labor, raw materials and third-party services and required energy consumption.
Off-Balance Sheet Arrangements
We may be a party to financial instruments with off-balance sheet risk in the normal course of business to meet the financial needs of our portfolio companies. These instruments include commitments to extend credit and fund equity capital and involve, to varying degrees, elements of liquidity and credit risk in excess of the amount recognized in the balance sheet. At December 31, 2019, we had a total of $120.4 million in outstanding commitments comprised of (i) 37 investments with commitments to fund revolving loans that had not been fully drawn or term loans with additional commitments not yet funded and (ii) 10 investments with equity capital commitments that had not been fully called.
Contractual Obligations
As of December 31, 2019, the future fixed commitments for cash payments in connection with our SBIC debentures, the 4.50% Notes due 2022, the 5.20% Notes and rent obligations under our office lease for each of the next five years and thereafter are as follows:
| |
2020 | 2021 | 2022 | 2023 | 2024 | Thereafter | Total | |||||||||||||||
|---|---|---|---|---|---|---|---|---|---|---|---|---|---|---|---|---|---|---|---|---|---|---|
SBIC debentures |
$ | 37,000 | $ | 40,000 | $ | 5,000 | $ | 16,000 | $ | 63,800 | $ | 150,000 | $ | 311,800 | ||||||||
Interest due on SBIC debentures |
11,271 | 9,260 | 8,248 | 7,868 | 6,418 | 16,899 | 59,964 | |||||||||||||||
4.50% Notes due 2022 |
— | — | 185,000 | — | — | — | 185,000 | |||||||||||||||
Interest due on 4.50% Notes due 2022 |
8,325 | 8,325 | 8,325 | — | — | — | 24,975 | |||||||||||||||
5.20% Notes due 2024 |
— | — | — | — | — | 325,000 | 325,000 | |||||||||||||||
Interest due on 5.20% Notes |
16,900 | 16,900 | 16,900 | 16,900 | 8,450 | — | 76,050 | |||||||||||||||
Operating Lease Obligation(1) |
762 | 776 | 790 | 804 | 818 | 2,611 | 6,561 | |||||||||||||||
| | | | | | | | | | | | | | | | | | | | | | | |
Total |
$ | 74,258 | $ | 75,261 | $ | 224,263 | $ | 41,572 | $ | 79,486 | $ | 494,510 | $ | 989,350 | ||||||||
| | | | | | | | | | | | | | | | | | | | | | | |
| | | | | | | | | | | | | | | | | | | | | | | |
| | | | | | | | | | | | | | | | | | | | | | | |
74
As of December 31, 2019, we had $300.0 million in borrowings outstanding under our Credit Facility, and the Credit Facility is currently scheduled to mature in September 2023. The Credit Facility contains two, one-year extension options which could extend the maturity to September 2025, subject to lender approval. See further discussion of the Credit Facility terms in "— Liquidity and Capital Resources — Capital Resources."
Related Party Transactions
As discussed further above, the External Investment Manager is treated as a wholly owned portfolio company of MSCC and is included as part of our Investment Portfolio. At December 31, 2019, we had a receivable of approximately $2.7 million due from the External Investment Manager which included approximately $1.6 million primarily related to operating expenses incurred by us as required to support the External Investment Manager's business and amounts due from the External Investment Manager to Main Street under a tax sharing agreement (see further discussion above in "— Critical Accounting Policies — Income Taxes") and approximately $1.1 million of dividends declared but not paid by the External Investment Manager.
In November 2015, our Board of Directors approved and adopted the Main Street Capital Corporation Deferred Compensation Plan (the "2015 Deferred Compensation Plan"). The 2015 Deferred Compensation Plan became effective on January 1, 2016 and replaced the Deferred Compensation Plan for Non-Employee Directors previously adopted by the Board of Directors in June 2013 (the "2013 Deferred Compensation Plan"). Under the 2015 Deferred Compensation Plan, non-employee directors and certain key employees may defer receipt of some or all of their cash compensation and directors' fees, subject to certain limitations. Individuals participating in the 2015 Deferred Compensation Plan receive distributions of their respective balances based on predetermined payout schedules or other events as defined by the plan and are also able to direct investments made on their behalf among investment alternatives permitted from time to time under the plan, including phantom Main Street stock units. As of December 31, 2019, $8.0 million of compensation and directors' fees had been deferred under the 2015 Deferred Compensation Plan (including amounts previously deferred under the 2013 Deferred Compensation Plan). Of this amount, $4.2 million was deferred into phantom Main Street stock units, representing 119,064 shares of our common stock. Including phantom stock units issued through dividend reinvestment and net of any shares distributed, the phantom stock units outstanding as of December 31, 2019 represented 150,955 shares of our common stock. Any amounts deferred under the plan represented by phantom Main Street stock units will not be issued or included as outstanding on the consolidated statements of changes in net assets until such shares are actually distributed to the participant in accordance with the plan, but the related phantom stock units are included in weighted-average shares outstanding with the related dollar amount of the deferral included in total expenses in Main Street's consolidated statements of operations as earned. The dividend amounts related to additional phantom stock units are included in the statement of changes in net assets as an increase to dividends to stockholders offset by a corresponding increase to additional paid-in capital.
Recent Developments
During February 2020, we declared regular monthly dividends of $0.205 per share for each month of April, May and June 2020. These regular monthly dividends equal a total of $0.615 per share for the second quarter of 2020 and represent a 2.5% increase from the dividends declared for the second quarter of 2019. Including the dividends declared for the second quarter of 2020, we will have paid $28.370 per share in cumulative dividends since our October 2007 initial public offering.
Item 7A. Quantitative and Qualitative Disclosures about Market Risk
We are subject to financial market risks, including changes in interest rates. Changes in interest rates may affect both our interest expense on the debt outstanding under our Credit Facility and our interest income from portfolio investments. Our risk management systems and procedures are designed to identify and analyze our risk, to set appropriate policies and limits and to continually monitor these risks. Our investment
75
income will be affected by changes in various interest rates, including LIBOR and prime rates, to the extent that any debt investments include floating interest rates. See "Risk Factors — Risks Relating to Our Business and Structure — The interest rates of our floating-rate loans to our portfolio companies and for any of our borrowings that extend beyond 2021 might be subject to change based on recent regulatory changes." for more information regarding risks associated with our debt investments and borrowings that utilize LIBOR as a reference rate.
The majority of our debt investments are made with either fixed interest rates or floating-rates that are subject to contractual minimum interest rates for the term of the investment. As of December 31, 2019, approximately 74% of our debt investment portfolio (at cost) bore interest at floating rates, 88% of which were subject to contractual minimum interest rates. Our interest expense will be affected by changes in the published LIBOR rate in connection with our Credit Facility; however, the interest rates on our outstanding SBIC debentures, 4.50% Notes due 2022 and 5.20% Notes, which collectively comprise the majority of our outstanding debt, are fixed for the life of such debt. As of December 31, 2019, we had not entered into any interest rate hedging arrangements. Due to our limited use of derivatives, we have claimed an exclusion from the definition of the term "commodity pool operator" under the Commodity Exchange Act and, therefore, are not subject to registration or regulation as a pool operator under such Act. The following table shows the approximate annualized increase or decrease in the components of net investment income due to hypothetical base rate changes in interest rates, assuming no changes in our investments and borrowings as of December 31, 2019.
Basis Point Change
|
Increase (Decrease) in Interest Income |
(Increase) Decrease in Interest Expense |
Increase (Decrease) in Net Investment Income |
Increase (Decrease) in Net Investment Income per Share |
|||||||||
|---|---|---|---|---|---|---|---|---|---|---|---|---|---|
| |
(dollars in thousands) |
||||||||||||
(200) |
$ | (13,324 | ) | $ | 5,288 | $ | (8,036 | ) | $ | (0.13 | ) | ||
(175) |
(13,175 | ) | 5,250 | (7,925 | ) | (0.12 | ) | ||||||
(150) |
(12,724 | ) | 4,500 | (8,224 | ) | (0.13 | ) | ||||||
(125) |
(12,236 | ) | 3,750 | (8,486 | ) | (0.13 | ) | ||||||
(100) |
(11,734 | ) | 3,000 | (8,734 | ) | (0.14 | ) | ||||||
(75) |
(10,017 | ) | 2,250 | (7,767 | ) | (0.12 | ) | ||||||
(50) |
(6,747 | ) | 1,500 | (5,247 | ) | (0.08 | ) | ||||||
(25) |
(3,414 | ) | 750 | (2,664 | ) | (0.04 | ) | ||||||
25 |
3,455 | (750 | ) | 2,705 | 0.04 | ||||||||
50 |
7,007 | (1,500 | ) | 5,507 | 0.09 | ||||||||
100 |
14,112 | (3,000 | ) | 11,112 | 0.17 | ||||||||
200 |
28,322 | (6,000 | ) | 22,322 | 0.35 | ||||||||
The hypothetical results assume that all LIBOR and prime rate changes would be effective on the first day of the period. However, the contractual LIBOR and prime rate reset dates would vary throughout the period, on either a monthly or quarterly basis, for both our investments and our Credit Facility. The hypothetical results would also be impacted by the changes in the amount of debt outstanding under our Credit Facility (with an increase (decrease) in the debt outstanding under the Credit Facility resulting in an (increase) decrease in the hypothetical interest expense).
76
Item 8. Consolidated Financial Statements and Supplementary Data
Index to Consolidated Financial Statements
77
Report of Independent Registered Public Accounting Firm
Board
of Directors and Stockholders
Main Street Capital Corporation
Opinion on the financial statements
We have audited the accompanying consolidated balance sheets of Main Street Capital Corporation (a Maryland corporation) and subsidiaries (the "Company"), including the consolidated schedule of investments, as of December 31, 2019 and 2018, the related consolidated statements of operations, changes in net assets, and cash flows for each of the three years in the period ended December 31, 2019, and the related notes, schedule and financial highlights (collectively referred to as the "financial statements"). In our opinion, the financial statements present fairly, in all material respects, the financial position of the Company as of December 31, 2019 and 2018, and the results of its operations and its cash flows for each of the three years in the period ended December 31, 2019, in conformity with accounting principles generally accepted in the United States of America.
We also have audited, in accordance with the standards of the Public Company Accounting Oversight Board (United States) ("PCAOB"), the Company's internal control over financial reporting as of December 31, 2019, based on criteria established in the 2013 Internal Control — Integrated Framework issued by the Committee of Sponsoring Organizations of the Treadway Commission ("COSO"), and our report dated February 28, 2020 expressed an unqualified opinion.
Basis for opinion
These financial statements are the responsibility of the Company's management. Our responsibility is to express an opinion on the Company's financial statements based on our audits. We are a public accounting firm registered with the PCAOB and are required to be independent with respect to the Company in accordance with the U.S. federal securities laws and the applicable rules and regulations of the Securities and Exchange Commission and the PCAOB.
We conducted our audits in accordance with the standards of the PCAOB. Those standards require that we plan and perform the audit to obtain reasonable assurance about whether the financial statements are free of material misstatement, whether due to error or fraud. Our audits included performing procedures to assess the risks of material misstatement of the financial statements, whether due to error or fraud, and performing procedures that respond to those risks. Such procedures included examining, on a test basis, evidence supporting the amounts and disclosures in the financial statements. Our audits also included evaluating the accounting principles used and significant estimates made by management, as well as evaluating the overall presentation of the financial statements. Our procedures included verification by confirmation of securities as of December 31, 2019 and 2018, by correspondence with the portfolio companies and custodians, or by other appropriate auditing procedures where replies were not received. We believe that our audits provide a reasonable basis for our opinion.
Critical audit matters
The critical audit matter communicated below is a matter arising from the current period audit of the consolidated financial statements that were communicated or required to be communicated to the Audit Committee and that: (1) relate to accounts or disclosures that are material to the financial statements and (2) involved our especially challenging, subjective, or complex judgments. The communication of critical audit matters does not alter in any way our opinion on the consolidated financial statements, taken as a whole, and we are not, by communicating the critical audit matter below, providing a separate opinion on the critical audit matter or on the accounts or disclosures to which it relates.
78
Fair Value Investments
As described further in Note C to the consolidated financial statements, the Company's consolidated fair value balance of total investments was $2,602,323,527 at December 31, 2019. Investment values are generally based on prices or valuation techniques that require inputs that are significant to the overall fair value measurement, and are observable in non-active markets or unobservable. The determination of the fair value of investments requires management to make significant estimates and assumptions in the determination of fair value. As disclosed by management, changes in these assumptions could have a significant impact on the determination of fair value. As such, we identified fair value of investments as a critical audit matter.
The principal considerations for our determination that the fair value of investments was a critical audit matter are that they relate to material accounts to the financial statements and involve complex judgment.
The primary procedures we performed to address this critical audit matter included:
/s/ GRANT THORNTON LLP
We
have served as the Company's auditor since 2007.
Houston, Texas
February 28, 2020
79
Report of Independent Registered Public Accounting Firm
Board
of Directors and Stockholders
Main Street Capital Corporation
Opinion on internal control over financial reporting
We have audited the internal control over financial reporting of Main Street Capital Corporation (a Maryland corporation) and subsidiaries (the "Company") as of December 31, 2019, based on criteria established in the 2013 Internal Control — Integrated Framework issued by the Committee of Sponsoring Organizations of the Treadway Commission ("COSO"). In our opinion, the Company maintained, in all material respects, effective internal control over financial reporting as of December 31, 2019, based on criteria established in the 2013 Internal Control — Integrated Framework issued by COSO.
We also have audited, in accordance with the standards of the Public Company Accounting Oversight Board (United States) ("PCAOB"), the consolidated financial statements of the Company as of and for the year ended December 31, 2019, and our report dated February 28, 2020 expressed an unqualified opinion on those financial statements.
Basis for opinion
The Company's management is responsible for maintaining effective internal control over financial reporting and for its assessment of the effectiveness of internal control over financial reporting, included in the accompanying Management's Report on Internal Control over Financial Reporting. Our responsibility is to express an opinion on the Company's internal control over financial reporting based on our audit. We are a public accounting firm registered with the PCAOB and are required to be independent with respect to the Company in accordance with the U.S. federal securities laws and the applicable rules and regulations of the Securities and Exchange Commission and the PCAOB.
We conducted our audit in accordance with the standards of the PCAOB. Those standards require that we plan and perform the audit to obtain reasonable assurance about whether effective internal control over financial reporting was maintained in all material respects. Our audit included obtaining an understanding of internal control over financial reporting, assessing the risk that a material weakness exists, testing and evaluating the design and operating effectiveness of internal control based on the assessed risk, and performing such other procedures as we considered necessary in the circumstances. We believe that our audit provides a reasonable basis for our opinion.
Definition and limitations of internal control over financial reporting
A company's internal control over financial reporting is a process designed to provide reasonable assurance regarding the reliability of financial reporting and the preparation of financial statements for external purposes in accordance with generally accepted accounting principles. A company's internal control over financial reporting includes those policies and procedures that (1) pertain to the maintenance of records that, in reasonable detail, accurately and fairly reflect the transactions and dispositions of the assets of the company; (2) provide reasonable assurance that transactions are recorded as necessary to permit preparation of financial statements in accordance with generally accepted accounting principles, and that receipts and expenditures of the company are being made only in accordance with authorizations of management and directors of the company; and (3) provide reasonable assurance regarding prevention or timely detection of unauthorized acquisition, use, or disposition of the company's assets that could have a material effect on the financial statements.
Because of its inherent limitations, internal control over financial reporting may not prevent or detect misstatements. Also, projections of any evaluation of effectiveness to future periods are subject to the risk that controls may become inadequate because of changes in conditions, or that the degree of compliance with the policies or procedures may deteriorate.
/s/ GRANT THORNTON LLP
Houston,
Texas
February 28, 2020
80
MAIN STREET CAPITAL CORPORATION
Consolidated Balance Sheets
(dollars in thousands, except shares and per share amounts)
| |
December 31, 2019 |
December 31, 2018 |
|||||
|---|---|---|---|---|---|---|---|
ASSETS |
|||||||
Investments at fair value: |
|||||||
Control investments (cost: $778,367 and $750,618 as of December 31, 2019 and December 31, 2018, respectively) |
$ | 1,032,721 | $ | 1,004,993 | |||
Affiliate investments (cost: $351,764 and $381,307 as of December 31, 2019 and December 31, 2018, respectively) |
330,287 | 359,890 | |||||
Non-Control/Non-Affiliate investments (cost: $1,297,587 and $1,137,108 as of December 31, 2019 and December 31, 2018, respectively) |
1,239,316 | 1,089,026 | |||||
| | | | | | | | |
Total investments (cost: $2,427,718 and $2,269,033 as of December 31, 2019 and December 31, 2018, respectively) |
2,602,324 | 2,453,909 | |||||
Cash and cash equivalents |
55,246 |
54,181 |
|||||
Interest receivable and other assets |
50,458 | 39,674 | |||||
Receivable for securities sold |
— | 1,201 | |||||
Deferred financing costs (net of accumulated amortization of $7,501 and $6,562 as of December 31, 2019 and December 31, 2018, respectively) |
3,521 | 4,461 | |||||
| | | | | | | | |
Total assets |
$ | 2,711,549 | $ | 2,553,426 | |||
| | | | | | | | |
| | | | | | | | |
| | | | | | | | |
LIABILITIES |
|||||||
Credit facility |
$ |
300,000 |
$ |
301,000 |
|||
SBIC debentures (par: $311,800 ($37,000 due within one year) and $345,800 as of December 31, 2019 and December 31, 2018, respectively) |
306,188 | 338,186 | |||||
5.20% Notes due 2024 (par: $325,000 as of December 31, 2019) |
324,595 | — | |||||
4.50% Notes due 2022 (par: $185,000 as of both December 31, 2019 and December 31, 2018) |
183,229 | 182,622 | |||||
4.50% Notes due 2019 (par: $175,000 as of December 31, 2018) |
— | 174,338 | |||||
Accounts payable and other liabilities |
24,532 | 17,962 | |||||
Payable for securities purchased |
— | 28,254 | |||||
Interest payable |
7,292 | 6,041 | |||||
Dividend payable |
13,174 | 11,948 | |||||
Deferred tax liability, net |
16,149 | 17,026 | |||||
| | | | | | | | |
Total liabilities |
1,175,159 | 1,077,377 | |||||
Commitments and contingencies (Note K) |
|||||||
NET ASSETS |
|||||||
Common stock, $0.01 par value per share (150,000,000 shares authorized; 64,241,341 and 61,264,861 shares issued and outstanding as of December 31, 2019 and December 31, 2018, respectively) |
643 |
613 |
|||||
Additional paid-in capital |
1,512,435 | 1,409,945 | |||||
Total undistributed earnings |
23,312 | 65,491 | |||||
| | | | | | | | |
Total net assets |
1,536,390 | 1,476,049 | |||||
| | | | | | | | |
Total liabilities and net assets |
$ | 2,711,549 | $ | 2,553,426 | |||
| | | | | | | | |
| | | | | | | | |
| | | | | | | | |
NET ASSET VALUE PER SHARE |
$ | 23.91 | $ | 24.09 | |||
| | | | | | | | |
| | | | | | | | |
| | | | | | | | |
The accompanying notes are an integral part of these consolidated financial statements
81
MAIN STREET CAPITAL CORPORATION
Consolidated Statements of Operations
(dollars in thousands, except shares and per share amounts)
| |
Twelve Months Ended December 31, | |||||||||
|---|---|---|---|---|---|---|---|---|---|---|
| |
2019 | 2018 | 2017 | |||||||
INVESTMENT INCOME: |
||||||||||
Interest, fee and dividend income: |
||||||||||
Control investments |
$ | 92,414 | $ | 85,853 | $ | 62,762 | ||||
Affiliate investments |
34,732 | 36,800 | 37,509 | |||||||
Non-Control/Non-Affiliate investments |
116,227 | 110,702 | 105,470 | |||||||
| | | | | | | | | | | |
Total investment income |
243,373 | 233,355 | 205,741 | |||||||
EXPENSES: |
||||||||||
Interest |
(50,258 | ) | (43,493 | ) | (36,479 | ) | ||||
Compensation |
(19,792 | ) | (18,966 | ) | (18,560 | ) | ||||
General and administrative |
(12,546 | ) | (11,868 | ) | (11,674 | ) | ||||
Share-based compensation |
(10,083 | ) | (9,151 | ) | (10,027 | ) | ||||
Expenses allocated to the External Investment Manager |
6,672 | 6,768 | 6,370 | |||||||
| | | | | | | | | | | |
Total expenses |
(86,007 | ) | (76,710 | ) | (70,370 | ) | ||||
| | | | | | | | | | | |
NET INVESTMENT INCOME |
157,366 | 156,645 | 135,371 | |||||||
NET REALIZED GAIN (LOSS): |
||||||||||
Control investments |
4,797 | 4,681 | 259 | |||||||
Affiliate investments |
(565 | ) | 20 | 8,044 | ||||||
Non-Control/Non-Affiliate investments |
(19,344 | ) | (3,360 | ) | 7,879 | |||||
Realized loss on extinguishment of debt |
(5,689 | ) | (2,896 | ) | (5,217 | ) | ||||
| | | | | | | | | | | |
Total net realized gain (loss) |
(20,801 | ) | (1,555 | ) | 10,965 | |||||
| | | | | | | | | | | |
NET UNREALIZED APPRECIATION (DEPRECIATION): |
||||||||||
Control investments |
(980 | ) | 37,826 | 63,627 | ||||||
Affiliate investments |
990 | 12,062 | (11,330 | ) | ||||||
Non-Control/Non-Affiliate investments |
(10,214 | ) | (31,907 | ) | (9,752 | ) | ||||
SBIC debentures |
4,450 | 1,294 | 6,212 | |||||||
| | | | | | | | | | | |
Total net unrealized appreciation (depreciation) |
(5,754 | ) | 19,275 | 48,757 | ||||||
| | | | | | | | | | | |
INCOME TAXES: |
||||||||||
Federal and state income, excise and other taxes |
(3,546 | ) | (319 | ) | (5,206 | ) | ||||
Deferred taxes |
2,304 | (5,833 | ) | (19,265 | ) | |||||
| | | | | | | | | | | |
Income tax provision |
(1,242 | ) | (6,152 | ) | (24,471 | ) | ||||
| | | | | | | | | | | |
NET INCREASE IN NET ASSETS RESULTING FROM OPERATIONS |
$ | 129,569 | $ | 168,213 | $ | 170,622 | ||||
| | | | | | | | | | | |
| | | | | | | | | | | |
| | | | | | | | | | | |
NET INVESTMENT INCOME PER SHARE — BASIC AND DILUTED |
$ | 2.50 | $ | 2.60 | $ | 2.39 | ||||
| | | | | | | | | | | |
| | | | | | | | | | | |
| | | | | | | | | | | |
NET INCREASE IN NET ASSETS RESULTING FROM OPERATIONS PER SHARE — BASIC AND DILUTED |
$ | 2.06 | $ | 2.80 | $ | 3.01 | ||||
| | | | | | | | | | | |
| | | | | | | | | | | |
| | | | | | | | | | | |
WEIGHTED AVERAGE SHARES OUTSTANDING — BASIC AND DILUTED |
62,960,591 | 60,176,843 | 56,691,913 | |||||||
The accompanying notes are an integral part of these consolidated financial statements
82
MAIN STREET CAPITAL CORPORATION
Consolidated Statements of Changes in Net Assets
(dollars in thousands, except shares)
| |
Common Stock | |
|
|
||||||||||||
|---|---|---|---|---|---|---|---|---|---|---|---|---|---|---|---|---|
| |
Number of Shares |
Par Value |
Additional Paid-In Capital |
Total Undistributed Earnings |
Total Net Asset Value |
|||||||||||
Balances at December 31, 2016 |
54,354,857 | $ | 543 | $ | 1,143,883 | $ | 57,055 | $ | 1,201,481 | |||||||
Public offering of common stock, net of offering costs |
3,947,165 | 40 | 150,946 | — | 150,986 | |||||||||||
Share-based compensation |
— | — | 10,027 | — | 10,027 | |||||||||||
Purchase of vested stock for employee payroll tax withholding |
(113,371 | ) | (1 | ) | (4,350 | ) | — | (4,351 | ) | |||||||
Investment through issuance of unregistered shares |
11,464 | — | 442 | — | 442 | |||||||||||
Dividend reinvestment |
234,513 | 2 | 9,154 | — | 9,156 | |||||||||||
Amortization of directors' deferred compensation |
— | — | 680 | — | 680 | |||||||||||
Issuance of restricted stock |
226,052 | 2 | (2 | ) | — | — | ||||||||||
Dividends to stockholders |
— | — | — | (158,675 | ) | (158,675 | ) | |||||||||
Net increase resulting from operations |
— | — | — | 170,622 | 170,622 | |||||||||||
| | | | | | | | | | | | | | | | | |
Balances at December 31, 2017 |
58,660,680 | $ | 586 | $ | 1,310,780 | $ | 69,002 | $ | 1,380,368 | |||||||
| | | | | | | | | | | | | | | | | |
| | | | | | | | | | | | | | | | | |
| | | | | | | | | | | | | | | | | |
Public offering of common stock, net of offering costs |
2,069,103 | 21 | 78,373 | — | 78,394 | |||||||||||
Share-based compensation |
— | — | 9,151 | — | 9,151 | |||||||||||
Purchase of vested stock for employee payroll tax withholding |
(109,693 | ) | (1 | ) | (4,076 | ) | — | (4,077 | ) | |||||||
Dividend reinvestment |
394,403 | 4 | 14,870 | — | 14,874 | |||||||||||
Amortization of directors' deferred compensation |
— | — | 850 | — | 850 | |||||||||||
Issuance of restricted stock, net of forfeited shares |
250,368 | 3 | (3 | ) | — | — | ||||||||||
Dividends to stockholders |
— | — | — | (171,724 | ) | (171,724 | ) | |||||||||
Net increase resulting from operations |
— | — | — | 168,213 | 168,213 | |||||||||||
| | | | | | | | | | | | | | | | | |
Balances at December 31, 2018 |
61,264,861 | $ | 613 | $ | 1,409,945 | $ | 65,491 | $ | 1,476,049 | |||||||
| | | | | | | | | | | | | | | | | |
| | | | | | | | | | | | | | | | | |
| | | | | | | | | | | | | | | | | |
Public offering of common stock, net of offering costs |
2,259,729 | 23 | 89,246 | — | 89,269 | |||||||||||
Share-based compensation |
— | — | 10,083 | — | 10,083 | |||||||||||
Purchase of vested stock for employee payroll tax withholding |
(103,730 | ) | (1 | ) | (3,941 | ) | — | (3,942 | ) | |||||||
Dividend reinvestment |
441,927 | 4 | 18,081 | — | 18,085 | |||||||||||
Amortization of directors' deferred compensation |
— | — | 866 | — | 866 | |||||||||||
Issuance of restricted stock, net of forfeited shares |
390,150 | 4 | (4 | ) | — | — | ||||||||||
Dividends to stockholders |
— | — | 401 | (183,990 | ) | (183,589 | ) | |||||||||
Reclassification for certain permanent book-to-tax differences |
— | — | (12,242 | ) | 12,242 | — | ||||||||||
Net increase resulting from operations |
— | — | — | 129,569 | 129,569 | |||||||||||
| | | | | | | | | | | | | | | | | |
Balances at December 31, 2019 |
64,252,937 | $ | 643 | $ | 1,512,435 | $ | 23,312 | $ | 1,536,390 | |||||||
| | | | | | | | | | | | | | | | | |
| | | | | | | | | | | | | | | | | |
| | | | | | | | | | | | | | | | | |
The accompanying notes are an integral part of these consolidated financial statements
83
MAIN STREET CAPITAL CORPORATION
Consolidated Statements of Cash Flows
(dollars in thousands)
| |
Twelve Months Ended December 31, | |||||||||
|---|---|---|---|---|---|---|---|---|---|---|
| |
2019 | 2018 | 2017 | |||||||
CASH FLOWS FROM OPERATING ACTIVITIES |
||||||||||
Net increase in net assets resulting from operations |
$ | 129,569 | $ | 168,213 | $ | 170,622 | ||||
Adjustments to reconcile net increase in net assets resulting from operations to net cash provided by (used in) operating activities: |
||||||||||
Investments in portfolio companies |
(664,062 | ) | (962,456 | ) | (876,744 | ) | ||||
Proceeds from sales and repayments of debt investments in portfolio companies |
439,363 | 626,059 | 737,297 | |||||||
Proceeds from sales and return of capital of equity investments in portfolio companies |
38,536 | 77,103 | 82,128 | |||||||
Net unrealized (appreciation) depreciation |
5,754 | (19,275 | ) | (48,757 | ) | |||||
Net realized (gain) loss |
20,801 | 1,555 | (10,965 | ) | ||||||
Accretion of unearned income |
(12,070 | ) | (14,724 | ) | (17,008 | ) | ||||
Payment-in-kind interest |
(5,018 | ) | (2,304 | ) | (4,884 | ) | ||||
Cumulative dividends |
(2,382 | ) | (2,301 | ) | (3,226 | ) | ||||
Share-based compensation expense |
10,083 | 9,151 | 10,027 | |||||||
Amortization of deferred financing costs |
3,717 | 3,299 | 2,784 | |||||||
Deferred tax (benefit) provision |
(2,304 | ) | 5,833 | 19,265 | ||||||
Changes in other assets and liabilities: |
||||||||||
Interest receivable and other assets |
(6,680 | ) | (2,276 | ) | 2,080 | |||||
Interest payable |
1,251 | 768 | 1,170 | |||||||
Accounts payable and other liabilities |
7,436 | (1,356 | ) | 6,643 | ||||||
Deferred fees and other |
2,172 | 3,645 | 2,470 | |||||||
| | | | | | | | | | | |
Net cash provided by (used in) operating activities |
(33,834 | ) | (109,066 | ) | 72,902 | |||||
CASH FLOWS FROM FINANCING ACTIVITIES |
||||||||||
Proceeds from public offering of common stock, net of offering costs |
89,269 | 78,394 | 150,986 | |||||||
Proceeds from public offering of 4.50% Notes due 2022 |
— | — | 185,000 | |||||||
Proceeds from public offering of 5.20% Notes due 2024 |
325,000 | — | — | |||||||
Dividends paid |
(164,278 | ) | (156,048 | ) | (148,421 | ) | ||||
Proceeds from issuance of SBIC debentures |
— | 54,000 | 81,000 | |||||||
Repayments of SBIC debentures |
(34,000 | ) | (4,000 | ) | (25,200 | ) | ||||
Redemption of 6.125% Notes |
— | (90,655 | ) | — | ||||||
Redemption of 4.50% Notes due 2019 |
(175,000 | ) | — | — | ||||||
Proceeds from credit facility |
639,000 | 632,000 | 448,000 | |||||||
Repayments on credit facility |
(640,000 | ) | (395,000 | ) | (727,000 | ) | ||||
Payment of deferred issuance costs and SBIC debenture fees |
(1,150 | ) | (2,895 | ) | (5,868 | ) | ||||
Purchases of vested stock for employee payroll tax withholding |
(3,942 | ) | (4,077 | ) | (4,351 | ) | ||||
| | | | | | | | | | | |
Net cash provided by (used in) financing activities |
34,899 | 111,719 | (45,854 | ) | ||||||
Net increase in cash and cash equivalents |
1,065 | 2,653 | 27,048 | |||||||
CASH AND CASH EQUIVALENTS AT BEGINNING OF PERIOD |
54,181 | 51,528 | 24,480 | |||||||
| | | | | | | | | | | |
CASH AND CASH EQUIVALENTS AT END OF PERIOD |
$ | 55,246 | $ | 54,181 | $ | 51,528 | ||||
| | | | | | | | | | | |
| | | | | | | | | | | |
| | | | | | | | | | | |
Supplemental cash flow disclosures: |
||||||||||
Interest paid |
$ | 45,167 | $ | 39,300 | $ | 32,411 | ||||
Taxes paid |
$ | 2,300 | $ | 5,112 | $ | 2,398 | ||||
Operating non-cash activities: |
||||||||||
Right-of-use assets obtained in exchange for operating lease liabilities |
$ | 5,240 | $ | — | $ | — | ||||
Non-cash financing activities: |
||||||||||
Shares issued pursuant to the DRIP |
$ | 18,085 | $ | 14,874 | $ | 9,156 | ||||
The accompanying notes are an integral part of these consolidated financial statements
84
MAIN STREET CAPITAL CORPORATION
Consolidated Schedule of Investments
December 31, 2019
(dollars in thousands)
| Portfolio Company(1)(20) |
Investment Date(26) |
Business Description |
Type of Investment(2)(3)(25) |
Principal(4) |
Cost(4) |
Fair Value(18) |
||||||||||
|---|---|---|---|---|---|---|---|---|---|---|---|---|---|---|---|---|
Control Investments(5) |
|
|
||||||||||||||
|
||||||||||||||||
Access Media Holdings, LLC(10) |
July 22, 2015 | Private Cable Operator |
||||||||||||||
|
10% PIK Secured Debt (Maturity — July 22, 2020)(14)(19) |
$ | 23,828 | $ | 23,828 | $ | 6,387 | |||||||||
|
Preferred Member Units (9,481,500 units)(27) |
9,375 | (284 | ) | ||||||||||||
|
Member Units (45 units) |
1 | — | |||||||||||||
| | | | | | | | | | | | | | | | | |
|
33,204 | 6,103 | ||||||||||||||
|
||||||||||||||||
ASC Interests, LLC |
August 1, 2013 | Recreational and Educational Shooting Facility |
||||||||||||||
|
11.00% Secured Debt (Maturity — July 31, 2020) |
1,650 | 1,639 | 1,639 | ||||||||||||
|
Member Units (1,500 units) |
1,500 | 1,290 | |||||||||||||
| | | | | | | | | | | | | | | | | |
|
3,139 | 2,929 | ||||||||||||||
|
||||||||||||||||
Analytical Systems Keco, LLC |
August 16, 2019 | Manufacturer of Liquid and Gas Analyzers |
||||||||||||||
|
LIBOR Plus 10.00% (Floor 2.00%), Current Coupon 12.13%, Secured Debt (Maturity — August 16, 2024)(9) |
5,565 | 5,210 | 5,210 | ||||||||||||
|
Preferred Member Units (3,200 units) |
3,200 | 3,200 | |||||||||||||
|
Warrants (420 equivalent shares; Expiration — August 16, 2029; Strike price — $0.01 per share) |
316 | 316 | |||||||||||||
| | | | | | | | | | | | | | | | | |
|
8,726 | 8,726 | ||||||||||||||
|
||||||||||||||||
ATS Workholding, LLC(10) |
March 10, 2014 | Manufacturer of Machine Cutting Tools and Accessories |
||||||||||||||
|
5% Secured Debt (Maturity — November 16, 2021) |
4,919 | 4,666 | 4,521 | ||||||||||||
|
Preferred Member Units (3,725,862 units) |
3,726 | 939 | |||||||||||||
| | | | | | | | | | | | | | | | | |
|
8,392 | 5,460 | ||||||||||||||
|
||||||||||||||||
Bond-Coat, Inc. |
December 28, 2012 | Casing and Tubing Coating Services |
||||||||||||||
|
15.00% Secured Debt (Maturity — December 28, 2020) |
11,596 | 11,473 | 11,473 | ||||||||||||
|
Common Stock (57,508 shares) |
6,350 | 8,300 | |||||||||||||
| | | | | | | | | | | | | | | | | |
|
17,823 | 19,773 | ||||||||||||||
|
||||||||||||||||
Brewer Crane Holdings, LLC |
January 9, 2018 | Provider of Crane Rental and Operating Services |
||||||||||||||
|
LIBOR Plus 10.00% (Floor 1.00%), Current Coupon 11.71%, Secured Debt (Maturity — January 9, 2023)(9) |
9,052 | 8,989 | 8,989 | ||||||||||||
|
Preferred Member Units (2,950 units)(8) |
4,280 | 4,280 | |||||||||||||
| | | | | | | | | | | | | | | | | |
|
13,269 | 13,269 | ||||||||||||||
|
||||||||||||||||
85
MAIN STREET CAPITAL CORPORATION
Consolidated Schedule of Investments — (Continued)
December 31, 2019
(dollars in thousands)
| Portfolio Company(1)(20) |
Investment Date(26) |
Business Description |
Type of Investment(2)(3)(25) |
Principal(4) |
Cost(4) |
Fair Value(18) |
||||||||||
|---|---|---|---|---|---|---|---|---|---|---|---|---|---|---|---|---|
Bridge Capital Solutions Corporation |
April 18, 2012 | Financial Services and Cash Flow Solutions Provider |
||||||||||||||
|
13.00% Secured Debt (Maturity — December 11, 2024) |
8,813 | 7,797 | 7,797 | ||||||||||||
|
Warrants (82 equivalent shares; Expiration — July 25, 2026; Strike price — $0.01 per share) |
2,132 | 3,500 | |||||||||||||
|
13.00% Secured Debt (Mercury Service Group, LLC) (Maturity — December 11, 2024) |
1,000 | 996 | 996 | ||||||||||||
|
Preferred Member Units (Mercury Service Group, LLC) (17,742 units)(8) |
1,000 | 1,000 | |||||||||||||
| | | | | | | | | | | | | | | | | |
|
11,925 | 13,293 | ||||||||||||||
|
||||||||||||||||
Café Brazil, LLC |
April 20, 2004 | Casual Restaurant Group |
||||||||||||||
|
Member Units (1,233 units)(8) |
1,742 | 2,440 | |||||||||||||
|
||||||||||||||||
California Splendor Holdings LLC |
March 30, 2018 | Processor of Frozen Fruits |
||||||||||||||
|
LIBOR Plus 8.00% (Floor 1.00%), Current Coupon 10.13%, Secured Debt (Maturity — March 30, 2023)(9) |
7,229 | 7,104 | 7,104 | ||||||||||||
|
LIBOR Plus 10.00% (Floor 1.00%), Current Coupon 12.13%, Secured Debt (Maturity — March 30, 2023)(9) |
28,000 | 27,801 | 27,801 | ||||||||||||
|
Preferred Member Units (6,725 units)(8) |
7,163 | 7,163 | |||||||||||||
|
Preferred Member Units (6,157 units)(8) |
10,775 | 7,382 | |||||||||||||
| | | | | | | | | | | | | | | | | |
|
52,843 | 49,450 | ||||||||||||||
|
||||||||||||||||
CBT Nuggets, LLC ("CBT") |
June 1, 2006 | Produces and Sells IT Training Certification Videos |
||||||||||||||
|
Member Units (416 units)(8) |
1,300 | 50,850 | |||||||||||||
|
||||||||||||||||
Centre Technologies Holdings, LLC |
January 4, 2019 | Provider of IT Hardware Services and Software Solutions |
||||||||||||||
|
LIBOR Plus 9.00% (Floor 2.00%), Current Coupon 10.75%, Secured Debt (Maturity — January 4, 2024)(9) |
12,240 | 12,136 | 12,136 | ||||||||||||
|
Preferred Member Units (12,696 units) |
5,840 | 5,840 | |||||||||||||
| | | | | | | | | | | | | | | | | |
|
17,976 | 17,976 | ||||||||||||||
|
||||||||||||||||
Chamberlin Holding LLC |
February 26, 2018 | Roofing and Waterproofing Specialty Contractor |
||||||||||||||
|
LIBOR Plus 10.00% (Floor 1.00%), Current Coupon 12.00%, Secured Debt (Maturity — February 26, 2023)(9) |
17,773 | 17,649 | 17,773 | ||||||||||||
|
Member Units (4,347 units)(8) |
11,440 | 24,040 | |||||||||||||
|
Member Units (Chamberlin Langfield Real Estate, LLC) (1,047,146 units)(8) |
1,047 | 1,450 | |||||||||||||
| | | | | | | | | | | | | | | | | |
|
30,136 | 43,263 | ||||||||||||||
|
||||||||||||||||
86
MAIN STREET CAPITAL CORPORATION
Consolidated Schedule of Investments — (Continued)
December 31, 2019
(dollars in thousands)
| Portfolio Company(1)(20) |
Investment Date(26) |
Business Description |
Type of Investment(2)(3)(25) |
Principal(4) |
Cost(4) |
Fair Value(18) |
||||||||||
|---|---|---|---|---|---|---|---|---|---|---|---|---|---|---|---|---|
Charps, LLC |
February 3, 2017 | Pipeline Maintenance and Construction |
||||||||||||||
|
15.00% Secured Debt (Maturity — June 5, 2022) |
2,000 | 2,000 | 2,000 | ||||||||||||
|
Preferred Member Units (1,600 units)(8) |
400 | 6,920 | |||||||||||||
| | | | | | | | | | | | | | | | | |
|
2,400 | 8,920 | ||||||||||||||
|
||||||||||||||||
Clad-Rex Steel, LLC |
December 20, 2016 | Specialty Manufacturer of Vinyl-Clad Metal |
||||||||||||||
|
LIBOR Plus 9.00% (Floor 1.00%), Current Coupon 10.71%, Secured Debt (Maturity — December 20, 2021)(9) |
10,880 | 10,830 | 10,781 | ||||||||||||
|
Member Units (717 units)(8) |
7,280 | 9,630 | |||||||||||||
|
10.00% Secured Debt (Clad-Rex Steel RE Investor, LLC) (Maturity — December 20, 2036) |
1,137 | 1,126 | 1,137 | ||||||||||||
|
Member Units (Clad-Rex Steel RE Investor, LLC) (800 units) |
210 | 460 | |||||||||||||
| | | | | | | | | | | | | | | | | |
|
19,446 | 22,008 | ||||||||||||||
|
||||||||||||||||
CMS Minerals Investments |
January 30, 2015 | Oil & Gas Exploration & Production |
||||||||||||||
|
Member Units (CMS Minerals II, LLC) (100 units)(8) |
2,386 | 1,900 | |||||||||||||
|
||||||||||||||||
CompareNetworks Topco, LLC |
January 29, 2019 | Internet Publishing and Web Search Portals |
||||||||||||||
|
LIBOR Plus 11.00% (Floor 1.00%), Current Coupon 12.75%, Secured Debt (Maturity — January 29, 2024)(9) |
8,364 | 8,288 | 8,288 | ||||||||||||
|
Preferred Member Units (1,975 units) |
1,975 | 3,010 | |||||||||||||
| | | | | | | | | | | | | | | | | |
|
10,263 | 11,298 | ||||||||||||||
|
||||||||||||||||
Copper Trail Fund Investments(12)(13) |
July 17, 2017 | Investment Partnership |
||||||||||||||
|
LP Interests (CTMH, LP) (Fully diluted 38.8%) |
872 | 872 | |||||||||||||
|
||||||||||||||||
Datacom, LLC |
May 30, 2014 | Technology and Telecommunications Provider |
||||||||||||||
|
8.00% Secured Debt (Maturity — May 31, 2021)(14) |
1,800 | 1,800 | 1,615 | ||||||||||||
|
10.50% PIK Secured Debt (Maturity — May 31, 2021)(14)(19) |
12,507 | 12,475 | 10,142 | ||||||||||||
|
Class A Preferred Member Units |
1,294 | — | |||||||||||||
|
Class B Preferred Member Units (6,453 units) |
6,030 | — | |||||||||||||
| | | | | | | | | | | | | | | | | |
|
21,599 | 11,757 | ||||||||||||||
|
||||||||||||||||
Digital Products Holdings LLC |
April 1, 2018 | Designer and Distributor of Consumer Electronics |
||||||||||||||
|
LIBOR Plus 10.00% (Floor 1.00%), Current Coupon 11.75%, Secured Debt (Maturity — April 1, 2023)(9) |
19,620 | 19,478 | 18,452 | ||||||||||||
|
Preferred Member Units (3,857 shares)(8) |
9,501 | 5,174 | |||||||||||||
| | | | | | | | | | | | | | | | | |
|
28,979 | 23,626 | ||||||||||||||
|
||||||||||||||||
87
MAIN STREET CAPITAL CORPORATION
Consolidated Schedule of Investments — (Continued)
December 31, 2019
(dollars in thousands)
| Portfolio Company(1)(20) |
Investment Date(26) |
Business Description |
Type of Investment(2)(3)(25) |
Principal(4) |
Cost(4) |
Fair Value(18) |
||||||||||
|---|---|---|---|---|---|---|---|---|---|---|---|---|---|---|---|---|
Direct Marketing Solutions, Inc. |
February 13, 2018 | Provider of Omni-Channel Direct Marketing Services |
||||||||||||||
|
LIBOR Plus 11.00% (Floor 1.00%), Current Coupon 12.75%, Secured Debt (Maturity — February 13, 2023)(9) |
15,717 | 15,597 | 15,707 | ||||||||||||
|
Preferred Stock (8,400 shares) |
8,400 | 20,200 | |||||||||||||
| | | | | | | | | | | | | | | | | |
|
23,997 | 35,907 | ||||||||||||||
|
||||||||||||||||
Gamber-Johnson Holdings, LLC ("GJH") |
June 24, 2016 | Manufacturer of Ruggedized Computer Mounting Systems |
||||||||||||||
|
LIBOR Plus 6.50% (Floor 2.00%), Current Coupon 8.50%, Secured Debt (Maturity — June 24, 2021)(9) |
19,022 | 18,949 | 19,022 | ||||||||||||
|
Member Units (8,619 units)(8) |
14,844 | 53,410 | |||||||||||||
| | | | | | | | | | | | | | | | | |
|
33,793 | 72,432 | ||||||||||||||
|
||||||||||||||||
Garreco, LLC |
July 15, 2013 | Manufacturer and Supplier of Dental Products |
||||||||||||||
|
LIBOR Plus 8.00% (Floor 1.00%, Ceiling 1.50%), Current Coupon 9.50%, Secured Debt (Maturity — March 31, 2020)(9) |
4,519 | 4,515 | 4,515 | ||||||||||||
|
Member Units (1,200 units) |
1,200 | 2,560 | |||||||||||||
| | | | | | | | | | | | | | | | | |
|
5,715 | 7,075 | ||||||||||||||
|
||||||||||||||||
GRT Rubber Technologies LLC ("GRT") |
December 19, 2014 | Manufacturer of Engineered Rubber Products |
||||||||||||||
|
LIBOR Plus 7.00%, Current Coupon 8.71%, Secured Debt (Maturity — December 31, 2023) |
15,016 | 15,016 | 15,016 | ||||||||||||
|
Member Units (5,879 units) |
13,065 | 47,450 | |||||||||||||
| | | | | | | | | | | | | | | | | |
|
28,081 | 62,466 | ||||||||||||||
|
||||||||||||||||
Guerdon Modular Holdings, Inc. |
August 13, 2014 | Multi-Family and Commercial Modular Construction Company |
||||||||||||||
|
LIBOR Plus 8.50% (Floor 1.00%), Current Coupon 10.60%, Secured Debt (Maturity — October 1, 2019)(9)(14)(17) |
1,010 | 1,010 | — | ||||||||||||
|
16.00% Secured Debt (Maturity — October 1, 2019)(14)(17) |
12,588 | 12,588 | — | ||||||||||||
|
Preferred Stock (404,998 shares) |
1,140 | — | |||||||||||||
|
Common Stock (212,033 shares) |
2,983 | — | |||||||||||||
|
Warrants (6,208,877 equivalent shares; Expiration — April 25, 2028; Strike price — $0.01 per share) |
— | — | |||||||||||||
| | | | | | | | | | | | | | | | | |
|
17,721 | — | ||||||||||||||
|
||||||||||||||||
Gulf Manufacturing, LLC |
August 31, 2007 | Manufacturer of Specialty Fabricated Industrial Piping Products |
||||||||||||||
|
Member Units (438 units)(8) |
2,980 | 7,430 | |||||||||||||
|
||||||||||||||||
88
MAIN STREET CAPITAL CORPORATION
Consolidated Schedule of Investments — (Continued)
December 31, 2019
(dollars in thousands)
| Portfolio Company(1)(20) |
Investment Date(26) |
Business Description |
Type of Investment(2)(3)(25) |
Principal(4) |
Cost(4) |
Fair Value(18) |
||||||||||
|---|---|---|---|---|---|---|---|---|---|---|---|---|---|---|---|---|
Gulf Publishing Holdings, LLC |
April 29, 2016 | Energy Industry Focused Media and Publishing |
||||||||||||||
|
LIBOR Plus 9.50% (Floor 1.00%), Current Coupon 11.21%, Secured Debt (Maturity — September 30, 2020)(9) |
280 | 280 | 280 | ||||||||||||
|
12.50% Secured Debt (Maturity — April 29, 2021) |
12,535 | 12,493 | 12,493 | ||||||||||||
|
Member Units (3,681 units) |
3,681 | 2,420 | |||||||||||||
| | | | | | | | | | | | | | | | | |
|
16,454 | 15,193 | ||||||||||||||
|
||||||||||||||||
Harborside Holdings, LLC |
March 20, 2017 | Real Estate Holding Company |
||||||||||||||
|
Member units (100 units) |
6,506 | 9,560 | |||||||||||||
|
||||||||||||||||
Harris Preston Fund Investments(12)(13) |
October 1, 2017 | Investment Partnership |
||||||||||||||
|
LP Interests (2717 MH, L.P.) (Fully diluted 49.3%) |
2,735 | 3,157 | |||||||||||||
|
||||||||||||||||
Harrison Hydra-Gen, Ltd. |
June 4, 2010 | Manufacturer of Hydraulic Generators |
||||||||||||||
|
Common Stock (107,456 shares)(8) |
718 | 7,970 | |||||||||||||
|
||||||||||||||||
IDX Broker, LLC |
November 15, 2013 | Provider of Marketing and CRM Tools for the Real Estate Industry |
||||||||||||||
|
11.50% Secured Debt (Maturity — November 15, 2020) |
13,400 | 13,358 | 13,400 | ||||||||||||
|
Preferred Member Units (5,607 units)(8) |
5,952 | 15,040 | |||||||||||||
| | | | | | | | | | | | | | | | | |
|
19,310 | 28,440 | ||||||||||||||
|
||||||||||||||||
Jensen Jewelers of Idaho, LLC |
November 14, 2006 | Retail Jewelry Store |
||||||||||||||
|
Prime Plus 6.75% (Floor 2.00%), Current Coupon 11.50%, Secured Debt (Maturity — November 14, 2023)(9) |
4,000 | 3,960 | 4,000 | ||||||||||||
|
Member Units (627 units)(8) |
811 | 8,270 | |||||||||||||
| | | | | | | | | | | | | | | | | |
|
4,771 | 12,270 | ||||||||||||||
|
||||||||||||||||
J&J Services, Inc. |
October 31, 2019 | Provider of Dumpster and Portable Toilet Rental Services |
||||||||||||||
|
11.50% Secured Debt (Maturity — October 31, 2024) |
17,600 | 17,430 | 17,430 | ||||||||||||
|
Preferred Stock (2,814 shares) |
7,160 | 7,160 | |||||||||||||
| | | | | | | | | | | | | | | | | |
|
24,590 | 24,590 | ||||||||||||||
|
||||||||||||||||
KBK Industries, LLC |
January 23, 2006 | Manufacturer of Specialty Oilfield and Industrial Products |
||||||||||||||
|
Member Units (325 units)(8) |
783 | 15,470 | |||||||||||||
|
||||||||||||||||
Kickhaefer Manufacturing Company, LLC |
October 31, 2018 | Precision Metal Parts Manufacturing |
||||||||||||||
|
11.50% Secured Debt (Maturity — October 31, 2023) |
25,200 | 24,982 | 24,982 | ||||||||||||
|
Member Units (581 units) |
12,240 | 12,240 | |||||||||||||
|
9.00% Secured Debt (Maturity — October 31, 2048) |
3,978 | 3,939 | 3,939 | ||||||||||||
|
Member Units (KMC RE Investor, LLC) (800 units)(8) |
992 | 1,160 | |||||||||||||
| | | | | | | | | | | | | | | | | |
|
42,153 | 42,321 | ||||||||||||||
|
||||||||||||||||
89
MAIN STREET CAPITAL CORPORATION
Consolidated Schedule of Investments — (Continued)
December 31, 2019
(dollars in thousands)
| Portfolio Company(1)(20) |
Investment Date(26) |
Business Description |
Type of Investment(2)(3)(25) |
Principal(4) |
Cost(4) |
Fair Value(18) |
||||||||||
|---|---|---|---|---|---|---|---|---|---|---|---|---|---|---|---|---|
Market Force Information, LLC |
July 28, 2017 | Provider of Customer Experience Management Services |
||||||||||||||
|
8.00% Secured Debt (Maturity — July 28, 2022) |
2,786 | 2,786 | 2,695 | ||||||||||||
|
6.00% Current / 6.00% PIK Secured Debt (Maturity — July 28, 2022)(19) |
23,292 | 23,157 | 22,621 | ||||||||||||
|
Member Units (743,921 units) |
16,642 | 5,280 | |||||||||||||
| | | | | | | | | | | | | | | | | |
|
42,585 | 30,596 | ||||||||||||||
|
||||||||||||||||
MH Corbin Holding LLC |
August 31, 2015 | Manufacturer and Distributor of Traffic Safety Products |
||||||||||||||
|
5.00% Current / 5.00% PIK Secured Debt (Maturity — March 31, 2022)(19) |
8,890 | 8,815 | 8,890 | ||||||||||||
|
Preferred Member Units (66,000 shares) |
4,400 | 4,770 | |||||||||||||
|
Preferred Member Units (4,000 shares) |
6,000 | 20 | |||||||||||||
| | | | | | | | | | | | | | | | | |
|
19,215 | 13,680 | ||||||||||||||
|
||||||||||||||||
Mid-Columbia Lumber Products, LLC |
December 18, 2006 | Manufacturer of Finger-Jointed Lumber Products |
||||||||||||||
|
10.00% Secured Debt (Maturity — January 15, 2020) |
1,750 | 1,750 | 1,602 | ||||||||||||
|
12.00% Secured Debt (Maturity — January 15, 2020) |
3,900 | 3,898 | 3,644 | ||||||||||||
|
Member Units (7,874 units) |
3,239 | — | |||||||||||||
|
9.50% Secured Debt (Mid-Columbia Real Estate, LLC) (Maturity — May 13, 2025) |
701 | 701 | 701 | ||||||||||||
|
Member Units (Mid-Columbia Real Estate, LLC) (500 units)(8) |
790 | 1,640 | |||||||||||||
| | | | | | | | | | | | | | | | | |
|
10,378 | 7,587 | ||||||||||||||
|
||||||||||||||||
MSC Adviser I, LLC(16) |
November 22, 2013 | Third Party Investment Advisory Services |
||||||||||||||
|
Member Units (Fully diluted 100.0%)(8) |
— | 74,520 | |||||||||||||
|
||||||||||||||||
Mystic Logistics Holdings, LLC |
August 18, 2014 | Logistics and Distribution Services Provider for Large Volume Mailers |
||||||||||||||
|
12.00% Secured Debt (Maturity — August 15. 2019)(17) |
6,253 | 6,253 | 6,253 | ||||||||||||
|
Common Stock (5,873 shares)(8) |
2,720 | 8,410 | |||||||||||||
| | | | | | | | | | | | | | | | | |
|
8,973 | 14,663 | ||||||||||||||
|
||||||||||||||||
NAPCO Precast, LLC |
January 31, 2008 | Precast Concrete Manufacturing |
||||||||||||||
|
Member Units (2,955 units)(8) |
2,975 | 14,760 | |||||||||||||
|
||||||||||||||||
NexRev LLC |
February 28, 2018 | Provider of Energy Efficiency Products & Services |
||||||||||||||
|
11.00% Secured Debt (Maturity — February 28, 2023) |
17,586 | 17,469 | 17,469 | ||||||||||||
|
Preferred Member Units (86,400,000 units)(8) |
6,880 | 6,310 | |||||||||||||
| | | | | | | | | | | | | | | | | |
|
24,349 | 23,779 | ||||||||||||||
|
||||||||||||||||
90
MAIN STREET CAPITAL CORPORATION
Consolidated Schedule of Investments — (Continued)
December 31, 2019
(dollars in thousands)
| Portfolio Company(1)(20) |
Investment Date(26) |
Business Description |
Type of Investment(2)(3)(25) |
Principal(4) |
Cost(4) |
Fair Value(18) |
||||||||||
|---|---|---|---|---|---|---|---|---|---|---|---|---|---|---|---|---|
NRI Clinical Research, LLC |
September 8, 2011 | Clinical Research Service Provider |
||||||||||||||
|
14.00% Secured Debt (Maturity — June 8, 2022) |
5,981 | 5,885 | 5,981 | ||||||||||||
|
Warrants (251,723 equivalent units; Expiration — June 8, 2027; Strike price — $0.01 per unit) |
252 | 1,230 | |||||||||||||
|
Member Units (1,454,167 units)(8) |
765 | 4,988 | |||||||||||||
| | | | | | | | | | | | | | | | | |
|
6,902 | 12,199 | ||||||||||||||
|
||||||||||||||||
NRP Jones, LLC |
December 22, 2011 | Manufacturer of Hoses, Fittings and Assemblies |
||||||||||||||
|
12.00% Secured Debt (Maturity — March 20, 2023) |
6,376 | 6,376 | 6,376 | ||||||||||||
|
Member Units (65,962 units)(8) |
3,717 | 4,710 | |||||||||||||
| | | | | | | | | | | | | | | | | |
|
10,093 | 11,086 | ||||||||||||||
|
||||||||||||||||
NuStep, LLC |
January 31, 2017 | Designer, Manufacturer and Distributor of Fitness Equipment |
||||||||||||||
|
12.00% Secured Debt (Maturity — January 31, 2022) |
19,800 | 19,703 | 19,703 | ||||||||||||
|
Preferred Member Units (406 units) |
10,200 | 10,200 | |||||||||||||
| | | | | | | | | | | | | | | | | |
|
29,903 | 29,903 | ||||||||||||||
|
||||||||||||||||
OMi Holdings, Inc. |
April 1, 2008 | Manufacturer of Overhead Cranes |
||||||||||||||
|
Common Stock (1,500 shares)(8) |
1,080 | 16,950 | |||||||||||||
|
||||||||||||||||
Pegasus Research Group, LLC |
January 6, 2011 | Provider of Telemarketing and Data Services |
||||||||||||||
|
Member Units (460 units) |
1,290 | 8,170 | |||||||||||||
|
||||||||||||||||
PPL RVs, Inc. |
June 10, 2010 | Recreational Vehicle Dealer |
||||||||||||||
|
LIBOR Plus 8.75% (Floor 0.50%), Current Coupon 10.85%, Secured Debt (Maturity — November 15, 2022)(9) |
12,245 | 12,118 | 12,118 | ||||||||||||
|
Common Stock (1,962 shares) |
2,150 | 9,930 | |||||||||||||
| | | | | | | | | | | | | | | | | |
|
14,268 | 22,048 | ||||||||||||||
|
||||||||||||||||
Principle Environmental, LLC (d/b/a TruHorizon Environmental Solutions) |
February 1, 2011 | Noise Abatement Service Provider |
||||||||||||||
|
13.00% Secured Debt (Maturity — April 30, 2020) |
6,397 | 6,379 | 6,397 | ||||||||||||
|
Preferred Member Units (19,631 units)(8) |
4,600 | 13,390 | |||||||||||||
|
Warrants (1,018 equivalent units; Expiration — January 31, 2021; Strike price — $0.01 per unit) |
1,200 | 1,090 | |||||||||||||
| | | | | | | | | | | | | | | | | |
|
12,179 | 20,877 | ||||||||||||||
|
||||||||||||||||
Quality Lease Service, LLC |
June 8, 2015 | Provider of Rigsite Accommodation Unit Rentals and Related Services |
||||||||||||||
|
Member Units (1,000 units) |
11,013 | 9,289 | |||||||||||||
|
||||||||||||||||
91
MAIN STREET CAPITAL CORPORATION
Consolidated Schedule of Investments — (Continued)
December 31, 2019
(dollars in thousands)
| Portfolio Company(1)(20) |
Investment Date(26) |
Business Description |
Type of Investment(2)(3)(25) |
Principal(4) |
Cost(4) |
Fair Value(18) |
||||||||||
|---|---|---|---|---|---|---|---|---|---|---|---|---|---|---|---|---|
River Aggregates, LLC |
March 30, 2011 | Processor of Construction Aggregates |
||||||||||||||
|
Zero Coupon Secured Debt (Maturity — June 30, 2018)(17) |
750 | 750 | 722 | ||||||||||||
|
Member Units (1,150 units) |
1,150 | 4,990 | |||||||||||||
|
Member Units (RA Properties, LLC) (1,500 units) |
369 | 3,169 | |||||||||||||
| | | | | | | | | | | | | | | | | |
|
2,269 | 8,881 | ||||||||||||||
|
||||||||||||||||
Tedder Industries, LLC |
August 31, 2018 | Manufacturer of Firearm Holsters and Accessories |
||||||||||||||
|
12.00% Secured Debt (Maturity — August 31, 2020) |
640 | 640 | 640 | ||||||||||||
|
12.00% Secured Debt (Maturity — August 31, 2023) |
16,400 | 16,272 | 16,272 | ||||||||||||
|
Preferred Member Units (479 units) |
8,136 | 8,136 | |||||||||||||
| | | | | | | | | | | | | | | | | |
|
25,048 | 25,048 | ||||||||||||||
|
||||||||||||||||
The MPI Group, LLC |
October 2, 2007 | Manufacturer of Custom Hollow Metal Doors, Frames and Accessories |
||||||||||||||
|
9.00% Secured Debt (Maturity — December 31, 2019)(17) |
2,924 | 2,924 | 2,924 | ||||||||||||
|
Series A Preferred Units (2,500 units) |
2,500 | — | |||||||||||||
|
Warrants (1,424 equivalent units; Expiration — July 1, 2024; Strike price — $0.01 per unit) |
1,096 | — | |||||||||||||
|
Member Units (MPI Real Estate Holdings, LLC) (100 units)(8) |
2,300 | 1,640 | |||||||||||||
| | | | | | | | | | | | | | | | | |
|
8,820 | 4,564 | ||||||||||||||
|
||||||||||||||||
Trantech Radiator Topco, LLC |
May 31, 2019 | Transformer Cooling Products and Services |
||||||||||||||
|
12.00% Secured Debt (Maturity — May 31, 2024) |
9,200 | 9,102 | 9,102 | ||||||||||||
|
Common Stock (615 shares)(8) |
4,655 | 4,655 | |||||||||||||
| | | | | | | | | | | | | | | | | |
|
13,757 | 13,757 | ||||||||||||||
|
||||||||||||||||
Vision Interests, Inc. |
June 5, 2007 | Manufacturer / Installer of Commercial Signage |
||||||||||||||
|
13.00% Secured Debt (Maturity — September 30, 2019)(17) |
2,028 | 2,028 | 2,028 | ||||||||||||
|
Series A Preferred Stock (3,000,000 shares) |
3,000 | 4,089 | |||||||||||||
|
Common Stock (1,126,242 shares) |
3,706 | 409 | |||||||||||||
| | | | | | | | | | | | | | | | | |
|
8,734 | 6,526 | ||||||||||||||
|
||||||||||||||||
Ziegler's NYPD, LLC |
October 1, 2008 | Casual Restaurant Group |
||||||||||||||
|
6.50% Secured Debt (Maturity — October 1, 2020) |
1,000 | 1,000 | 1,000 | ||||||||||||
|
12.00% Secured Debt (Maturity — October 1, 2020) |
625 | 625 | 625 | ||||||||||||
|
14.00% Secured Debt (Maturity — October 1, 2020) |
2,750 | 2,750 | 2,750 | ||||||||||||
|
Warrants (587 equivalent units; Expiration — October 1, 2020; Strike price — $0.01 per unit) |
600 | — | |||||||||||||
|
Preferred Member Units (10,072 units) |
2,834 | 1,269 | |||||||||||||
| | | | | | | | | | | | | | | | | |
|
7,809 | 5,644 | ||||||||||||||
| | | | | | | | | | | | | | | | | |
Subtotal Control Investments (67.2% of net assets at fair value) |
$ | 778,367 | $ | 1,032,721 | ||||||||||||
| | | | | | | | | | | | | | | | | |
92
MAIN STREET CAPITAL CORPORATION
Consolidated Schedule of Investments — (Continued)
December 31, 2019
(dollars in thousands)
| Portfolio Company(1)(20) |
Investment Date(26) |
Business Description |
Type of Investment(2)(3)(25) |
Principal(4) |
Cost(4) |
Fair Value(18) |
||||||||||
|---|---|---|---|---|---|---|---|---|---|---|---|---|---|---|---|---|
Affiliate Investments (6) |
|
|
||||||||||||||
|
||||||||||||||||
AFG Capital Group, LLC |
November 7, 2014 | Provider of Rent-to-Own Financing Solutions and Services |
||||||||||||||
|
10.00% Secured Debt (Maturity — May 25, 2022) |
$ | 838 | $ | 838 | $ | 838 | |||||||||
|
Preferred Member Units (186 units) |
1,200 | 5,180 | |||||||||||||
| | | | | | | | | | | | | | | | | |
|
2,038 | 6,018 | ||||||||||||||
|
||||||||||||||||
American Trailer Rental Group LLC |
June 7, 2017 | Provider of Short-term Trailer and Container Rental |
||||||||||||||
|
LIBOR Plus 7.25% (Floor 1.00%), Current Coupon 9.34%, Secured Debt (Maturity — June 7, 2022)(9) |
27,087 | 26,905 | 27,087 | ||||||||||||
|
Member Units (Milton Meisler Holdings LLC) (48,555 units) |
4,855 | 8,540 | |||||||||||||
| | | | | | | | | | | | | | | | | |
|
31,760 | 35,627 | ||||||||||||||
|
||||||||||||||||
BBB Tank Services, LLC |
April 8, 2016 | Maintenance, Repair and Construction Services to the Above-Ground Storage Tank Market |
||||||||||||||
|
LIBOR Plus 11.00% (Floor 1.00%), Current Coupon 12.71%, (Maturity — April 8, 2021)(9) |
4,800 | 4,698 | 4,698 | ||||||||||||
|
Preferred Stock (non-voting)(8) |
131 | 131 | |||||||||||||
|
Member Units (800,000 units) |
800 | 290 | |||||||||||||
| | | | | | | | | | | | | | | | | |
|
5,629 | 5,119 | ||||||||||||||
|
||||||||||||||||
Boccella Precast Products LLC |
June 30, 2017 | Manufacturer of Precast Hollow Core Concrete |
||||||||||||||
|
LIBOR Plus 12.00% (Floor 1.00%), Current Coupon 14.10%, Secured Debt (Maturity — June 30, 2022)(9) |
13,244 | 13,106 | 13,244 | ||||||||||||
|
Member Units (2,160,000 units)(8) |
2,256 | 6,270 | |||||||||||||
| | | | | | | | | | | | | | | | | |
|
15,362 | 19,514 | ||||||||||||||
|
||||||||||||||||
Buca C, LLC |
June 30, 2015 | Casual Restaurant Group |
||||||||||||||
|
LIBOR Plus 9.25% (Floor 1.00%), Current Coupon 10.94%, Secured Debt (Maturity — June 30, 2020)(9) |
19,004 | 18,981 | 18,794 | ||||||||||||
|
Preferred Member Units (6 units; 6% cumulative)(8)(19) |
4,701 | 4,701 | |||||||||||||
| | | | | | | | | | | | | | | | | |
|
23,682 | 23,495 | ||||||||||||||
|
||||||||||||||||
CAI Software LLC |
October 10, 2014 | Provider of Specialized Enterprise Resource Planning Software |
||||||||||||||
|
11.00% Secured Debt (Maturity — December 7, 2023) |
9,160 | 9,077 | 9,160 | ||||||||||||
|
Member Units (66,968 units)(8) |
751 | 5,210 | |||||||||||||
| | | | | | | | | | | | | | | | | |
|
9,828 | 14,370 | ||||||||||||||
|
||||||||||||||||
Chandler Signs Holdings, LLC(10) |
January 4, 2016 | Sign Manufacturer |
||||||||||||||
|
Class A Units (1,500,000 units)(8) |
1,500 | 2,740 | |||||||||||||
|
||||||||||||||||
Charlotte Russe, Inc(11) |
May 28, 2013 | Fast-Fashion Retailer to Young Women |
||||||||||||||
|
Common Stock (19,041 shares) |
3,141 | — | |||||||||||||
|
||||||||||||||||
93
MAIN STREET CAPITAL CORPORATION
Consolidated Schedule of Investments — (Continued)
December 31, 2019
(dollars in thousands)
| Portfolio Company(1)(20) |
Investment Date(26) |
Business Description |
Type of Investment(2)(3)(25) |
Principal(4) |
Cost(4) |
Fair Value(18) |
||||||||||
|---|---|---|---|---|---|---|---|---|---|---|---|---|---|---|---|---|
Congruent Credit Opportunities Funds(12)(13) |
January 24, 2012 | Investment Partnership |
||||||||||||||
|
LP Interests (Congruent Credit Opportunities Fund II, LP) (Fully diluted 19.8%) |
5,210 | 855 | |||||||||||||
|
LP Interests (Congruent Credit Opportunities Fund III, LP) (Fully diluted 17.4%)(8) |
13,601 | 13,915 | |||||||||||||
| | | | | | | | | | | | | | | | | |
|
18,811 | 14,770 | ||||||||||||||
|
||||||||||||||||
Copper Trail Fund Investments(12)(13) |
July 17, 2017 | Investment Partnership |
||||||||||||||
|
LP Interests (Copper Trail Energy Fund I, LP) (Fully diluted 12.4%)(8) |
1,997 | 2,362 | |||||||||||||
|
||||||||||||||||
Dos Rios Partners(12)(13) |
April 25, 2013 | Investment Partnership |
||||||||||||||
|
LP Interests (Dos Rios Partners, LP) (Fully diluted 20.2%) |
5,846 | 7,033 | |||||||||||||
|
LP Interests (Dos Rios Partners — A, LP) (Fully diluted 6.4%) |
1,856 | 2,233 | |||||||||||||
| | | | | | | | | | | | | | | | | |
|
7,702 | 9,266 | ||||||||||||||
|
||||||||||||||||
East Teak Fine Hardwoods, Inc. |
April 13, 2006 | Distributor of Hardwood Products |
||||||||||||||
|
Common Stock (6,250 shares)(8) |
480 | 400 | |||||||||||||
|
||||||||||||||||
EIG Fund Investments(12)(13) |
November 6, 2015 | Investment Partnership |
||||||||||||||
|
LP Interests (EIG Global Private Debt Fund-A, L.P.) (Fully diluted 11.1%)(8) |
768 | 720 | |||||||||||||
|
||||||||||||||||
Freeport Financial Funds(12)(13) |
June 13, 2013 | Investment Partnership |
||||||||||||||
|
LP Interests (Freeport Financial SBIC Fund LP) (Fully diluted 9.3%) |
5,974 | 5,778 | |||||||||||||
|
LP Interests (Freeport First Lien Loan Fund III LP) (Fully diluted 6.0%)(8) |
9,956 | 9,696 | |||||||||||||
| | | | | | | | | | | | | | | | | |
|
15,930 | 15,474 | ||||||||||||||
|
||||||||||||||||
Fuse, LLC(11) |
June 30, 2019 | Cable Networks Operator |
||||||||||||||
|
12% Secured Debt (Maturity — June 28, 2024) |
1,939 | 1,939 | 1,939 | ||||||||||||
|
Common Stock (10,429 shares) |
256 | 256 | |||||||||||||
| | | | | | | | | | | | | | | | | |
|
2,195 | 2,195 | ||||||||||||||
|
||||||||||||||||
Harris Preston Fund Investments(12)(13) |
August 9, 2017 | Investment Partnership |
||||||||||||||
|
LP Interests (HPEP 3, L.P.) (Fully diluted 8.2%) |
2,474 | 2,474 | |||||||||||||
|
||||||||||||||||
Hawk Ridge Systems, LLC(13) |
December 2, 2016 | Value-Added Reseller of Engineering Design and Manufacturing Solutions |
||||||||||||||
|
LIBOR Plus 6.00% (Floor 1.00%), Current Coupon 7.71%, Secured Debt (Maturity — December 2, 2021)(9) |
600 | 600 | 600 | ||||||||||||
|
11.00% Secured Debt (Maturity — December 2, 2021) |
13,400 | 13,335 | 13,400 | ||||||||||||
|
Preferred Member Units (226 units)(8) |
2,850 | 7,900 | |||||||||||||
|
Preferred Member Units (HRS Services, ULC) (226 units) |
150 | 420 | |||||||||||||
| | | | | | | | | | | | | | | | | |
|
16,935 | 22,320 | ||||||||||||||
|
||||||||||||||||
94
MAIN STREET CAPITAL CORPORATION
Consolidated Schedule of Investments — (Continued)
December 31, 2019
(dollars in thousands)
| Portfolio Company(1)(20) |
Investment Date(26) |
Business Description |
Type of Investment(2)(3)(25) |
Principal(4) |
Cost(4) |
Fair Value(18) |
||||||||||
|---|---|---|---|---|---|---|---|---|---|---|---|---|---|---|---|---|
Houston Plating and Coatings, LLC |
January 8, 2003 | Provider of Plating and Industrial Coating Services |
||||||||||||||
|
8.00% Unsecured Convertible Debt (Maturity — May 1, 2022) |
3,000 | 3,000 | 4,260 | ||||||||||||
|
Member Units (322,297 units)(8) |
2,352 | 10,330 | |||||||||||||
| | | | | | | | | | | | | | | | | |
|
5,352 | 14,590 | ||||||||||||||
|
||||||||||||||||
I-45 SLF LLC(12)(13) |
October 20, 2015 | Investment Partnership |
||||||||||||||
|
Member Units (Fully diluted 20.0%; 24.4% profits interest)(8) |
17,000 | 14,407 | |||||||||||||
|
||||||||||||||||
L.F. Manufacturing Holdings, LLC(10) |
December 23, 2013 | Manufacturer of Fiberglass Products |
||||||||||||||
|
Preferred Member Units (non-voting; 14% cumulative)(8)(19) |
81 | 81 | |||||||||||||
|
Member Units (2,179,001 units) |
2,019 | 2,050 | |||||||||||||
| | | | | | | | | | | | | | | | | |
|
2,100 | 2,131 | ||||||||||||||
|
||||||||||||||||
OnAsset Intelligence, Inc. |
April 18, 2011 | Provider of Transportation Monitoring / Tracking Products and Services |
||||||||||||||
|
12.00% PIK Secured Debt (Maturity — June 30, 2021)(19) |
6,474 | 6,474 | 6,474 | ||||||||||||
|
10.00% PIK Unsecured Debt (Maturity — June 30, 2021)(19) |
58 | 58 | 58 | ||||||||||||
|
Preferred Stock (912 shares) |
1,981 | — | |||||||||||||
|
Warrants (5,333 equivalent shares; Expiration — April 18, 2021; Strike price — $0.01 per share) |
1,919 | — | |||||||||||||
| | | | | | | | | | | | | | | | | |
|
10,432 | 6,532 | ||||||||||||||
|
||||||||||||||||
PCI Holding Company, Inc. |
December 18, 2012 | Manufacturer of Industrial Gas Generating Systems |
||||||||||||||
|
12.00% Current, Secured Debt (Maturity — March 31, 2020) |
11,356 | 11,356 | 11,356 | ||||||||||||
|
Preferred Stock (1,740,000 shares) (non-voting) |
1,740 | 4,350 | |||||||||||||
|
Preferred Stock (1,500,000 shares) |
3,927 | 2,680 | |||||||||||||
| | | | | | | | | | | | | | | | | |
|
17,023 | 18,386 | ||||||||||||||
|
||||||||||||||||
Rocaceia, LLC (Quality Lease and Rental Holdings, LLC) |
January 8, 2013 | Provider of Rigsite Accommodation Unit Rentals and Related Services |
||||||||||||||
|
12.00% Secured Debt (Maturity — January 8, 2018)(14)(15) |
30,369 | 29,865 | — | ||||||||||||
|
Preferred Member Units (250 units) |
2,500 | — | |||||||||||||
| | | | | | | | | | | | | | | | | |
|
32,365 | — | ||||||||||||||
|
||||||||||||||||
Salado Stone Holdings, LLC(10) |
June 27, 2016 | Limestone and Sandstone Dimension Cut Stone Mining Quarries |
||||||||||||||
|
Class A Preferred Units (Salado Acquisition, LLC) (2,000,000 units) |
2,000 | 570 | |||||||||||||
|
||||||||||||||||
95
MAIN STREET CAPITAL CORPORATION
Consolidated Schedule of Investments — (Continued)
December 31, 2019
(dollars in thousands)
| Portfolio Company(1)(20) |
Investment Date(26) |
Business Description |
Type of Investment(2)(3)(25) |
Principal(4) |
Cost(4) |
Fair Value(18) |
||||||||||
|---|---|---|---|---|---|---|---|---|---|---|---|---|---|---|---|---|
SI East, LLC |
August 31, 2018 | Rigid Industrial Packaging Manufacturing |
||||||||||||||
|
9.50% Current, Secured Debt (Maturity — August 31, 2023) |
32,963 | 32,687 | 32,963 | ||||||||||||
|
Preferred Member Units (157 units)(8) |
6,000 | 8,200 | |||||||||||||
| | | | | | | | | | | | | | | | | |
|
38,687 | 41,163 | ||||||||||||||
|
||||||||||||||||
Slick Innovations, Inc. |
September 13, 2018 | Text Message Marketing Platform |
||||||||||||||
|
14.00% Current, Secured Debt (Maturity — September 13, 2023) |
6,360 | 6,197 | 6,197 | ||||||||||||
|
Common Stock (70,000 shares)(8) |
700 | 1,080 | |||||||||||||
|
Warrants (18,084 equivalent units; Expiration - September 13, 2028; Strike price — $0.01 per unit) |
181 | 290 | |||||||||||||
| | | | | | | | | | | | | | | | | |
|
7,078 | 7,567 | ||||||||||||||
|
||||||||||||||||
UniTek Global Services, Inc.(11) |
April 15, 2011 | Provider of Outsourced Infrastructure Services |
||||||||||||||
|
LIBOR Plus 6.50% (Floor 1.00%), Current Coupon 8.41%, Secured Debt (Maturity — August 20, 2024)(9) |
2,963 | 2,940 | 2,962 | ||||||||||||
|
Preferred Stock (755,401 shares; 20% cumulative)(8)(19) |
809 | 1,889 | |||||||||||||
|
Preferred Stock (1,521,122 shares; 19% cumulative)(8)(19) |
1,976 | 2,282 | |||||||||||||
|
Preferred Stock (2,281,682 shares; 19% cumulative)(8)(19) |
3,667 | 3,667 | |||||||||||||
|
Preferred Stock (4,336,866 shares; 13.50% cumulative)(8)(19) |
7,924 | 2,684 | |||||||||||||
|
Common Stock (945,507 shares) |
— | — | |||||||||||||
| | | | | | | | | | | | | | | | | |
|
17,316 | 13,484 | ||||||||||||||
|
||||||||||||||||
Universal Wellhead Services Holdings, LLC(10) |
October 30, 2014 | Provider of Wellhead Equipment, Designs, and Personnel to the Oil & Gas Industry |
||||||||||||||
|
Preferred Member Units (UWS Investments, LLC) (716,949 units; 14% cumulative)(8)(19) |
1,032 | 800 | |||||||||||||
|
Member Units (UWS Investments, LLC) (4,000,000 units) |
4,000 | — | |||||||||||||
| | | | | | | | | | | | | | | | | |
|
5,032 | 800 | ||||||||||||||
|
||||||||||||||||
Volusion, LLC |
January 26, 2015 | Provider of Online Software-as-a-Service eCommerce Solutions |
||||||||||||||
|
11.50% Secured Debt (Maturity — January 26, 2020) |
20,234 | 20,162 | 19,352 | ||||||||||||
|
8.00% Unsecured Convertible Debt (Maturity — November 16, 2023) |
409 | 409 | 291 | ||||||||||||
|
Preferred Member Units (4,876,670 units) |
14,000 | 14,000 | |||||||||||||
|
Warrants (1,831,355 equivalent units; Expiration - January 26, 2025; Strike price — $0.01 per unit) |
2,576 | 150 | |||||||||||||
| | | | | | | | | | | | | | | | | |
|
37,147 | 33,793 | ||||||||||||||
| | | | | | | | | | | | | | | | | |
Subtotal Affiliate Investments (21.5% of net assets at fair value) |
$ | 351,764 | $ | 330,287 | ||||||||||||
| | | | | | | | | | | | | | | | | |
96
MAIN STREET CAPITAL CORPORATION
Consolidated Schedule of Investments — (Continued)
December 31, 2019
(dollars in thousands)
| Portfolio Company(1)(20) |
Investment Date(26) |
Business Description |
Type of Investment(2)(3)(25) |
Principal(4) |
Cost(4) |
Fair Value(18) |
||||||||||
|---|---|---|---|---|---|---|---|---|---|---|---|---|---|---|---|---|
Non-Control/Non-Affiliate Investments(7) |
|
|||||||||||||||
|
||||||||||||||||
AAC Holdings, Inc.(11) |
June 30, 2017 | Substance Abuse Treatment Service Provider |
||||||||||||||
|
LIBOR Plus 11.00% (Floor 1.00%), Current Coupon 13.03%, Secured Debt (Maturity — April 15, 2020)(9)(14) |
2,227 | 2,068 | 2,172 | ||||||||||||
|
LIBOR Plus 12.75% (Floor 1.00%), Current Coupon 16.50%, Secured Debt (Maturity — June 30, 2023)(9)(14) |
14,396 | 14,030 | 9,358 | ||||||||||||
| | | | | | | | | | | | | | | | | |
|
16,098 | 11,530 | ||||||||||||||
|
||||||||||||||||
Adams Publishing Group, LLC(10) |
November 19, 2015 | Local Newspaper Operator |
||||||||||||||
|
Prime Plus 5.00% (Floor 1.50%), Current Coupon 8.75%, Secured Debt (Maturity — July 3, 2023)(9) |
5,000 | 4,930 | 5,000 | ||||||||||||
|
LIBOR Plus 7.50% (Floor 1.50%), Current Coupon 9.44%, Secured Debt (Maturity — July 3, 2023)(9) |
6,158 | 6,058 | 6,158 | ||||||||||||
|
LIBOR Plus 7.50% (Floor 1.50%), Current Coupon 9.50%, Secured Debt (Maturity — July 3, 2023)(9) |
197 | 197 | 197 | ||||||||||||
| | | | | | | | | | | | | | | | | |
|
11,185 | 11,355 | ||||||||||||||
|
||||||||||||||||
ADS Tactical, Inc.(10) |
March 7, 2017 | Value-Added Logistics and Supply Chain Provider to the Defense Industry |
||||||||||||||
|
LIBOR Plus 6.25% (Floor 0.75%), Current Coupon 8.03%, Secured Debt (Maturity — July 26, 2023)(9) |
19,843 | 19,703 | 19,843 | ||||||||||||
|
||||||||||||||||
Aethon United BR LP(10) |
September 8, 2017 | Oil & Gas Exploration & Production |
||||||||||||||
|
LIBOR Plus 6.75% (Floor 1.00%), Current Coupon 8.46%, Secured Debt (Maturity — September 8, 2023)(9) |
9,750 | 9,630 | 9,531 | ||||||||||||
|
||||||||||||||||
Affordable Care Holding Corp.(10) |
May 9, 2019 | Dental Service Organization |
||||||||||||||
|
LIBOR Plus 4.75% (Floor 1.00%), Current Coupon 6.59%, Secured Debt (Maturity — October 22, 2022)(9) |
14,396 | 14,126 | 14,036 | ||||||||||||
|
||||||||||||||||
ALKU, LLC.(11) |
October 18, 2019 | Specialty National Staffing Operator |
||||||||||||||
|
LIBOR Plus 5.50% (Floor 1.00%), Current Coupon 7.44%, Secured Debt (Maturity — July 29, 2026)(9) |
10,000 | 9,902 | 9,883 | ||||||||||||
|
||||||||||||||||
97
MAIN STREET CAPITAL CORPORATION
Consolidated Schedule of Investments — (Continued)
December 31, 2019
(dollars in thousands)
| Portfolio Company(1)(20) |
Investment Date(26) |
Business Description |
Type of Investment(2)(3)(25) |
Principal(4) |
Cost(4) |
Fair Value(18) |
||||||||||
|---|---|---|---|---|---|---|---|---|---|---|---|---|---|---|---|---|
Allen Media, LLC.(11) |
September 18, 2018 | Operator of Cable Television Networks |
||||||||||||||
|
LIBOR Plus 6.50% (Floor 1.00%), Current Coupon 8.48%, Secured Debt (Maturity — August 30, 2023)(9) |
16,270 | 15,894 | 15,863 | ||||||||||||
|
||||||||||||||||
Allen Media Broadcasting LLC(10) |
July 3, 2019 | Operator of Television Broadcasting Networks |
||||||||||||||
|
LIBOR Plus 6.25% (Floor 1.00%), Current Coupon 8.21%, Secured Debt (Maturity — July 3, 2024)(9) |
14,906 | 14,565 | 14,565 | ||||||||||||
|
||||||||||||||||
American Nuts, LLC(10) |
April 10, 2018 | Roaster, Mixer and Packager of Bulk Nuts and Seeds |
||||||||||||||
|
LIBOR Plus 9.50% (Floor 1.00%), Current Coupon 11.60%, Secured Debt (Maturity — April 10, 2023)(9) |
12,243 | 12,002 | 12,233 | ||||||||||||
|
||||||||||||||||
American Teleconferencing Services, Ltd.(11) |
May 19, 2016 | Provider of Audio Conferencing and Video Collaboration Solutions |
||||||||||||||
|
LIBOR Plus 6.50% (Floor 1.00%), Current Coupon 8.36%, Secured Debt (Maturity — June 8, 2023)(9) |
17,389 | 16,421 | 10,460 | ||||||||||||
|
||||||||||||||||
APTIM Corp.(11) |
August 17, 2018 | Engineering, Construction & Procurement |
||||||||||||||
|
7.75% Secured Debt (Maturity — June 15, 2025) |
12,452 | 10,836 | 7,471 | ||||||||||||
|
||||||||||||||||
Arcus Hunting LLC(10) |
January 6, 2015 | Manufacturer of Bowhunting and Archery Products and Accessories |
||||||||||||||
|
LIBOR Plus 10.00% (Floor 1.00%), Current Coupon 12.10%, Secured Debt (Maturity — January 13, 2020)(9) |
13,857 | 13,856 | 13,856 | ||||||||||||
|
||||||||||||||||
ASC Ortho Management Company, LLC(10) |
August 31, 2018 | Provider of Orthopedic Services |
||||||||||||||
|
LIBOR Plus 7.50% (Floor 1.00%), Current Coupon 9.60%, Secured Debt (Maturity — August 31, 2023)(9) |
4,543 | 4,465 | 4,490 | ||||||||||||
|
13.25% PIK Secured Debt (Maturity — December 1, 2023)(19) |
1,854 | 1,821 | 1,854 | ||||||||||||
| | | | | | | | | | | | | | | | | |
|
6,286 | 6,344 | ||||||||||||||
|
||||||||||||||||
ATI Investment Sub, Inc.(11) |
July 11, 2016 | Manufacturer of Solar Tracking Systems |
||||||||||||||
|
LIBOR Plus 7.25% (Floor 1.00%), Current Coupon 9.01%, Secured Debt (Maturity — June 22, 2021)(9) |
2,885 | 2,859 | 2,853 | ||||||||||||
|
||||||||||||||||
98
MAIN STREET CAPITAL CORPORATION
Consolidated Schedule of Investments — (Continued)
December 31, 2019
(dollars in thousands)
| Portfolio Company(1)(20) |
Investment Date(26) |
Business Description |
Type of Investment(2)(3)(25) |
Principal(4) |
Cost(4) |
Fair Value(18) |
||||||||||
|---|---|---|---|---|---|---|---|---|---|---|---|---|---|---|---|---|
ATX Networks Corp.(11)(13)(21) |
June 30, 2015 | Provider of Radio Frequency Management Equipment |
||||||||||||||
|
LIBOR Plus 6.00% (Floor 1.00%) Current Coupon 7.94% / 1.00% PIK, Current Coupon Plus PIK 8.94% Secured Debt (Maturity — June 11, 2021)(9)(19) |
13,593 | 13,414 | 12,743 | ||||||||||||
|
||||||||||||||||
Barfly Ventures, LLC(10) |
August 31, 2015 | Casual Restaurant Group |
||||||||||||||
|
12.00% Secured Debt (Maturity — August 31, 2020) |
10,185 | 10,073 | 7,736 | ||||||||||||
|
Options (3 equivalent units) |
607 | — | |||||||||||||
|
Warrant (2 equivalent unit; Expiration — August 31, 2025; Strike price — $1.00 per unit) |
473 | — | |||||||||||||
| | | | | | | | | | | | | | | | | |
|
11,153 | 7,736 | ||||||||||||||
|
||||||||||||||||
Berry Aviation, Inc.(10) |
July 6, 2018 | Charter Airline Services |
||||||||||||||
|
10.50% Current / 1.5% PIK, Secured Debt (Maturity — January 6, 2024)(19) |
4,554 | 4,518 | 4,554 | ||||||||||||
|
Preferred Member Units (Berry Acquisition, LLC) (122,416 units; 16% cumulative)(8)(19) |
125 | 125 | |||||||||||||
|
Preferred Member Units (Berry Acquisition, LLC) (1,548,387 units; 8% cumulative)(8)(19) |
1,671 | 776 | |||||||||||||
| | | | | | | | | | | | | | | | | |
|
6,314 | 5,455 | ||||||||||||||
|
||||||||||||||||
BigName Commerce, LLC(10) |
May 11, 2017 | Provider of Envelopes and Complimentary Stationery Products |
||||||||||||||
|
LIBOR Plus 7.25% (Floor 1.00%), Current Coupon 9.35%, Secured Debt (Maturity — May 11, 2022)(9) |
2,233 | 2,218 | 2,233 | ||||||||||||
|
||||||||||||||||
Binswanger Enterprises, LLC(10) |
March 10, 2017 | Glass Repair and Installation Service Provider |
||||||||||||||
|
LIBOR Plus 8.50% (Floor 1.00%), Current Coupon 10.41%, Secured Debt (Maturity — March 9, 2022)(9) |
13,731 | 13,443 | 13,731 | ||||||||||||
|
Member Units (1,050,000 units) |
1,050 | 950 | |||||||||||||
| | | | | | | | | | | | | | | | | |
|
14,493 | 14,681 | ||||||||||||||
|
||||||||||||||||
Bluestem Brands, Inc.(11) |
December 19, 2013 | Multi-Channel Retailer of General Merchandise |
||||||||||||||
|
LIBOR Plus 7.50% (Floor 1.00%), Current Coupon 9.31%, Secured Debt (Maturity — November 6, 2020)(9) |
10,622 | 10,571 | 7,973 | ||||||||||||
|
||||||||||||||||
Bojangles', Inc.(11) |
February 5, 2019 | Quick Service Restaurant Group |
||||||||||||||
|
LIBOR Plus 4.75%, Current Coupon 6.50%, Secured Debt (Maturity — January 28, 2026) |
7,782 | 7,642 | 7,827 | ||||||||||||
|
LIBOR Plus 8.50%, Current Coupon 10.25%, Secured Debt (Maturity — January 28, 2027) |
5,000 | 4,907 | 5,012 | ||||||||||||
| | | | | | | | | | | | | | | | | |
|
12,549 | 12,839 | ||||||||||||||
|
||||||||||||||||
99
MAIN STREET CAPITAL CORPORATION
Consolidated Schedule of Investments — (Continued)
December 31, 2019
(dollars in thousands)
| Portfolio Company(1)(20) |
Investment Date(26) |
Business Description |
Type of Investment(2)(3)(25) |
Principal(4) |
Cost(4) |
Fair Value(18) |
||||||||||
|---|---|---|---|---|---|---|---|---|---|---|---|---|---|---|---|---|
Brainworks Software, LLC(10) |
August 12, 2014 | Advertising Sales and Newspaper Circulation Software |
||||||||||||||
|
4.00% Secured Debt (Maturity — July 22, 2019)(9)(17) |
6,733 | 6,733 | 5,955 | ||||||||||||
|
||||||||||||||||
Brightwood Capital Fund Investments(12)(13) |
July 21, 2014 | Investment Partnership |
||||||||||||||
|
LP Interests (Brightwood Capital Fund III, LP) (Fully diluted 1.6%)(8) |
11,160 | 9,005 | |||||||||||||
|
LP Interests (Brightwood Capital Fund IV, LP) (Fully diluted 0.6%)(8) |
4,500 | 4,504 | |||||||||||||
| | | | | | | | | | | | | | | | | |
|
15,660 | 13,509 | ||||||||||||||
|
||||||||||||||||
Cadence Aerospace LLC(10) |
November 14, 2017 | Aerostructure Manufacturing |
||||||||||||||
|
LIBOR Plus 6.50% (Floor 1.00%), Current Coupon 8.40%, Secured Debt (Maturity — November 14, 2023)(9) |
25,287 | 25,089 | 25,287 | ||||||||||||
|
||||||||||||||||
California Pizza Kitchen, Inc.(11) |
August 29, 2016 | Casual Restaurant Group |
||||||||||||||
|
LIBOR Plus 6.00% (Floor 1.00%), Current Coupon 7.91%, Secured Debt (Maturity — August 23, 2022)(9) |
14,599 | 14,501 | 12,739 | ||||||||||||
|
||||||||||||||||
Central Security Group, Inc.(11) |
December 4, 2017 | Security Alarm Monitoring Service Provider |
||||||||||||||
|
LIBOR Plus 5.63% (Floor 1.00%), Current Coupon 7.38%, Secured Debt (Maturity — October 6, 2021)(9) |
13,776 | 13,734 | 11,985 | ||||||||||||
|
||||||||||||||||
Cenveo Corporation(11) |
September 4, 2015 | Provider of Digital Marketing Agency Services |
||||||||||||||
|
Libor Plus 9.50% (Floor 1.00%), Current Coupon 11.45%, Secured Debt (Maturity — June 7, 2023)(9) |
5,674 | 5,498 | 5,674 | ||||||||||||
|
Common Stock (177,130 shares) |
5,309 | 2,923 | |||||||||||||
| | | | | | | | | | | | | | | | | |
|
10,807 | 8,597 | ||||||||||||||
|
||||||||||||||||
Chisholm Energy Holdings, LLC(10) |
May 15, 2019 | Oil & Gas Exploration & Production |
||||||||||||||
|
LIBOR Plus 6.25% (Floor 1.50%), Current Coupon 8.16%, Secured Debt (Maturity — May 15, 2026)(9) |
3,571 | 3,488 | 3,488 | ||||||||||||
|
||||||||||||||||
Clarius BIGS, LLC(10) |
September 23, 2014 | Prints & Advertising Film Financing |
||||||||||||||
|
15% PIK Secured Debt (Maturity — January 5, 2015)(14)(17) |
2,846 | 2,846 | 40 | ||||||||||||
|
||||||||||||||||
Clickbooth.com, LLC(10) |
December 5, 2017 | Provider of Digital Advertising Performance Marketing Solutions |
||||||||||||||
|
LIBOR Plus 8.50% (Floor 1.00%), Current Coupon 10.59%, Secured Debt (Maturity — December 5, 2022)(9) |
2,663 | 2,625 | 2,663 | ||||||||||||
|
||||||||||||||||
100
MAIN STREET CAPITAL CORPORATION
Consolidated Schedule of Investments — (Continued)
December 31, 2019
(dollars in thousands)
| Portfolio Company(1)(20) |
Investment Date(26) |
Business Description |
Type of Investment(2)(3)(25) |
Principal(4) |
Cost(4) |
Fair Value(18) |
||||||||||
|---|---|---|---|---|---|---|---|---|---|---|---|---|---|---|---|---|
Construction Supply Investments, LLC(10) |
December 29, 2016 | Distribution Platform of Specialty Construction Materials to Professional Concrete and Masonry Contractors |
||||||||||||||
|
Member Units (46,152 units) |
4,866 | 7,667 | |||||||||||||
|
||||||||||||||||
Corel Corporation(11)(13)(21) |
July 24, 2019 | Publisher of Desktop and Cloud-based Software |
||||||||||||||
|
LIBOR Plus 5.00% (Floor 1.00%), Current Coupon 6.91%, Secured Debt (Maturity — July 2, 2026)(9) |
15,000 | 14,293 | 14,531 | ||||||||||||
|
||||||||||||||||
CTVSH, PLLC(10) |
August 3, 2017 | Emergency Care and Specialty Service Animal Hospital |
||||||||||||||
|
LIBOR Plus 8.00% (Floor 1.00%), Current Coupon 9.91%, Secured Debt (Maturity — August 3, 2022)(9) |
10,099 | 10,039 | 10,099 | ||||||||||||
|
||||||||||||||||
Darr Equipment LP(10) |
April 15, 2014 | Heavy Equipment Dealer |
||||||||||||||
|
11.5% Current / 1% PIK Secured Debt (Maturity - June 22, 2023)(19) |
5,899 | 5,899 | 5,899 | ||||||||||||
|
Warrants (915,734 equivalent units; Expiration — December 23, 2023; Strike price — $1.50 per unit) |
474 | 300 | |||||||||||||
| | | | | | | | | | | | | | | | | |
|
6,373 | 6,199 | ||||||||||||||
|
||||||||||||||||
Digital River, Inc.(11) |
February 24, 2015 | Provider of Outsourced e-Commerce Solutions and Services |
||||||||||||||
|
LIBOR Plus 6.00% (Floor 1.00%), Current Coupon 7.90%, Secured Debt (Maturity — February 12, 2021)(9) |
15,876 | 15,771 | 15,837 | ||||||||||||
|
||||||||||||||||
DTE Enterprises, LLC(10) |
April 13, 2018 | Industrial Powertrain Repair and Services |
||||||||||||||
|
LIBOR Plus 7.50% (Floor 1.50%), Current Coupon 9.24%, Secured Debt (Maturity — April 13, 2023)(9) |
10,992 | 10,827 | 10,982 | ||||||||||||
|
Class AA Preferred Member Units (non-voting; 10% cumulative)(8)(19) |
860 | 860 | |||||||||||||
|
Class A Preferred Member Units (776,316 units) |
776 | 1,490 | |||||||||||||
| | | | | | | | | | | | | | | | | |
|
12,463 | 13,332 | ||||||||||||||
|
||||||||||||||||
Dynamic Communities, LLC(10) |
July 17, 2018 | Developer of Business Events and Online Community Groups |
||||||||||||||
|
LIBOR Plus 8.00% (Floor 1.00%), Current Coupon 9.75%, Secured Debt (Maturity — July 17, 2023)(9) |
5,460 | 5,375 | 5,458 | ||||||||||||
|
||||||||||||||||
Echo US Holdings, LLC.(10) |
November 12, 2019 | Developer and Manufacturer of PVC and Polypropylene Materials |
||||||||||||||
|
LIBOR Plus 6.25% (Floor 1.63%), Current Coupon 7.96%, Secured Debt (Maturity — October 25, 2024)(9) |
22,414 | 22,292 | 22,292 | ||||||||||||
|
||||||||||||||||
101
MAIN STREET CAPITAL CORPORATION
Consolidated Schedule of Investments — (Continued)
December 31, 2019
(dollars in thousands)
| Portfolio Company(1)(20) |
Investment Date(26) |
Business Description |
Type of Investment(2)(3)(25) |
Principal(4) |
Cost(4) |
Fair Value(18) |
||||||||||
|---|---|---|---|---|---|---|---|---|---|---|---|---|---|---|---|---|
EnCap Energy Fund Investments(12)(13) |
December 28, 2010 | Investment Partnership |
||||||||||||||
|
LP Interests (EnCap Energy Capital Fund VIII, L.P.) (Fully diluted 0.1%)(8) |
3,617 | 1,354 | |||||||||||||
|
LP Interests (EnCap Energy Capital Fund VIII Co- Investors, L.P.) (Fully diluted 0.4%) |
2,097 | 703 | |||||||||||||
|
LP Interests (EnCap Energy Capital Fund IX, L.P.) (Fully diluted 0.1%)(8) |
4,360 | 2,780 | |||||||||||||
|
LP Interests (EnCap Energy Capital Fund X, L.P.) (Fully diluted 0.1%)(8) |
8,427 | 8,822 | |||||||||||||
|
LP Interests (EnCap Flatrock Midstream Fund II, L.P.) (Fully diluted 0.8%)(8) |
7,337 | 5,669 | |||||||||||||
|
LP Interests (EnCap Flatrock Midstream Fund III, L.P.) (Fully diluted 0.2%)(8) |
6,674 | 6,677 | |||||||||||||
| | | | | | | | | | | | | | | | | |
|
32,512 | 26,005 | ||||||||||||||
|
||||||||||||||||
Encino Acquisition Partners Holdings, Inc.(11) |
November 16, 2018 | Oil & Gas Exploration & Production |
||||||||||||||
|
LIBOR Plus 6.75% (Floor 1.00%), Current Coupon 8.50%, Secured Debt (Maturity — October 29, 2025)(9) |
9,000 | 8,921 | 6,795 | ||||||||||||
|
||||||||||||||||
EPIC Y-Grade Services, LP(11) |
June 22, 2018 | NGL Transportation & Storage |
||||||||||||||
|
LIBOR Plus 6.00%, Current Coupon 8.04%, Secured Debt (Maturity — June 13, 2024) |
10,275 | 10,116 | 10,050 | ||||||||||||
|
||||||||||||||||
Evergreen Skills Lux S.á r.l. |
May 5, 2014 | Technology-based Performance Support Solutions |
||||||||||||||
|
LIBOR Plus 8.25% (Floor 1.00%), Current Coupon 10.45%, Secured Debt (Maturity — April 28, 2022)(9) |
6,999 | 6,928 | 1,965 | ||||||||||||
|
||||||||||||||||
Felix Investments Holdings II(10) |
August 9, 2017 | Oil & Gas Exploration & Production |
||||||||||||||
|
LIBOR Plus 6.50% (Floor 1.00%), Current Coupon 8.40%, Secured Debt (Maturity — August 9, 2022)(9) |
5,000 | 4,944 | 5,000 | ||||||||||||
|
||||||||||||||||
Flavors Holdings Inc.(11) |
October 15, 2014 | Global Provider of Flavoring and Sweetening Products |
||||||||||||||
|
LIBOR Plus 5.75% (Floor 1.00%), Current Coupon 7.77%, Secured Debt (Maturity — April 3, 2020)(9) |
11,297 | 11,247 | 10,619 | ||||||||||||
|
||||||||||||||||
Fortna, Inc.(10) |
July 23, 2019 | Process, Physcial Distribution and Logistics Consulting Services |
||||||||||||||
|
LIBOR Plus 5.00%, Current Coupon 6.75%, Secured Debt (Maturity — April 8, 2025) |
7,751 | 7,577 | 7,577 | ||||||||||||
|
||||||||||||||||
102
MAIN STREET CAPITAL CORPORATION
Consolidated Schedule of Investments — (Continued)
December 31, 2019
(dollars in thousands)
| Portfolio Company(1)(20) |
Investment Date(26) |
Business Description |
Type of Investment(2)(3)(25) |
Principal(4) |
Cost(4) |
Fair Value(18) |
||||||||||
|---|---|---|---|---|---|---|---|---|---|---|---|---|---|---|---|---|
GeoStabilization International (GSI)(11) |
December 31, 2018 | Geohazard Engineering Services & Maintenance |
||||||||||||||
|
LIBOR Plus 5.25%, Current Coupon 7.05%, Secured Debt (Maturity — December 19, 2025) |
16,376 | 16,230 | 16,335 | ||||||||||||
|
||||||||||||||||
GoWireless Holdings, Inc.(11) |
December 31, 2017 | Provider of Wireless Telecommunications Carrier Services |
||||||||||||||
|
LIBOR Plus 6.50% (Floor 1.00%), Current Coupon 8.25%, Secured Debt (Maturity — December 22, 2024)(9) |
18,120 | 17,964 | 17,471 | ||||||||||||
|
||||||||||||||||
Grupo Hima San Pablo, Inc.(11) |
March 7, 2013 | Tertiary Care Hospitals |
||||||||||||||
|
LIBOR Plus 7.00% (Floor 1.50%), Current Coupon 8.91%, Secured Debt (Maturity — April 30, 2019)(9)(17) |
4,504 | 4,504 | 3,343 | ||||||||||||
|
13.75% Secured Debt (Maturity — October 15, 2018)(17) |
2,055 | 2,040 | 167 | ||||||||||||
| | | | | | | | | | | | | | | | | |
|
6,544 | 3,510 | ||||||||||||||
|
||||||||||||||||
GS HVAM Intermediate, LLC(10) |
October 18, 2019 | Specialized Food Distributor |
||||||||||||||
|
LIBOR Plus 5.75% (Floor 1.00%), Current Coupon 7.51%, Secured Debt (Maturity — October 2, 2024)(9) |
11,364 | 11,233 | 11,233 | ||||||||||||
|
||||||||||||||||
HDC/HW Intermediate Holdings(10) |
December 21, 2018 | Managed Services and Hosting Provider |
||||||||||||||
|
LIBOR Plus 7.50% (Floor 1.00%), Current Coupon 9.53%, Secured Debt (Maturity — December 21, 2023)(9) |
3,498 | 3,440 | 3,493 | ||||||||||||
|
||||||||||||||||
Hoover Group, Inc.(10)(13) |
October 21, 2016 | Provider of Storage Tanks and Related Products to the Energy and Petrochemical Markets |
||||||||||||||
|
LIBOR Plus 7.25% (Floor 1.00%), Current Coupon 9.26%, Secured Debt (Maturity — January 28, 2021)(9) |
20,764 | 20,119 | 19,206 | ||||||||||||
|
||||||||||||||||
Hunter Defense Technologies, Inc.(10) |
March 29, 2018 | Provider of Military and Commercial Shelters and Systems |
||||||||||||||
|
LIBOR Plus 7.00% (Floor 1.00%), Current Coupon 9.02%, Secured Debt (Maturity — March 29, 2023)(9) |
29,097 | 28,659 | 29,097 | ||||||||||||
|
||||||||||||||||
HW Temps LLC |
July 2, 2015 | Temporary Staffing Solutions |
||||||||||||||
|
8.00% Secured Debt (Maturity — March 29, 2023) |
10,181 | 10,025 | 8,913 | ||||||||||||
|
||||||||||||||||
103
MAIN STREET CAPITAL CORPORATION
Consolidated Schedule of Investments — (Continued)
December 31, 2019
(dollars in thousands)
| Portfolio Company(1)(20) |
Investment Date(26) |
Business Description |
Type of Investment(2)(3)(25) |
Principal(4) |
Cost(4) |
Fair Value(18) |
||||||||||
|---|---|---|---|---|---|---|---|---|---|---|---|---|---|---|---|---|
Hydrofarm Holdings LLC(10) |
May 18, 2017 | Wholesaler of Horticultural Products |
||||||||||||||
|
LIBOR Plus 10.00%, Current Coupon 3.54% / 8.26% PIK, Current Coupon Plus PIK 11.80% Secured Debt (Maturity — May 12, 2022)(19) |
7,660 | 7,547 | 6,414 | ||||||||||||
|
||||||||||||||||
Hyperion Materials & Technologies, Inc.(11)(13) |
September 12, 2019 | Manufacturer of Cutting and Machine Tools & Speciality Polishing Compounds |
||||||||||||||
|
LIBOR Plus 5.50% (Floor 1.00%), Current Coupon 7.25%, Secured Debt (Maturity — August 28, 2026)(9) |
22,500 | 22,066 | 22,275 | ||||||||||||
|
||||||||||||||||
iEnergizer Limited(10)(13)(21) |
April 17, 2019 | Provider of Business Outsourcing Solutions |
||||||||||||||
|
LIBOR Plus 6.00% (Floor 1.00%), Current Coupon 7.79%, Secured Debt (Maturity — April 17, 2024)(9) |
12,963 | 12,848 | 12,962 | ||||||||||||
|
||||||||||||||||
Implus Footcare, LLC(10) |
June 1, 2017 | Provider of Footwear and Related Accessories |
||||||||||||||
|
LIBOR Plus 6.25% (Floor 1.00%), Current Coupon 8.27%, Secured Debt (Maturity — April 30, 2024)(9) |
18,577 | 18,178 | 18,217 | ||||||||||||
|
||||||||||||||||
Independent Pet Partners Intermediate Holdings, LLC(10) |
November 20, 2018 | Omnichannel Retailer of Specialty Pet Products |
||||||||||||||
|
LIBOR Plus 9.00% (Floor 1.00%), Current Coupon 11.28%, Secured Debt (Maturity — November 19, 2023)(9) |
18,799 | 18,487 | 18,799 | ||||||||||||
|
Member Units (1,558,333 units) |
1,558 | 1,260 | |||||||||||||
| | | | | | | | | | | | | | | | | |
|
20,045 | 20,059 | ||||||||||||||
|
||||||||||||||||
Industrial Services Acquisition, LLC(10) |
June 17, 2016 | Industrial Cleaning Services |
||||||||||||||
|
6% Current / 7% PIK Unsecured Debt (Maturity — December 17, 2022)(19) |
5,242 | 5,174 | 5,242 | ||||||||||||
|
Preferred Member Units (Industrial Services Investments, LLC) (144 units; 10% cumulative)(8)(19) |
103 | 103 | |||||||||||||
|
Preferred Member Units (Industrial Services Investments, LLC) (80 units; 20% cumulative)(8)(19) |
60 | 60 | |||||||||||||
|
Member Units (Industrial Services Investments, LLC) (900 units) |
900 | 510 | |||||||||||||
| | | | | | | | | | | | | | | | | |
|
6,237 | 5,915 | ||||||||||||||
|
||||||||||||||||
Inn of the Mountain Gods Resort and Casino(11) |
October 30, 2013 | Hotel & Casino Owner & Operator |
||||||||||||||
|
9.25% Secured Debt (Maturity — November 30, 2020) |
7,762 | 7,584 | 7,684 | ||||||||||||
|
||||||||||||||||
104
MAIN STREET CAPITAL CORPORATION
Consolidated Schedule of Investments — (Continued)
December 31, 2019
(dollars in thousands)
| Portfolio Company(1)(20) |
Investment Date(26) |
Business Description |
Type of Investment(2)(3)(25) |
Principal(4) |
Cost(4) |
Fair Value(18) |
||||||||||
|---|---|---|---|---|---|---|---|---|---|---|---|---|---|---|---|---|
Interface Security Systems, L.L.C(10) |
August 7, 2019 | Commercial Security & Alarm Services |
||||||||||||||
|
LIBOR Plus 7.00% (Floor 1.75%), Current Coupon 8.77%, Secured Debt (Maturity — August 7, 2023)(9) |
7,500 | 7,363 | 7,363 | ||||||||||||
|
||||||||||||||||
Intermedia Holdings, Inc.(11) |
August 3, 2018 | Unified Communications as a Service |
||||||||||||||
|
LIBOR Plus 6.00% (Floor 1.00%), Current Coupon 7.75%, Secured Debt (Maturity — July 19, 2025)(9) |
20,130 | 20,033 | 20,180 | ||||||||||||
|
||||||||||||||||
Invincible Boat Company, LLC.(10) |
August 28, 2019 | Manufacturer of Sport Fishing Boats |
||||||||||||||
|
LIBOR Plus 6.50% (Floor 1.00%), Current Coupon 8.53%, Secured Debt (Maturity — August 28, 2025)(9) |
9,872 | 9,773 | 9,773 | ||||||||||||
|
||||||||||||||||
Isagenix International, LLC(11) |
June 21, 2018 | Direct Marketer of Health & Wellness Products |
||||||||||||||
|
LIBOR Plus 5.75% (Floor 1.00%), Current Coupon 7.77%, Secured Debt (Maturity — June 14, 2025)(9) |
5,943 | 5,893 | 4,273 | ||||||||||||
|
||||||||||||||||
JAB Wireless, Inc.(10) |
May 2, 2018 | Fixed Wireless Broadband Provider |
||||||||||||||
|
LIBOR Plus 8.00% (Floor 1.00%), Current Coupon 9.74%, Secured Debt (Maturity — May 2, 2023)(9) |
14,775 | 14,669 | 14,775 | ||||||||||||
|
||||||||||||||||
Jackmont Hospitality, Inc.(10) |
May 26, 2015 | Franchisee of Casual Dining Restaurants |
||||||||||||||
|
LIBOR Plus 6.75% (Floor 1.00%), Current Coupon 8.45%, Secured Debt (Maturity — May 26, 2021)(9) |
4,059 | 4,055 | 4,059 | ||||||||||||
|
||||||||||||||||
Joerns Healthcare, LLC(11) |
April 3, 2013 | Manufacturer and Distributor of Health Care Equipment & Supplies |
||||||||||||||
|
LIBOR Plus 6.00% (Floor 1.00%), Current Coupon 7.91% Secured Debt (Maturity — August 21, 2024)(9) |
4,016 | 3,942 | 3,942 | ||||||||||||
|
Common Stock (472,579 shares) |
4,429 | 4,429 | |||||||||||||
| | | | | | | | | | | | | | | | | |
|
8,371 | 8,371 | ||||||||||||||
|
||||||||||||||||
Kemp Technologies Inc.(10) |
June 27, 2019 | Provider of Application Delivery Controllers |
||||||||||||||
|
LIBOR Plus 6.25% (Floor 1.00%), Current Coupon 8.00%, Secured Debt (Maturity — March 29, 2024)(9) |
7,462 | 7,326 | 7,463 | ||||||||||||
|
||||||||||||||||
Kore Wireless Group Inc.(11) |
December 31, 2018 | Mission Critical Software Platform |
||||||||||||||
|
LIBOR Plus 5.50%, Current Coupon 7.52%, Secured Debt (Maturity — December 20, 2024) |
19,285 | 19,189 | 19,164 | ||||||||||||
|
||||||||||||||||
105
MAIN STREET CAPITAL CORPORATION
Consolidated Schedule of Investments — (Continued)
December 31, 2019
(dollars in thousands)
| Portfolio Company(1)(20) |
Investment Date(26) |
Business Description |
Type of Investment(2)(3)(25) |
Principal(4) |
Cost(4) |
Fair Value(18) |
||||||||||
|---|---|---|---|---|---|---|---|---|---|---|---|---|---|---|---|---|
Larchmont Resources, LLC(11) |
August 13, 2013 | Oil & Gas Exploration & Production |
||||||||||||||
|
LIBOR Plus 7.00% (Floor 1.00%), Current Coupon 8.89%, Secured Debt (Maturity — August 7, 2020)(9) |
2,145 | 2,145 | 1,990 | ||||||||||||
|
Member Units (Larchmont Intermediate Holdco, LLC) (2,828 units) |
353 | 707 | |||||||||||||
| | | | | | | | | | | | | | | | | |
|
2,498 | 2,697 | ||||||||||||||
|
||||||||||||||||
Laredo Energy VI, LP(10) |
January 15, 2019 | Oil & Gas Exploration & Production |
||||||||||||||
|
LIBOR Plus 9.63% (Floor 2.00%), Current Coupon 5.38% / 6.26% PIK, Current Coupon Plus PIK 11.64%, Secured Debt (Maturity — November 19, 2021)(9)(19) |
11,312 | 11,166 | 10,638 | ||||||||||||
|
||||||||||||||||
Lightbox Holdings, L.P.(11) |
May 23, 2019 | Provider of Commercial Real Estate Software |
||||||||||||||
|
LIBOR Plus 5.00%, Current Coupon 6.74%, Secured Debt (Maturity — May 9, 2026) |
14,925 | 14,713 | 14,738 | ||||||||||||
|
||||||||||||||||
LKCM Headwater Investments I, L.P.(12)(13) |
January 25, 2013 | Investment Partnership |
||||||||||||||
|
LP Interests (Fully diluted 2.3%)(8) |
1,746 | 3,682 | |||||||||||||
|
||||||||||||||||
LL Management, Inc.(10) |
May 2, 2019 | Medical Transportation Service Provider |
||||||||||||||
|
LIBOR Plus 6.50% (Floor 1.00%), Current Coupon 8.56%, Secured Debt (Maturity — September 25, 2023)(9) |
13,754 | 13,625 | 13,751 | ||||||||||||
|
||||||||||||||||
Logix Acquisition Company, LLC(10) |
June 24, 2016 | Competitive Local Exchange Carrier |
||||||||||||||
|
LIBOR Plus 5.75% (Floor 1.00%), Current Coupon 7.50%, Secured Debt (Maturity — December 22, 2024)(9) |
18,381 | 18,199 | 18,197 | ||||||||||||
|
||||||||||||||||
Looking Glass Investments, LLC(12)(13) |
July 1, 2015 | Specialty Consumer Finance |
||||||||||||||
|
Member Units (2.5 units) |
125 | 25 | |||||||||||||
|
Member Units (LGI Predictive Analytics LLC) (190,712 units) |
49 | 16 | |||||||||||||
| | | | | | | | | | | | | | | | | |
|
174 | 41 | ||||||||||||||
|
||||||||||||||||
LSF9 Atlantis Holdings, LLC(11) |
May 17, 2017 | Provider of Wireless Telecommunications Carrier Services |
||||||||||||||
|
LIBOR Plus 6.00% (Floor 1.00%), Current Coupon 7.74%, Secured Debt (Maturity — May 1, 2023)(9) |
9,458 | 9,458 | 8,761 | ||||||||||||
|
||||||||||||||||
Lulu's Fashion Lounge, LLC(10) |
August 31, 2017 | Fast Fashion E-Commerce Retailer |
||||||||||||||
|
LIBOR Plus 9.00% (Floor 1.00%), Current Coupon 10.75%, Secured Debt (Maturity — August 28, 2022)(9) |
11,335 | 11,070 | 11,109 | ||||||||||||
|
||||||||||||||||
106
MAIN STREET CAPITAL CORPORATION
Consolidated Schedule of Investments — (Continued)
December 31, 2019
(dollars in thousands)
| Portfolio Company(1)(20) |
Investment Date(26) |
Business Description |
Type of Investment(2)(3)(25) |
Principal(4) |
Cost(4) |
Fair Value(18) |
||||||||||
|---|---|---|---|---|---|---|---|---|---|---|---|---|---|---|---|---|
Lynx FBO Operating LLC(10) |
September 30, 2019 | Fixed Based Operator in the General Aviation Industry |
||||||||||||||
|
LIBOR Plus 5.75% (Floor 1.00%), Current Coupon 7.86%, Secured Debt (Maturity — September 30, 2024)(9) |
13,750 | 13,451 | 13,451 | ||||||||||||
|
Member Units (3,704 units) |
500 | 500 | |||||||||||||
| | | | | | | | | | | | | | | | | |
|
13,951 | 13,951 | ||||||||||||||
|
||||||||||||||||
Mac Lean-Fogg Company(10) |
April 22, 2019 | Manufacturer and Supplier for Auto and Power Markets |
||||||||||||||
|
LIBOR Plus 5.00%, Current Coupon 6.75%, Secured Debt (Maturity — December 22, 2025) |
16,648 | 16,528 | 16,643 | ||||||||||||
|
Preferred Stock (1,516 shares; 4.50% Cash / 9.25% PIK cumulative)(8)(19) |
1,775 | 1,775 | |||||||||||||
| | | | | | | | | | | | | | | | | |
|
18,303 | 18,418 | ||||||||||||||
|
||||||||||||||||
MHVC Acquisition Corp.(11) |
May 8, 2017 | Provider of differentiated information solutions, systems engineering, and analytics |
||||||||||||||
|
LIBOR Plus 5.25% (Floor 1.00%), Current Coupon 7.01%, Secured Debt (Maturity — April 29, 2024)(9) |
19,950 | 19,855 | 19,950 | ||||||||||||
|
||||||||||||||||
Mills Fleet Farm Group, LLC(10) |
October 24, 2018 | Omnichannel Retailer of Work, Farm and Lifestyle Merchandise |
||||||||||||||
|
LIBOR Plus 6.25% (Floor 1.00%), Current Coupon 8.29% / 0.75% PIK, Current Coupon Plus PIK 9.04%, Secured Debt (Maturity — October 24, 2024)(9)(19) |
14,879 | 14,556 | 14,187 | ||||||||||||
|
||||||||||||||||
NBG Acquisition Inc(11) |
April 28, 2017 | Wholesaler of Home Décor Products |
||||||||||||||
|
LIBOR Plus 5.50% (Floor 1.00%), Current Coupon 7.52%, Secured Debt (Maturity — April 26, 2024)(9) |
4,181 | 4,134 | 3,247 | ||||||||||||
|
||||||||||||||||
NinjaTrader, LLC(10) |
December 18, 2019 | Operator of Futures Trading Platform |
||||||||||||||
|
LIBOR Plus 6.00% (Floor 1.50%), Current Coupon 7.90%, Secured Debt (Maturity — December 18, 2024)(9) |
9,675 | 9,490 | 9,490 | ||||||||||||
|
||||||||||||||||
NNE Partners, LLC(10) |
March 2, 2017 | Oil & Gas Exploration & Production |
||||||||||||||
|
LIBOR Plus 8.00%, Current Coupon 9.91%, Secured Debt (Maturity — March 2, 2022) |
23,417 | 23,268 | 23,147 | ||||||||||||
|
||||||||||||||||
North American Lifting Holdings, Inc.(11) |
February 26, 2015 | Crane Service Provider |
||||||||||||||
|
LIBOR Plus 4.50% (Floor 1.00%), Current Coupon 6.52%, Secured Debt (Maturity — November 27, 2020)(9) |
7,584 | 7,300 | 6,417 | ||||||||||||
|
||||||||||||||||
107
MAIN STREET CAPITAL CORPORATION
Consolidated Schedule of Investments — (Continued)
December 31, 2019
(dollars in thousands)
| Portfolio Company(1)(20) |
Investment Date(26) |
Business Description |
Type of Investment(2)(3)(25) |
Principal(4) |
Cost(4) |
Fair Value(18) |
||||||||||
|---|---|---|---|---|---|---|---|---|---|---|---|---|---|---|---|---|
Novetta Solutions, LLC(11) |
June 21, 2017 | Provider of Advanced Analytics Solutions for Defense Agencies |
||||||||||||||
|
LIBOR Plus 5.00% (Floor 1.00%), Current Coupon 6.76%, Secured Debt (Maturity — October 17, 2022)(9) |
21,060 | 20,673 | 20,749 | ||||||||||||
|
||||||||||||||||
NTM Acquisition Corp.(11) |
July 12, 2016 | Provider of B2B Travel Information Content |
||||||||||||||
|
LIBOR Plus 6.25% (Floor 1.00%), Current Coupon 8.00%, Secured Debt (Maturity — June 7, 2022)(9) |
4,879 | 4,874 | 4,879 | ||||||||||||
|
||||||||||||||||
Ospemifene Royalty Sub LLC (QuatRx)(10) |
July 8, 2013 | Estrogen-Deficiency Drug Manufacturer and Distributor |
||||||||||||||
|
11.5% Secured Debt (Maturity — November 15, 2026)(14) |
4,868 | 4,868 | 463 | ||||||||||||
|
||||||||||||||||
PaySimple, Inc.(10) |
September 9, 2019 | Leading technology services commerce platform |
||||||||||||||
|
LIBOR Plus 5.50% (Floor 1.00%), Current Coupon 7.28%, Secured Debt (Maturity — August 23, 2025)(9) |
15,845 | 15,586 | 15,766 | ||||||||||||
|
||||||||||||||||
Permian Holdco 2, Inc.(11) |
February 12, 2013 | Storage Tank Manufacturer |
||||||||||||||
|
14.00% PIK Unsecured Debt (Maturity — October 15, 2021)(19) |
456 | 456 | 341 | ||||||||||||
|
18.00% PIK Unsecured Debt (Maturity — June 30, 2022)(19) |
319 | 319 | 319 | ||||||||||||
|
Preferred Stock (Permian Holdco 1, Inc.) (154,558 units) |
799 | 100 | |||||||||||||
| | | | | | | | | | | | | | | | | |
|
1,574 | 760 | ||||||||||||||
|
||||||||||||||||
Point.360(10) |
July 8, 2015 | Fully Integrated Provider of Digital Media Services |
||||||||||||||
|
Warrants (65,463 equivalent shares; Expiration — July 7, 2020; Strike price — $0.75 per share) |
69 | — | |||||||||||||
|
Common Stock (163,658 shares) |
273 | — | |||||||||||||
| | | | | | | | | | | | | | | | | |
|
342 | — | ||||||||||||||
|
||||||||||||||||
PricewaterhouseCoopers Public Sector LLP(11) |
May 24, 2018 | Provider of Consulting Services to Governments |
||||||||||||||
|
LIBOR Plus 8.00%, Current Coupon 9.75%, Secured Debt (Maturity — May 1, 2026) |
9,000 | 8,965 | 8,865 | ||||||||||||
|
||||||||||||||||
PT Network, LLC(10) |
November 1, 2013 | Provider of Outpatient Physical Therapy and Sports Medicine Services |
||||||||||||||
|
LIBOR Plus 5.50% (Floor 1.00%), Current Coupon 7.44% / 2.00% PIK, Current Coupon Plus PIK 9.44%, Secured Debt (Maturity — November 30, 2023)(9)(19) |
8,491 | 8,491 | 8,414 | ||||||||||||
|
||||||||||||||||
108
MAIN STREET CAPITAL CORPORATION
Consolidated Schedule of Investments — (Continued)
December 31, 2019
(dollars in thousands)
| Portfolio Company(1)(20) |
Investment Date(26) |
Business Description |
Type of Investment(2)(3)(25) |
Principal(4) |
Cost(4) |
Fair Value(18) |
||||||||||
|---|---|---|---|---|---|---|---|---|---|---|---|---|---|---|---|---|
Research Now Group, Inc. and Survey Sampling International, LLC(11) |
December 31, 2017 | Provider of Outsourced Online Surveying |
||||||||||||||
|
LIBOR Plus 5.50% (Floor 1.00%), Current Coupon 7.41%, Secured Debt (Maturity — December 20, 2024)(9) |
18,115 | 17,590 | 18,140 | ||||||||||||
|
||||||||||||||||
RM Bidder, LLC(10) |
November 12, 2015 | Scripted and Unscripted TV and Digital Programming Provider |
||||||||||||||
|
Warrants (327,532 equivalent units; Expiration — October 20, 2025; Strike price — $14.28 per unit) |
425 | — | |||||||||||||
|
Member Units (2,779 units) |
46 | 18 | |||||||||||||
| | | | | | | | | | | | | | | | | |
|
471 | 18 | ||||||||||||||
|
||||||||||||||||
SAFETY Investment Holdings, LLC |
April 29, 2016 | Provider of Intelligent Driver Record Monitoring Software and Services |
||||||||||||||
|
Member Units (2,000,000 units) |
2,000 | 2,380 | |||||||||||||
|
||||||||||||||||
Salient Partners L.P.(11) |
June 25, 2015 | Provider of Asset Management Services |
||||||||||||||
|
LIBOR Plus 6.00% (Floor 1.00%), Current Coupon 7.69%, Secured Debt (Maturity — June 9, 2021)(9) |
6,675 | 6,657 | 6,675 | ||||||||||||
|
||||||||||||||||
SMART Modular Technologies, Inc.(10)(13) |
August 18, 2017 | Provider of Specialty Memory Solutions |
||||||||||||||
|
LIBOR Plus 6.25% (Floor 1.00%), Current Coupon 8.16%, Secured Debt (Maturity — August 9, 2022)(9) |
18,484 | 18,332 | 18,669 | ||||||||||||
|
||||||||||||||||
Staples Canada ULC(10)(13)(21) |
September 14, 2017 | Office Supplies Retailer |
||||||||||||||
|
LIBOR Plus 7.00% (Floor 1.00%), Current Coupon 8.98%, Secured Debt (Maturity — September 12, 2024)(9)(22) |
14,546 | 14,348 | 13,530 | ||||||||||||
|
||||||||||||||||
TE Holdings, LLC(11) |
December 5, 2013 | Oil & Gas Exploration & Production |
||||||||||||||
|
Member Units (97,048 units) |
970 | — | |||||||||||||
|
||||||||||||||||
TEAM Public Choices, LLC(10) |
October 28, 2019 | Home-Based Care Employment Service Provider |
||||||||||||||
|
LIBOR Plus 6.00% (Floor 1.00%), Current Coupon 7.75%, Secured Debt (Maturity — September 20, 2024)(9) |
16,844 | 16,680 | 16,680 | ||||||||||||
|
||||||||||||||||
Tectonic Financial, Inc. |
May 15, 2017 | Financial Services Organization |
||||||||||||||
|
Common Stock (400,000 shares)(8) |
2,000 | 2,620 | |||||||||||||
|
||||||||||||||||
TGP Holdings III LLC(11) |
September 30, 2017 | Outdoor Cooking & Accessories |
||||||||||||||
|
LIBOR Plus 8.50% (Floor 1.00%), Current Coupon 10.25%, Secured Debt (Maturity — September 25, 2025)(9) |
5,500 | 5,440 | 5,143 | ||||||||||||
|
||||||||||||||||
109
MAIN STREET CAPITAL CORPORATION
Consolidated Schedule of Investments — (Continued)
December 31, 2019
(dollars in thousands)
| Portfolio Company(1)(20) |
Investment Date(26) |
Business Description |
Type of Investment(2)(3)(25) |
Principal(4) |
Cost(4) |
Fair Value(18) |
||||||||||
|---|---|---|---|---|---|---|---|---|---|---|---|---|---|---|---|---|
The Pasha Group(11) |
February 2, 2018 | Diversified Logistics and Transportation Provided |
||||||||||||||
|
LIBOR Plus 7.50% (Floor 1.00%), Current Coupon 9.31%, Secured Debt (Maturity — January 26, 2023)(9) |
8,984 | 8,793 | 9,074 | ||||||||||||
|
||||||||||||||||
TMC Merger Sub Corp.(11) |
December 22, 2016 | Refractory & Maintenance Services Provider |
||||||||||||||
|
LIBOR Plus 6.75% (Floor 1.00%), Current Coupon 8.53%, Secured Debt (Maturity — October 31, 2022)(9)(24) |
15,527 | 15,394 | 15,392 | ||||||||||||
|
||||||||||||||||
TOMS Shoes, LLC(11) |
November 13, 2014 | Global Designer, Distributor, and Retailer of Casual Footwear |
||||||||||||||
|
LIBOR Plus 5.50% (Floor 1.00%), Current Coupon 7.46%, Secured Debt (Maturity — September 30, 2025)(9) |
571 | 571 | 571 | ||||||||||||
|
LIBOR Plus 5.00% (Floor 1.00%), Current Coupon 6.96%, Secured Debt (Maturity — December 31, 2025)(9) |
1,637 | 1,637 | 1,637 | ||||||||||||
|
Member Units (16,321 units) |
245 | 245 | |||||||||||||
| | | | | | | | | | | | | | | | | |
|
2,453 | 2,453 | ||||||||||||||
|
||||||||||||||||
USA DeBusk LLC(10) |
October 22, 2019 | Provider of Industrial Cleaning Services |
||||||||||||||
|
LIBOR Plus 5.75% (Floor 1.00%), Current Coupon 7.54%, Secured Debt (Maturity — October 22, 2024)(9) |
30,000 | 29,423 | 29,423 | ||||||||||||
|
||||||||||||||||
U.S. TelePacific Corp.(11) |
September 14, 2016 | Provider of Communications and Managed Services |
||||||||||||||
|
LIBOR Plus 5.00% (Floor 1.00%), Current Coupon 7.02%, Secured Debt (Maturity — May 2, 2023)(9) |
17,088 | 16,887 | 16,447 | ||||||||||||
|
||||||||||||||||
Vida Capital, Inc(11) |
October 10, 2019 | Alternative Asset Manager |
||||||||||||||
|
LIBOR Plus 6.00%, Current Coupon 7.93%, Secured Debt (Maturity — October 1, 2026) |
18,500 | 18,232 | 18,315 | ||||||||||||
|
||||||||||||||||
VIP Cinema Holdings, Inc.(11) |
March 9, 2017 | Supplier of Luxury Seating to the Cinema Industry |
||||||||||||||
|
LIBOR Plus 8.00% (Floor 1.00%), Current Coupon 9.91%, Secured Debt (Maturity — March 1, 2023)(9)(14) |
10,063 | 10,030 | 5,301 | ||||||||||||
|
||||||||||||||||
110
MAIN STREET CAPITAL CORPORATION
Consolidated Schedule of Investments — (Continued)
December 31, 2019
(dollars in thousands)
| Portfolio Company(1)(20) |
Investment Date(26) |
Business Description |
Type of Investment(2)(3)(25) |
Principal(4) |
Cost(4) |
Fair Value(18) |
||||||||||
|---|---|---|---|---|---|---|---|---|---|---|---|---|---|---|---|---|
Vistar Media, Inc.(10) |
February 17, 2017 | Operator of Digital Out-of-Home Advertising Platform |
||||||||||||||
|
LIBOR Plus 8.00% (Floor 1.00%), Current Coupon 10.00%, Secured Debt (Maturity — April 3, 2023)(9) |
4,963 | 4,784 | 4,939 | ||||||||||||
|
Preferred Stock (70,207 shares) |
767 | 1,610 | |||||||||||||
|
Warrants (69,675 equivalent shares; Expiration — April 3, 2029; Strike price — $10.92 per share) |
— | 1,630 | |||||||||||||
| | | | | | | | | | | | | | | | | |
|
5,551 | 8,179 | ||||||||||||||
|
||||||||||||||||
Wireless Vision Holdings, LLC(10) |
September 29, 2017 | Provider of Wireless Telecommunications Carrier Services |
||||||||||||||
|
LIBOR Plus 9.65% (Floor 1.00%), Current Coupon 11.57% / 1.00% PIK, Current Coupon Plus PIK 12.57%, Secured Debt (Maturity — September 29, 2022)(9)(19)(23) |
7,136 | 7,022 | 7,129 | ||||||||||||
|
LIBOR Plus 8.91% (Floor 1.00%), Current Coupon 10.67% / 1.00% PIK, Current Coupon Plus PIK 11.67%, Secured Debt (Maturity — September 29, 2022)(9)(19)(23) |
6,201 | 6,132 | 6,200 | ||||||||||||
| | | | | | | | | | | | | | | | | |
|
13,154 | 13,329 | ||||||||||||||
|
||||||||||||||||
YS Garments, LLC(11) |
August 22, 2018 | Designer and Provider of Branded Activewear |
||||||||||||||
|
LIBOR Plus 6.00% (Floor 1.00%), Current Coupon 7.60% Secured Debt (Maturity — August 9, 2024)(9) |
14,531 | 14,412 | 14,404 | ||||||||||||
|
||||||||||||||||
Zilliant Incorporated |
June 15, 2012 | Price Optimization and Margin Management Solutions |
||||||||||||||
|
Preferred Stock (186,777 shares) |
154 | 260 | |||||||||||||
|
Warrants (952,500 equivalent shares; Expiration — June 15, 2022; Strike price — $0.001 per share) |
1,071 | 1,190 | |||||||||||||
| | | | | | | | | | | | | | | | | |
|
1,225 | 1,450 | ||||||||||||||
| | | | | | | | | | | | | | | | | |
Subtotal Non-Control/Non-Affiliate Investments (80.7% of net assets at fair value) |
$ | 1,297,587 | $ | 1,239,316 | ||||||||||||
| | | | | | | | | | | | | | | | | |
Total Portfolio Investments, December 31, 2019 |
$ | 2,427,718 | $ | 2,602,324 | ||||||||||||
| | | | | | | | | | | | | | | | | |
| | | | | | | | | | | | | | | | | |
| | | | | | | | | | | | | | | | | |
111
MAIN STREET CAPITAL CORPORATION
Consolidated Schedule of Investments — (Continued)
December 31, 2019
(dollars in thousands)
112
MAIN STREET CAPITAL CORPORATION
Consolidated Schedule of Investments
December 31, 2018
(dollars in thousands)
| Portfolio Company(1)(20) |
Investment Date(26) |
Business Description |
Type of Investment(2)(3)(25) |
Principal(4) |
Cost(4) |
Fair Value(18) |
||||||||||
|---|---|---|---|---|---|---|---|---|---|---|---|---|---|---|---|---|
Control Investments(5) |
|
|
||||||||||||||
|
||||||||||||||||
Access Media Holdings, LLC(10) |
July 22, 2015 | Private Cable Operator |
||||||||||||||
|
10% PIK Secured Debt (Maturity — July 22, 2020)(14)(19) |
$ | 23,828 | $ | 23,828 | $ | 8,558 | |||||||||
|
Preferred Member Units (9,481,500 units)(27) |
9,375 | (284 | ) | ||||||||||||
|
Member Units (45 units) |
1 | — | |||||||||||||
| | | | | | | | | | | | | | | | | |
|
33,204 | 8,274 | ||||||||||||||
|
||||||||||||||||
ASC Interests, LLC |
August 1, 2013 | Recreational and Educational Shooting Facility |
||||||||||||||
|
11% Secured Debt (Maturity — July 31, 2020) |
1,650 | 1,622 | 1,622 | ||||||||||||
|
Member Units (1,500 units) |
1,500 | 1,370 | |||||||||||||
| | | | | | | | | | | | | | | | | |
|
3,122 | 2,992 | ||||||||||||||
|
||||||||||||||||
ATS Workholding, LLC(10) |
March 10, 2014 | Manufacturer of Machine Cutting Tools and Accessories |
||||||||||||||
|
5% Secured Debt (Maturity — November 16, 2021) |
4,877 | 4,507 | 4,390 | ||||||||||||
|
Preferred Member Units (3,725,862 units) |
3,726 | 3,726 | |||||||||||||
| | | | | | | | | | | | | | | | | |
|
8,233 | 8,116 | ||||||||||||||
|
||||||||||||||||
Bond-Coat, Inc. |
December 28, 2012 | Casing and Tubing Coating Services |
||||||||||||||
|
12% Secured Debt (Maturity — December 28, 2020) |
11,596 | 11,367 | 11,596 | ||||||||||||
|
Common Stock (57,508 shares) |
6,350 | 9,370 | |||||||||||||
| | | | | | | | | | | | | | | | | |
|
17,717 | 20,966 | ||||||||||||||
|
||||||||||||||||
Brewer Crane Holdings, LLC |
January 9, 2018 | Provider of Crane Rental and Operating Services |
||||||||||||||
|
LIBOR Plus 10.00% (Floor 1.00%), Current Coupon 12.35%, Secured Debt (Maturity — January 9, 2023)(9) |
9,548 | 9,467 | 9,467 | ||||||||||||
|
Preferred Member Units (2,950 units)(8) |
4,280 | 4,280 | |||||||||||||
| | | | | | | | | | | | | | | | | |
|
13,747 | 13,747 | ||||||||||||||
|
||||||||||||||||
Café Brazil, LLC |
April 20, 2004 | Casual Restaurant Group |
||||||||||||||
|
Member Units (1,233 units)(8) |
1,742 | 4,780 | |||||||||||||
|
||||||||||||||||
California Splendor Holdings LLC |
March 30, 2018 | Processor of Frozen Fruits |
||||||||||||||
|
LIBOR Plus 8.00% (Floor 1.00%), Current Coupon 10.50%, Secured Debt (Maturity — March 30, 2023)(9) |
11,091 | 10,928 | 10,928 | ||||||||||||
|
LIBOR Plus 10.00% (Floor 1.00%), Current Coupon 12.50%, Secured Debt (Maturity — March 30, 2023)(9) |
28,000 | 27,755 | 27,755 | ||||||||||||
|
Preferred Member Units (6,157 units)(8) |
10,775 | 9,745 | |||||||||||||
| | | | | | | | | | | | | | | | | |
|
49,458 | 48,428 | ||||||||||||||
|
||||||||||||||||
113
MAIN STREET CAPITAL CORPORATION
Consolidated Schedule of Investments — (Continued)
December 31, 2018
(dollars in thousands)
| Portfolio Company(1)(20) |
Investment Date(26) |
Business Description |
Type of Investment(2)(3)(25) |
Principal(4) |
Cost(4) |
Fair Value(18) |
||||||||||
|---|---|---|---|---|---|---|---|---|---|---|---|---|---|---|---|---|
CBT Nuggets, LLC |
June 1, 2006 | Produces and Sells IT Training Certification Videos |
||||||||||||||
|
Member Units (416 units)(8) |
1,300 | 61,610 | |||||||||||||
|
||||||||||||||||
Chamberlin Holding LLC |
February 26, 2018 | Roofing and Waterproofing Specialty Contractor |
||||||||||||||
|
LIBOR Plus 10.00% (Floor 1.00%), Current Coupon 12.75%, Secured Debt (Maturity — February 26, 2023)(9) |
20,203 | 20,028 | 20,028 | ||||||||||||
|
Member Units (4,347 units)(8) |
11,440 | 18,940 | |||||||||||||
|
Member Units (Chamberlin Langfield Real Estate, LLC) (732,160 units) |
732 | 732 | |||||||||||||
| | | | | | | | | | | | | | | | | |
|
32,200 | 39,700 | ||||||||||||||
|
||||||||||||||||
Charps, LLC |
February 3, 2017 | Pipeline Maintenance and Construction |
||||||||||||||
|
12% Secured Debt (Maturity — February 3, 2022) |
11,900 | 11,805 | 11,888 | ||||||||||||
|
Preferred Member Units (1,600 units)(8) |
400 | 2,270 | |||||||||||||
| | | | | | | | | | | | | | | | | |
|
12,205 | 14,158 | ||||||||||||||
|
||||||||||||||||
Clad-Rex Steel, LLC |
December 20, 2016 | Specialty Manufacturer of Vinyl-Clad Metal |
||||||||||||||
|
LIBOR Plus 9.00% (Floor 1.00%), Current Coupon 11.35%, Secured Debt (Maturity — December 20, 2021)(9) |
12,080 | 12,001 | 12,080 | ||||||||||||
|
Member Units (717 units)(8) |
7,280 | 10,610 | |||||||||||||
|
10% Secured Debt (Clad-Rex Steel RE Investor, LLC) (Maturity — December 20, 2036) |
1,161 | 1,150 | 1,161 | ||||||||||||
|
Member Units (Clad-Rex Steel RE Investor, LLC) (800 units) |
210 | 350 | |||||||||||||
| | | | | | | | | | | | | | | | | |
|
20,641 | 24,201 | ||||||||||||||
|
||||||||||||||||
CMS Minerals Investments |
January 30, 2015 | Oil & Gas Exploration & Production |
||||||||||||||
|
Member Units (CMS Minerals II, LLC) (100 units)(8) |
2,707 | 2,580 | |||||||||||||
|
||||||||||||||||
Copper Trail Fund Investments(12)(13) |
July 17, 2017 | Investment Partnership |
||||||||||||||
|
LP Interests (CTMH, LP) (Fully diluted 38.8%) |
872 | 872 | |||||||||||||
|
LP Interests (Copper Trail Energy Fund I, LP) (Fully diluted 30.1%)(8) |
3,495 | 4,170 | |||||||||||||
| | | | | | | | | | | | | | | | | |
|
4,367 | 5,042 | ||||||||||||||
|
||||||||||||||||
Datacom, LLC |
May 30, 2014 | Technology and Telecommunications Provider |
||||||||||||||
|
8% Secured Debt (Maturity — May 30, 2019)(14) |
1,800 | 1,800 | 1,690 | ||||||||||||
|
10.50% PIK Secured Debt (Maturity — May 30, 2019)(14)(19) |
12,511 | 12,479 | 9,786 | ||||||||||||
|
Class A Preferred Member Units |
1,294 | — | |||||||||||||
|
Class B Preferred Member Units (6,453 units) |
6,030 | — | |||||||||||||
| | | | | | | | | | | | | | | | | |
|
21,603 | 11,476 | ||||||||||||||
|
||||||||||||||||
114
MAIN STREET CAPITAL CORPORATION
Consolidated Schedule of Investments — (Continued)
December 31, 2018
(dollars in thousands)
| Portfolio Company(1)(20) |
Investment Date(26) |
Business Description |
Type of Investment(2)(3)(25) |
Principal(4) |
Cost(4) |
Fair Value(18) |
||||||||||
|---|---|---|---|---|---|---|---|---|---|---|---|---|---|---|---|---|
Digital Products Holdings LLC |
April 1, 2018 | Designer and Distributor of Consumer Electronics |
||||||||||||||
|
LIBOR Plus 10.00% (Floor 1.00%), Current Coupon 12.38%, Secured Debt (Maturity — April 1, 2023)(9) |
25,740 | 25,511 | 25,511 | ||||||||||||
|
Preferred Member Units (3,451 shares)(8) |
8,466 | 8,466 | |||||||||||||
| | | | | | | | | | | | | | | | | |
|
33,977 | 33,977 | ||||||||||||||
|
||||||||||||||||
Direct Marketing Solutions, Inc. |
February 13, 2018 | Provider of Omni-Channel Direct Marketing Services |
||||||||||||||
|
LIBOR Plus 11.00% (Floor 1.00%), Current Coupon 13.38%, Secured Debt (Maturity — February 13, 2023)(9) |
18,017 | 17,848 | 17,848 | ||||||||||||
|
Preferred Stock (8,400 shares) |
8,400 | 14,900 | |||||||||||||
| | | | | | | | | | | | | | | | | |
|
26,248 | 32,748 | ||||||||||||||
|
||||||||||||||||
Gamber-Johnson Holdings, LLC |
June 24, 2016 | Manufacturer of Ruggedized Computer Mounting Systems |
||||||||||||||
|
LIBOR Plus 7.50% (Floor 2.00%), Current Coupon 9.85%, Secured Debt (Maturity — June 24, 2021)(9) |
21,486 | 21,356 | 21,486 | ||||||||||||
|
Member Units (8,619 units)(8) |
14,844 | 45,460 | |||||||||||||
| | | | | | | | | | | | | | | | | |
|
36,200 | 66,946 | ||||||||||||||
|
||||||||||||||||
Garreco, LLC |
July 15, 2013 | Manufacturer and Supplier of Dental Products |
||||||||||||||
|
LIBOR Plus 8.00% (Floor 1.00%, Ceiling 1.50%), Current Coupon 9.50%, Secured Debt (Maturity — March 31, 2020)(9) |
5,121 | 5,099 | 5,099 | ||||||||||||
|
Member Units (1,200 units) |
1,200 | 2,590 | |||||||||||||
| | | | | | | | | | | | | | | | | |
|
6,299 | 7,689 | ||||||||||||||
GRT Rubber Technologies LLC |
December 19, 2014 | Manufacturer of Engineered Rubber Products |
||||||||||||||
|
LIBOR Plus 7.00%, Current Coupon 9.35%, Secured Debt (Maturity — December 31, 2023)(9) |
9,740 | 9,716 | 9,740 | ||||||||||||
|
Member Units (5,879 units)(8) |
13,065 | 39,060 | |||||||||||||
| | | | | | | | | | | | | | | | | |
|
22,781 | 48,800 | ||||||||||||||
|
||||||||||||||||
Guerdon Modular Holdings, Inc. |
August 13, 2014 | Multi-Family and Commercial Modular Construction Company |
||||||||||||||
|
13% Secured Debt (Maturity — March 1, 2019) |
12,588 | 12,572 | 12,002 | ||||||||||||
|
Preferred Stock (404,998 shares) |
1,140 | — | |||||||||||||
|
Common Stock (212,033 shares) |
2,983 | — | |||||||||||||
|
Warrants (6,208,877 equivalent shares; Expiration — April 25, 2028; Strike price — $0.01 per unit) |
— | — | |||||||||||||
| | | | | | | | | | | | | | | | | |
|
16,695 | 12,002 | ||||||||||||||
|
||||||||||||||||
115
MAIN STREET CAPITAL CORPORATION
Consolidated Schedule of Investments — (Continued)
December 31, 2018
(dollars in thousands)
| Portfolio Company(1)(20) |
Investment Date(26) |
Business Description |
Type of Investment(2)(3)(25) |
Principal(4) |
Cost(4) |
Fair Value(18) |
||||||||||
|---|---|---|---|---|---|---|---|---|---|---|---|---|---|---|---|---|
Gulf Manufacturing, LLC |
August 31, 2007 | Manufacturer of Specialty Fabricated Industrial Piping Products |
||||||||||||||
|
Member Units (438 units)(8) |
2,980 | 11,690 | |||||||||||||
|
||||||||||||||||
Gulf Publishing Holdings, LLC |
April 29, 2016 | Energy Industry Focused Media and Publishing |
||||||||||||||
|
12.5% Secured Debt (Maturity — April 29, 2021) |
12,666 | 12,594 | 12,594 | ||||||||||||
|
Member Units (3,681 units) |
3,681 | 4,120 | |||||||||||||
| | | | | | | | | | | | | | | | | |
|
16,275 | 16,714 | ||||||||||||||
|
||||||||||||||||
Harborside Holdings, LLC |
March 20, 2017 | Real Estate Holding Company |
||||||||||||||
|
Member units (100 units) |
6,306 | 9,500 | |||||||||||||
|
||||||||||||||||
Harris Preston Fund Investments(12)(13) |
October 1, 2017 | Investment Partnership |
||||||||||||||
|
LP Interests (2717 MH, L.P.) (Fully diluted 49.3%) |
1,040 | 1,133 | |||||||||||||
|
||||||||||||||||
Harrison Hydra-Gen, Ltd. |
June 4, 2010 | Manufacturer of Hydraulic Generators |
||||||||||||||
|
Common Stock (107,456 shares)(8) |
718 | 8,070 | |||||||||||||
|
||||||||||||||||
HW Temps LLC |
July 2, 2015 | Temporary Staffing Solutions |
||||||||||||||
|
LIBOR Plus 13.00% (Floor 1.00%), Current Coupon 15.35%, Secured Debt (Maturity July 2, 2020)(9) |
9,976 | 9,938 | 9,938 | ||||||||||||
|
Preferred Member Units (3,200 units)(8) |
3,942 | 3,942 | |||||||||||||
| | | | | | | | | | | | | | | | | |
|
13,880 | 13,880 | ||||||||||||||
|
||||||||||||||||
IDX Broker, LLC |
November 15, 2013 | Provider of Marketing and CRM Tools for the Real Estate Industry |
||||||||||||||
|
11.5% Secured Debt (Maturity — November 15, 2020) |
14,350 | 14,262 | 14,350 | ||||||||||||
|
Preferred Member Units (5,607 units)(8) |
5,952 | 13,520 | |||||||||||||
| | | | | | | | | | | | | | | | | |
|
20,214 | 27,870 | ||||||||||||||
|
||||||||||||||||
Jensen Jewelers of Idaho, LLC |
November 14, 2006 | Retail Jewelry Store |
||||||||||||||
|
Prime Plus 6.75% (Floor 2.00%), Current Coupon 12.00%, Secured Debt (Maturity — November 14, 2019)(9) |
3,355 | 3,337 | 3,355 | ||||||||||||
|
Member Units (627 units)(8) |
811 | 5,090 | |||||||||||||
| | | | | | | | | | | | | | | | | |
|
4,148 | 8,445 | ||||||||||||||
|
||||||||||||||||
KBK Industries, LLC |
January 23, 2006 | Manufacturer of Specialty Oilfield and Industrial Products |
||||||||||||||
|
Member Units (325 units)(8) |
783 | 8,610 | |||||||||||||
|
||||||||||||||||
116
MAIN STREET CAPITAL CORPORATION
Consolidated Schedule of Investments — (Continued)
December 31, 2018
(dollars in thousands)
| Portfolio Company(1)(20) |
Investment Date(26) |
Business Description |
Type of Investment(2)(3)(25) |
Principal(4) |
Cost(4) |
Fair Value(18) |
||||||||||
|---|---|---|---|---|---|---|---|---|---|---|---|---|---|---|---|---|
Kickhaefer Manufacturing Company, LLC |
October 31, 2018 | Precision Metal Parts Manufacturing |
||||||||||||||
|
11.5% Secured Debt (Maturity — October 31, 2020) |
1,064 | 1,045 | 1,045 | ||||||||||||
|
11.5% Secured Debt (Maturity — October 31, 2023) |
28,000 | 27,730 | 27,730 | ||||||||||||
|
Member Units (581 units) |
12,240 | 12,240 | |||||||||||||
|
9.0% Secured Debt (Maturity — October 31, 2048) |
4,006 | 3,970 | 3,970 | ||||||||||||
|
Member Units (KMC RE Investor, LLC) (800 units) |
992 | 992 | |||||||||||||
| | | | | | | | | | | | | | | | | |
|
45,977 | 45,977 | ||||||||||||||
|
||||||||||||||||
Lamb Ventures, LLC |
May 30, 2008 | Aftermarket Automotive Services Chain |
||||||||||||||
|
11% Secured Debt (Maturity — July 1, 2022) |
8,339 | 8,306 | 8,339 | ||||||||||||
|
Preferred Stock (non-voting) |
400 | 400 | |||||||||||||
|
Member Units (742 units) |
5,273 | 7,440 | |||||||||||||
|
9.5% Secured Debt (Lamb's Real Estate Investment I, LLC) (Maturity — March 31, 2027) |
432 | 428 | 432 | ||||||||||||
|
Member Units (Lamb's Real Estate Investment I, LLC) (1,000 units)(8) |
625 | 630 | |||||||||||||
| | | | | | | | | | | | | | | | | |
|
15,032 | 17,241 | ||||||||||||||
|
||||||||||||||||
Market Force Information, LLC |
July 28, 2017 | Provider of Customer Experience Management Services |
||||||||||||||
|
LIBOR Plus 7.00% (Floor 1.00%), Current Coupon 9.74%, Secured Debt (Maturity — July 28, 2022)(9) |
200 | 200 | 200 | ||||||||||||
|
LIBOR Plus 11.00% (Floor 1.00%), Current Coupon 13.74%, Secured Debt (Maturity — July 28, 2022)(9) |
22,800 | 22,624 | 22,624 | ||||||||||||
|
Member Units (657,113 units) |
14,700 | 13,100 | |||||||||||||
| | | | | | | | | | | | | | | | | |
|
37,524 | 35,924 | ||||||||||||||
|
||||||||||||||||
MH Corbin Holding LLC |
August 31, 2015 | Manufacturer and Distributor of Traffic Safety Products |
||||||||||||||
|
10% Current / 3% PIK Secured Debt (Maturity — August 31, 2020)(14)(19) |
12,263 | 12,121 | 11,733 | ||||||||||||
|
Preferred Member Units (4,000 shares) |
6,000 | 1,000 | |||||||||||||
| | | | | | | | | | | | | | | | | |
|
18,121 | 12,733 | ||||||||||||||
|
||||||||||||||||
Mid-Columbia Lumber Products, LLC |
December 18, 2006 | Manufacturer of Finger-Jointed Lumber Products |
||||||||||||||
|
10% Secured Debt (Maturity — January 15, 2020) |
1,750 | 1,746 | 1,746 | ||||||||||||
|
12% Secured Debt (Maturity — January 15, 2020) |
3,900 | 3,880 | 3,880 | ||||||||||||
|
Member Units (7,874 units) |
3,001 | 3,860 | |||||||||||||
|
9.5% Secured Debt (Mid-Columbia Real Estate, LLC) (Maturity — May 13, 2025) |
746 | 746 | 746 | ||||||||||||
|
Member Units (Mid-Columbia Real Estate, LLC) (500 units)(8) |
790 | 1,470 | |||||||||||||
| | | | | | | | | | | | | | | | | |
|
10,163 | 11,702 | ||||||||||||||
|
||||||||||||||||
117
MAIN STREET CAPITAL CORPORATION
Consolidated Schedule of Investments — (Continued)
December 31, 2018
(dollars in thousands)
| Portfolio Company(1)(20) |
Investment Date(26) |
Business Description |
Type of Investment(2)(3)(25) |
Principal(4) |
Cost(4) |
Fair Value(18) |
||||||||||
|---|---|---|---|---|---|---|---|---|---|---|---|---|---|---|---|---|
MSC Adviser I, LLC(16) |
November 22, 2013 | Third Party Investment Advisory Services |
||||||||||||||
|
Member Units (Fully diluted 100.0%)(8) |
— | 65,748 | |||||||||||||
|
||||||||||||||||
Mystic Logistics Holdings, LLC |
August 18, 2014 | Logistics and Distribution Services Provider for Large Volume Mailers |
||||||||||||||
|
12% Secured Debt (Maturity — August 15, 2019) |
7,536 | 7,506 | 7,506 | ||||||||||||
|
Common Stock (5,873 shares) |
2,720 | 210 | |||||||||||||
| | | | | | | | | | | | | | | | | |
|
10,226 | 7,716 | ||||||||||||||
|
||||||||||||||||
NAPCO Precast, LLC |
January 31, 2008 | Precast Concrete Manufacturing |
||||||||||||||
|
LIBOR Plus 8.50%, Current Coupon 11.24%, Secured Debt (Maturity — May 31, 2019) |
11,475 | 11,464 | 11,475 | ||||||||||||
|
Member Units (2,955 units)(8) |
2,975 | 13,990 | |||||||||||||
| | | | | | | | | | | | | | | | | |
|
14,439 | 25,465 | ||||||||||||||
|
||||||||||||||||
NexRev LLC |
February 28, 2018 | Provider of Energy Efficiency Products & Services |
||||||||||||||
|
11% Secured Debt (Maturity — February 28, 2023) |
17,440 | 17,288 | 17,288 | ||||||||||||
|
Preferred Member Units (86,400,000 units)(8) |
6,880 | 7,890 | |||||||||||||
| | | | | | | | | | | | | | | | | |
|
24,168 | 25,178 | ||||||||||||||
|
||||||||||||||||
NRI Clinical Research, LLC |
September 8, 2011 | Clinical Research Service Provider |
||||||||||||||
|
14% Secured Debt (Maturity — June 8, 2022) |
6,685 | 6,545 | 6,685 | ||||||||||||
|
Warrants (251,723 equivalent units; Expiration — June 8, 2027; Strike price — $0.01 per unit) |
252 | 660 | |||||||||||||
|
Member Units (1,454,167 units) |
765 | 2,478 | |||||||||||||
| | | | | | | | | | | | | | | | | |
|
7,562 | 9,823 | ||||||||||||||
|
||||||||||||||||
NRP Jones, LLC |
December 22, 2011 | Manufacturer of Hoses, Fittings and Assemblies |
||||||||||||||
|
12% Secured Debt (Maturity — March 20, 2023) |
6,376 | 6,376 | 6,376 | ||||||||||||
|
Member Units (65,962 units) |
3,717 | 5,960 | |||||||||||||
| | | | | | | | | | | | | | | | | |
|
10,093 | 12,336 | ||||||||||||||
|
||||||||||||||||
NuStep, LLC |
January 31, 2017 | Designer, Manufacturer and Distributor of Fitness Equipment |
||||||||||||||
|
12% Secured Debt (Maturity — January 31, 2022) |
20,600 | 20,458 | 20,458 | ||||||||||||
|
Preferred Member Units (406 units) |
10,200 | 10,200 | |||||||||||||
| | | | | | | | | | | | | | | | | |
|
30,658 | 30,658 | ||||||||||||||
|
||||||||||||||||
OMi Holdings, Inc. |
April 1, 2008 | Manufacturer of Overhead Cranes |
||||||||||||||
|
Common Stock (1,500 shares)(8) |
1,080 | 16,020 | |||||||||||||
|
||||||||||||||||
Pegasus Research Group, LLC |
January 6, 2011 | Provider of Telemarketing and Data Services |
||||||||||||||
|
Member Units (460 units) |
1,290 | 7,680 | |||||||||||||
|
||||||||||||||||
118
MAIN STREET CAPITAL CORPORATION
Consolidated Schedule of Investments — (Continued)
December 31, 2018
(dollars in thousands)
| Portfolio Company(1)(20) |
Investment Date(26) |
Business Description |
Type of Investment(2)(3)(25) |
Principal(4) |
Cost(4) |
Fair Value(18) |
||||||||||
|---|---|---|---|---|---|---|---|---|---|---|---|---|---|---|---|---|
PPL RVs, Inc. |
June 10, 2010 | Recreational Vehicle Dealer |
||||||||||||||
|
LIBOR Plus 7.00% (Floor 0.50%), Current Coupon 9.40%, Secured Debt (Maturity — November 15, 2021)(9) |
15,100 | 15,006 | 15,100 | ||||||||||||
|
Common Stock (1,962 shares)(8) |
2,150 | 10,380 | |||||||||||||
| | | | | | | | | | | | | | | | | |
|
17,156 | 25,480 | ||||||||||||||
|
||||||||||||||||
Principle Environmental, LLC (d/b/a TruHorizon Environmental Solutions) |
February 1, 2011 | Noise Abatement Service Provider |
||||||||||||||
|
13% Secured Debt (Maturity — April 30, 2020) |
7,477 | 7,398 | 7,477 | ||||||||||||
|
Preferred Member Units (19,631 units)(8) |
4,600 | 13,090 | |||||||||||||
|
Warrants (1,018 equivalent units; Expiration — January 31, 2021; Strike price — $0.01 per unit) |
1,200 | 780 | |||||||||||||
| | | | | | | | | | | | | | | | | |
|
13,198 | 21,347 | ||||||||||||||
|
||||||||||||||||
Quality Lease Service, LLC |
June 8, 2015 | Provider of Rigsite Accommodation Unit Rentals and Related Services |
||||||||||||||
|
Zero Coupon Secured Debt (Maturity — June 8, 2021) |
7,341 | 7,341 | 6,450 | ||||||||||||
|
Member Units (1,000 units) |
4,043 | 3,809 | |||||||||||||
| | | | | | | | | | | | | | | | | |
|
11,384 | 10,259 | ||||||||||||||
|
||||||||||||||||
River Aggregates, LLC |
March 30, 2011 | Processor of Construction Aggregates |
||||||||||||||
|
Zero Coupon Secured Debt (Maturity — June 30, 2018)(17) |
750 | 750 | 722 | ||||||||||||
|
Member Units (1,150 units) |
1,150 | 4,610 | |||||||||||||
|
Member Units (RA Properties, LLC) (1,500 units) |
369 | 2,930 | |||||||||||||
| | | | | | | | | | | | | | | | | |
|
2,269 | 8,262 | ||||||||||||||
|
||||||||||||||||
Tedder Industries, LLC |
August 31, 2018 | Manufacturer of Firearm Holsters and Accessories |
||||||||||||||
|
12% Secured Debt (Maturity — August 31, 2020) |
480 | 480 | 480 | ||||||||||||
|
12% Secured Debt (Maturity — August 31, 2023) |
16,400 | 16,246 | 16,246 | ||||||||||||
|
Preferred Member Units (440 units) |
7,476 | 7,476 | |||||||||||||
| | | | | | | | | | | | | | | | | |
|
24,202 | 24,202 | ||||||||||||||
|
||||||||||||||||
The MPI Group, LLC |
October 2, 2007 | Manufacturer of Custom Hollow Metal Doors, Frames and Accessories |
||||||||||||||
|
9% Secured Debt (Maturity — October 2, 2019) |
2,924 | 2,924 | 2,582 | ||||||||||||
|
Series A Preferred Units (2,500 units) |
2,500 | 440 | |||||||||||||
|
Warrants (1,424 equivalent units; Expiration — July 1, 2024; Strike price — $0.01 per unit) |
1,096 | — | |||||||||||||
|
Member Units (MPI Real Estate Holdings, LLC) (100 units)(8) |
2,300 | 2,479 | |||||||||||||
| | | | | | | | | | | | | | | | | |
|
8,820 | 5,501 | ||||||||||||||
|
||||||||||||||||
119
MAIN STREET CAPITAL CORPORATION
Consolidated Schedule of Investments — (Continued)
December 31, 2018
(dollars in thousands)
| Portfolio Company(1)(20) |
Investment Date(26) |
Business Description |
Type of Investment(2)(3)(25) |
Principal(4) |
Cost(4) |
Fair Value(18) |
||||||||||
|---|---|---|---|---|---|---|---|---|---|---|---|---|---|---|---|---|
Vision Interests, Inc. |
June 5, 2007 | Manufacturer / Installer of Commercial Signage |
||||||||||||||
|
13% Secured Debt (Maturity — December 23, 2018)(17) |
2,153 | 2,153 | 2,153 | ||||||||||||
|
Series A Preferred Stock (3,000,000 shares) |
3,000 | 3,740 | |||||||||||||
|
Common Stock (1,126,242 shares) |
3,706 | 280 | |||||||||||||
| | | | | | | | | | | | | | | | | |
|
8,859 | 6,173 | ||||||||||||||
|
||||||||||||||||
Ziegler's NYPD, LLC |
October 1, 2008 | Casual Restaurant Group |
||||||||||||||
|
6.5% Secured Debt (Maturity — October 1, 2019) |
1,000 | 998 | 1,000 | ||||||||||||
|
12% Secured Debt (Maturity — October 1, 2019) |
425 | 425 | 425 | ||||||||||||
|
14% Secured Debt (Maturity — October 1, 2019) |
2,750 | 2,750 | 2,750 | ||||||||||||
|
Warrants (587 equivalent units; Expiration — October 1, 2019; Strike price — $0.01 per unit) |
600 | — | |||||||||||||
|
Preferred Member Units (10,072 units) |
2,834 | 1,249 | |||||||||||||
| | | | | | | | | | | | | | | | | |
|
7,607 | 5,424 | ||||||||||||||
| | | | | | | | | | | | | | | | | |
Subtotal Control Investments (68.1% of net assets at fair value) |
$ | 750,618 | $ | 1,004,993 | ||||||||||||
| | | | | | | | | | | | | | | | | |
120
MAIN STREET CAPITAL CORPORATION
Consolidated Schedule of Investments — (Continued)
December 31, 2018
(dollars in thousands)
| Portfolio Company(1)(20) |
Investment Date(26) |
Business Description |
Type of Investment(2)(3)(25) |
Principal(4) |
Cost(4) |
Fair Value(18) |
||||||||||
|---|---|---|---|---|---|---|---|---|---|---|---|---|---|---|---|---|
Affiliate Investments(6) |
|
|
|
|||||||||||||
|
||||||||||||||||
AFG Capital Group, LLC |
November 7, 2014 |
Provider of Rent-to-Own Financing Solutions and Services |
||||||||||||||
|
Warrants (42 equivalent units; Expiration — November 7, 2024; Strike price — $0.01 per unit) |
$ | 259 | $ | 950 | |||||||||||
|
Preferred Member Units (186 units)(8) |
1,200 | 3,980 | |||||||||||||
| | | | | | | | | | | | | | | | | |
|
1,459 | 4,930 | ||||||||||||||
|
||||||||||||||||
Barfly Ventures, LLC(10) |
August 31, 2015 |
Casual Restaurant Group |
||||||||||||||
|
12% Secured Debt (Maturity — August 31, 2020) |
10,185 | 10,039 | 10,018 | ||||||||||||
|
Options (3 equivalent units) |
607 | 940 | |||||||||||||
|
Warrant (1 equivalent unit; Expiration — August 31, 2025; Strike price — $1.00 per unit) |
473 | 410 | |||||||||||||
| | | | | | | | | | | | | | | | | |
|
11,119 | 11,368 | ||||||||||||||
|
||||||||||||||||
BBB Tank Services, LLC |
April 8, 2016 |
Maintenance, Repair and Construction Services to the Above-Ground Storage Tank Market |
||||||||||||||
|
LIBOR Plus 11.00% (Floor 1.00%), Current Coupon 13.35%, (Maturity — April 8, 2021)(9) |
4,000 | 3,833 | 3,833 | ||||||||||||
|
Preferred Stock (non-voting) |
113 | 113 | |||||||||||||
|
Member Units (800,000 units) |
800 | 230 | |||||||||||||
| | | | | | | | | | | | | | | | | |
|
4,746 | 4,176 | ||||||||||||||
|
||||||||||||||||
Boccella Precast Products LLC |
June 30, 2017 |
Manufacturer of Precast Hollow Core Concrete |
||||||||||||||
|
LIBOR Plus 10.00% (Floor 1.00%), Current Coupon 12.40%, Secured Debt (Maturity — June 30, 2022)(9) |
15,724 | 15,512 | 15,724 | ||||||||||||
|
Member Units (2,160,000 units)(8) |
2,160 | 5,080 | |||||||||||||
| | | | | | | | | | | | | | | | | |
|
17,672 | 20,804 | ||||||||||||||
|
||||||||||||||||
Boss Industries, LLC |
July 1, 2014 |
Manufacturer and Distributor of Air, Power and Other Industrial Equipment |
||||||||||||||
|
Preferred Member Units (2,242 units)(8) |
2,246 | 6,176 | |||||||||||||
|
||||||||||||||||
121
MAIN STREET CAPITAL CORPORATION
Consolidated Schedule of Investments — (Continued)
December 31, 2018
(dollars in thousands)
| Portfolio Company(1)(20) |
Investment Date(26) |
Business Description |
Type of Investment(2)(3)(25) |
Principal(4) |
Cost(4) |
Fair Value(18) |
||||||||||
|---|---|---|---|---|---|---|---|---|---|---|---|---|---|---|---|---|
Bridge Capital Solutions Corporation |
April 18, 2012 |
Financial Services and Cash Flow Solutions Provider |
||||||||||||||
|
13% Secured Debt (Maturity — July 25, 2021) |
7,500 | 6,221 | 6,221 | ||||||||||||
|
Warrants (82 equivalent shares; Expiration — July 25, 2026; Strike price — $0.01 per share) |
2,132 | 4,020 | |||||||||||||
|
13% Secured Debt (Mercury Service Group, LLC) (Maturity — July 25, 2021) |
1,000 | 994 | 1,000 | ||||||||||||
|
Preferred Member Units (Mercury Service Group, LLC) (17,742 units)(8) |
1,000 | 1,000 | |||||||||||||
| | | | | | | | | | | | | | | | | |
|
10,347 | 12,241 | ||||||||||||||
|
||||||||||||||||
Buca C, LLC |
June 30, 2015 |
Casual Restaurant Group |
||||||||||||||
|
LIBOR Plus 9.25% (Floor 1.00%), Current Coupon 11.63%, Secured Debt (Maturity — June 30, 2020)(9) |
19,104 | 19,038 | 19,038 | ||||||||||||
|
Preferred Member Units (6 units; 6% cumulative)(8)(19) |
4,431 | 4,431 | |||||||||||||
| | | | | | | | | | | | | | | | | |
|
23,469 | 23,469 | ||||||||||||||
|
||||||||||||||||
CAI Software LLC |
October 10, 2014 |
Provider of Specialized Enterprise Resource Planning Software |
||||||||||||||
|
12% Secured Debt (Maturity — December 7, 2023) |
10,880 | 10,763 | 10,880 | ||||||||||||
|
Member Units (66,968 units)(8) |
751 | 2,717 | |||||||||||||
| | | | | | | | | | | | | | | | | |
|
11,514 | 13,597 | ||||||||||||||
|
||||||||||||||||
Chandler Signs Holdings, LLC(10) |
January 4, 2016 |
Sign Manufacturer |
||||||||||||||
|
12% Current / 1% PIK Secured Deb (Maturity — July 4, 2021)(19) |
4,546 | 4,522 | 4,546 | ||||||||||||
|
Class A Units (1,500,000 units)(8) |
1,500 | 2,120 | |||||||||||||
| | | | | | | | | | | | | | | | | |
|
6,022 | 6,666 | ||||||||||||||
|
||||||||||||||||
Charlotte Russe, Inc(11) |
May 28, 2013 |
Fast-Fashion Retailer to Young Women |
||||||||||||||
|
8.50% Secured Debt (Maturity — February 2, 2023) |
7,932 | 7,932 | 3,930 | ||||||||||||
|
Common Stock (19,041 shares) |
3,141 | — | |||||||||||||
| | | | | | | | | | | | | | | | | |
|
11,073 | 3,930 | ||||||||||||||
|
||||||||||||||||
Condit Exhibits, LLC |
July 1, 2008 |
Tradeshow Exhibits / Custom Displays Provider |
||||||||||||||
|
Member Units (3,936 units)(8) |
100 | 1,950 | |||||||||||||
|
||||||||||||||||
122
MAIN STREET CAPITAL CORPORATION
Consolidated Schedule of Investments — (Continued)
December 31, 2018
(dollars in thousands)
| Portfolio Company(1)(20) |
Investment Date(26) |
Business Description |
Type of Investment(2)(3)(25) |
Principal(4) |
Cost(4) |
Fair Value(18) |
||||||||||
|---|---|---|---|---|---|---|---|---|---|---|---|---|---|---|---|---|
Congruent Credit Opportunities Funds(12)(13) |
January 24, 2012 |
Investment Partnership |
||||||||||||||
|
LP Interests (Congruent Credit Opportunities Fund II, LP) (Fully diluted 19.8%) |
5,210 | 855 | |||||||||||||
|
LP Interests (Congruent Credit Opportunities Fund III, LP) (Fully diluted 17.4%)(8) |
16,959 | 17,468 | |||||||||||||
| | | | | | | | | | | | | | | | | |
|
22,169 | 18,323 | ||||||||||||||
|
||||||||||||||||
Dos Rios Partners(12)(13) |
April 25, 2013 |
Investment Partnership |
||||||||||||||
|
LP Interests (Dos Rios Partners, LP) (Fully diluted 20.2%) |
5,846 | 7,153 | |||||||||||||
|
LP Interests (Dos Rios Partners — A, LP) (Fully diluted 6.4%) |
1,856 | 2,271 | |||||||||||||
| | | | | | | | | | | | | | | | | |
|
7,702 | 9,424 | ||||||||||||||
|
||||||||||||||||
East Teak Fine Hardwoods, Inc. |
April 13, 2006 |
Distributor of Hardwood Products |
||||||||||||||
|
Common Stock (6,250 shares)(8) |
480 | 560 | |||||||||||||
|
||||||||||||||||
EIG Fund Investments(12)(13) |
November 6, 2015 |
Investment Partnership |
||||||||||||||
|
LP Interests (EIG Global Private Debt Fund-A, L.P.) (Fully diluted 11.1%)(8) |
553 | 505 | |||||||||||||
|
||||||||||||||||
Freeport Financial Funds(12)(13) |
June 13, 2013 |
Investment Partnership |
||||||||||||||
|
LP Interests (Freeport Financial SBIC Fund LP) (Fully diluted 9.3%)(8) |
5,974 | 5,399 | |||||||||||||
|
LP Interests (Freeport First Lien Loan Fund III LP) (Fully diluted 6.0%)(8) |
11,155 | 10,980 | |||||||||||||
| | | | | | | | | | | | | | | | | |
|
17,129 | 16,379 | ||||||||||||||
|
||||||||||||||||
Harris Preston Fund Investments(12)(13) |
August 9, 2017 |
Investment Partnership |
||||||||||||||
|
LP Interests (HPEP 3, L.P.) (Fully diluted 8.2%) |
1,733 | 1,733 | |||||||||||||
|
||||||||||||||||
Hawk Ridge Systems, LLC(13) |
December 2, 2016 |
Value-Added Reseller of Engineering Design and Manufacturing Solutions |
||||||||||||||
|
10.5% Secured Debt (Maturity — December 2, 2021) |
14,300 | 14,201 | 14,300 | ||||||||||||
|
Preferred Member Units (226 units)(8) |
2,850 | 7,260 | |||||||||||||
|
Preferred Member Units (HRS Services, ULC) (226 units) |
150 | 380 | |||||||||||||
| | | | | | | | | | | | | | | | | |
|
17,201 | 21,940 | ||||||||||||||
|
||||||||||||||||
Houston Plating and Coatings, LLC |
January 8, 2003 |
Provider of Plating and Industrial Coating Services |
||||||||||||||
|
8% Unsecured Convertible Debt (Maturity — May 1, 2022) |
3,000 | 3,000 | 3,720 | ||||||||||||
|
Member Units (318,462 units)(8) |
2,236 | 8,330 | |||||||||||||
| | | | | | | | | | | | | | | | | |
|
5,236 | 12,050 | ||||||||||||||
|
||||||||||||||||
123
MAIN STREET CAPITAL CORPORATION
Consolidated Schedule of Investments — (Continued)
December 31, 2018
(dollars in thousands)
| Portfolio Company(1)(20) |
Investment Date(26) |
Business Description |
Type of Investment(2)(3)(25) |
Principal(4) |
Cost(4) |
Fair Value(18) |
||||||||||
|---|---|---|---|---|---|---|---|---|---|---|---|---|---|---|---|---|
I-45 SLF LLC(12)(13) |
October 20, 2015 |
Investment Partnership |
||||||||||||||
|
Member Units (Fully diluted 20.0%; 24.4% profits interest)(8) |
16,200 | 15,627 | |||||||||||||
|
||||||||||||||||
L.F. Manufacturing Holdings, LLC(10) |
December 23, 2013 |
Manufacturer of Fiberglass Products |
||||||||||||||
|
Member Units (2,179,001 units) |
2,019 | 2,060 | |||||||||||||
|
||||||||||||||||
Meisler Operating LLC |
June 7, 2017 |
Provider of Short-term Trailer and Container Rental |
||||||||||||||
|
LIBOR Plus 8.50% (Floor 1.00%), Current Coupon 10.90%, Secured Debt (Maturity — June 7, 2022)(9) |
20,480 | 20,312 | 20,312 | ||||||||||||
|
Member Units (Milton Meisler Holdings LLC) (48,555 units) |
4,855 | 5,780 | |||||||||||||
| | | | | | | | | | | | | | | | | |
|
25,167 | 26,092 | ||||||||||||||
|
||||||||||||||||
OnAsset Intelligence, Inc. |
April 18, 2011 |
Provider of Transportation Monitoring / Tracking Products and Services |
||||||||||||||
|
12% PIK Secured Debt (Maturity — June 30, 2021)(19) |
5,743 | 5,743 | 5,743 | ||||||||||||
|
10% PIK Unsecured Debt (Maturity — June 30, 2021)(19) |
53 | 53 | 53 | ||||||||||||
|
Preferred Stock (912 shares) |
1,981 | — | |||||||||||||
|
Warrants (5,333 equivalent shares; Expiration — April 18, 2021; Strike price — $0.01 per share) |
1,919 | — | |||||||||||||
| | | | | | | | | | | | | | | | | |
|
9,696 | 5,796 | ||||||||||||||
|
||||||||||||||||
PCI Holding Company, Inc. |
December 18, 2012 |
Manufacturer of Industrial Gas Generating Systems |
||||||||||||||
|
12% Current / 3% PIK Secured Debt (Maturity — March 31, 2019)(19) |
11,919 | 11,908 | 11,908 | ||||||||||||
|
Preferred Stock (1,740,000 shares) (non-voting) |
1,740 | 3,480 | |||||||||||||
|
Preferred Stock (1,500,000 shares) |
3,927 | 340 | |||||||||||||
| | | | | | | | | | | | | | | | | |
|
17,575 | 15,728 | ||||||||||||||
|
||||||||||||||||
Rocaceia, LLC (Quality Lease and Rental Holdings, LLC) |
January 8, 2013 |
Provider of Rigsite Accommodation Unit Rentals and Related Services |
||||||||||||||
|
12% Secured Debt (Maturity — January 8, 2018)(14)(15) |
30,785 | 30,281 | 250 | ||||||||||||
|
Preferred Member Units (250 units) |
2,500 | — | |||||||||||||
| | | | | | | | | | | | | | | | | |
|
32,781 | 250 | ||||||||||||||
|
||||||||||||||||
Salado Stone Holdings, LLC(10) |
June 27, 2016 |
Limestone and Sandstone Dimension Cut Stone Mining Quarries |
||||||||||||||
|
Class A Preferred Units (Salado Acquisition, LLC) (2,000,000 units)(8) |
2,000 | 1,040 | |||||||||||||
|
||||||||||||||||
124
MAIN STREET CAPITAL CORPORATION
Consolidated Schedule of Investments — (Continued)
December 31, 2018
(dollars in thousands)
| Portfolio Company(1)(20) |
Investment Date(26) |
Business Description |
Type of Investment(2)(3)(25) |
Principal(4) |
Cost(4) |
Fair Value(18) |
||||||||||
|---|---|---|---|---|---|---|---|---|---|---|---|---|---|---|---|---|
SI East, LLC |
August 31, 2018 |
Rigid Industrial Packaging Manufacturing |
||||||||||||||
|
10.25% Current, Secured Debt (Maturity — August 31, 2023) |
35,250 | 34,885 | 34,885 | ||||||||||||
|
Preferred Member Units (157 units) |
6,000 | 6,000 | |||||||||||||
| | | | | | | | | | | | | | | | | |
|
40,885 | 40,885 | ||||||||||||||
|
||||||||||||||||
Slick Innovations, LLC |
September 13, 2018 |
Text Message Marketing Platform |
||||||||||||||
|
14% Current, Secured Debt (Maturity — September 13, 2023) |
7,200 | 6,959 | 6,959 | ||||||||||||
|
Member Units (70,000 units) |
700 | 700 | |||||||||||||
|
Warrants (18,084 equivalent units; Expiration — September 13, 2028; Strike price — $0.01 per unit) |
181 | 181 | |||||||||||||
| | | | | | | | | | | | | | | | | |
|
7,840 | 7,840 | ||||||||||||||
|
||||||||||||||||
UniTek Global Services, Inc.(11) |
April 15, 2011 |
Provider of Outsourced Infrastructure Services |
||||||||||||||
|
LIBOR Plus 5.50% (Floor 1.00%), Current Coupon 8.01%, Secured Debt (Maturity — August 20, 2024)(9) |
2,993 | 2,969 | 2,969 | ||||||||||||
|
Preferred Stock (1,521,122 shares; 19% cumulative)(8)(19) |
1,637 | 1,637 | |||||||||||||
|
Preferred Stock (2,281,682 shares; 19% cumulative)(8)(19) |
3,038 | 3,038 | |||||||||||||
|
Preferred Stock (4,336,866 shares; 13.5% cumulative)(8)(19) |
7,413 | 7,413 | |||||||||||||
|
Common Stock (945,507 shares) |
— | 1,420 | |||||||||||||
| | | | | | | | | | | | | | | | | |
|
15,057 | 16,477 | ||||||||||||||
|
||||||||||||||||
Universal Wellhead Services Holdings, LLC(10) |
October 30, 2014 |
Provider of Wellhead Equipment, Designs, and Personnel to the Oil & Gas Industry |
||||||||||||||
|
Preferred Member Units (UWS Investments, LLC) (716,949 units; 14% cumulative)(8)(19) |
837 | 950 | |||||||||||||
|
Member Units (UWS Investments, LLC) (4,000,000 units) |
4,000 | 2,330 | |||||||||||||
| | | | | | | | | | | | | | | | | |
|
4,837 | 3,280 | ||||||||||||||
|
||||||||||||||||
125
MAIN STREET CAPITAL CORPORATION
Consolidated Schedule of Investments — (Continued)
December 31, 2018
(dollars in thousands)
| Portfolio Company(1)(20) |
Investment Date(26) |
Business Description |
Type of Investment(2)(3)(25) |
Principal(4) |
Cost(4) |
Fair Value(18) |
||||||||||
|---|---|---|---|---|---|---|---|---|---|---|---|---|---|---|---|---|
Volusion, LLC |
January 26, 2015 |
Provider of Online Software-as-a-Service eCommerce Solutions |
||||||||||||||
|
11.5% Secured Debt (Maturity — January 26, 2020) |
19,272 | 18,407 | 18,407 | ||||||||||||
|
8% Unsecured Convertible Debt (Maturity — November 16, 2023) |
297 | 297 | 297 | ||||||||||||
|
Preferred Member Units (4,876,670 units) |
14,000 | 14,000 | |||||||||||||
|
Warrants (1,831,355 equivalent units; Expiration — January 26, 2025; Strike price — $0.01 per unit) |
2,576 | 1,890 | |||||||||||||
| | | | | | | | | | | | | | | | | |
|
35,280 | 34,594 | ||||||||||||||
|
||||||||||||||||
| | | | | | | | | | | | | | | | | |
Subtotal Affiliate Investments (24.4% of net assets at fair value) |
$ | 381,307 | $ | 359,890 | ||||||||||||
| | | | | | | | | | | | | | | | | |
126
MAIN STREET CAPITAL CORPORATION
Consolidated Schedule of Investments — (Continued)
December 31, 2018
(dollars in thousands)
| Portfolio Company(1)(20) |
Investment Date(26) |
Business Description |
Type of Investment(2)(3)(25) |
Principal(4) |
Cost(4) |
Fair Value(18) |
||||||||||
|---|---|---|---|---|---|---|---|---|---|---|---|---|---|---|---|---|
Non-Control/Non-Affiliate Investments(7) |
|
|
||||||||||||||
|
||||||||||||||||
AAC Holdings, Inc.(11) |
June 30, 2017 | Substance Abuse Treatment Service Provider |
||||||||||||||
|
LIBOR Plus 6.75% (Floor 1.00%), Current Coupon 9.28%, Secured Debt (Maturity — June 30, 2023)(9) |
$ | 14,500 | $ | 14,245 | $ | 14,246 | |||||||||
|
||||||||||||||||
Adams Publishing Group, LLC(10) |
November 19, 2015 | Local Newspaper Operator |
||||||||||||||
|
Prime Plus 4.00% (Floor 1.00%), Current Coupon 9.50%, Secured Debt (Maturity — July 3, 2023)(9) |
4,250 | 4,160 | 4,160 | ||||||||||||
|
LIBOR Plus 7.00% (Floor 1.00%), Current Coupon 9.93%, Secured Debt (Maturity — July 3, 2023)(9) |
8,108 | 7,956 | 7,956 | ||||||||||||
| | | | | | | | | | | | | | | | | |
|
12,116 | 12,116 | ||||||||||||||
|
||||||||||||||||
ADS Tactical, Inc.(10) |
March 7, 2017 | Value-Added Logistics and Supply Chain Provider to the Defense Industry |
||||||||||||||
|
LIBOR Plus 6.25% (Floor 0.75%), Current Coupon 8.77%, Secured Debt (Maturity — July 26, 2023)(9) |
16,416 | 16,263 | 15,306 | ||||||||||||
|
||||||||||||||||
Aethon United BR LP(10) |
September 8, 2017 | Oil & Gas Exploration & Production |
||||||||||||||
|
LIBOR Plus 6.75% (Floor 1.00%), Current Coupon 9.14%, Secured Debt (Maturity — September 8, 2023)(9) |
4,063 | 4,011 | 3,817 | ||||||||||||
|
||||||||||||||||
Allen Media, LLC.(11) |
September 18, 2018 | Operator of Cable Television Networks |
||||||||||||||
|
LIBOR Plus 6.50% (Floor 1.00%), Current Coupon 9.21%, Secured Debt (Maturity — August 30, 2023)(9) |
17,143 | 16,670 | 16,800 | ||||||||||||
|
||||||||||||||||
Allflex Holdings III Inc.(11) |
July 18, 2013 | Manufacturer of Livestock Identification Products |
||||||||||||||
|
LIBOR Plus 7.00% (Floor 1.00%), Current Coupon 9.48%, Secured Debt (Maturity — July 19, 2021)(9) |
13,120 | 13,077 | 13,013 | ||||||||||||
|
||||||||||||||||
American Nuts, LLC(10) |
April 10, 2018 | Roaster, Mixer and Packager of Bulk Nuts and Seeds |
||||||||||||||
|
LIBOR Plus 8.50% (Floor 1.00%) PIK, 9.50% PIK Secured Debt, (Maturity — April 10, 2023)(9)(19) |
1,127 | 1,115 | 1,115 | ||||||||||||
|
LIBOR Plus 8.50% (Floor 1.00%), Current Coupon 10.90%, Secured Debt (Maturity — April 10, 2023)(9) |
11,194 | 11,000 | 10,475 | ||||||||||||
| | | | | | | | | | | | | | | | | |
|
12,115 | 11,590 | ||||||||||||||
|
||||||||||||||||
127
MAIN STREET CAPITAL CORPORATION
Consolidated Schedule of Investments — (Continued)
December 31, 2018
(dollars in thousands)
| Portfolio Company(1)(20) |
Investment Date(26) |
Business Description |
Type of Investment(2)(3)(25) |
Principal(4) |
Cost(4) |
Fair Value(18) |
||||||||||
|---|---|---|---|---|---|---|---|---|---|---|---|---|---|---|---|---|
American Scaffold Holdings, Inc.(10) |
June 14, 2016 | Marine Scaffolding Service Provider |
||||||||||||||
|
LIBOR Plus 6.50% (Floor 1.00%), Current Coupon 9.30%, Secured Debt (Maturity — March 31, 2022)(9) |
6,656 | 6,592 | 6,623 | ||||||||||||
|
||||||||||||||||
American Teleconferencing Services, Ltd.(11) |
May 19, 2016 | Provider of Audio Conferencing and Video Collaboration Solutions |
||||||||||||||
|
LIBOR Plus 6.50% (Floor 1.00%), Current Coupon 9.09%, Secured Debt (Maturity — December 8, 2021)(9) |
15,940 | 15,186 | 13,310 | ||||||||||||
|
||||||||||||||||
Apex Linen Service, Inc. |
October 30, 2015 | Industrial Launderers |
||||||||||||||
|
LIBOR Plus 9.00% (Floor 1.00%), Current Coupon 11.35%, Secured Debt (Maturity — October 30, 2022)(9) |
2,400 | 2,400 | 2,400 | ||||||||||||
|
16% Secured Debt (Maturity — October 30, 2022) |
14,416 | 14,357 | 14,357 | ||||||||||||
| | | | | | | | | | | | | | | | | |
|
16,757 | 16,757 | ||||||||||||||
|
||||||||||||||||
APTIM Corp.(11) |
August 17, 2018 | Engineering, Construction & Procurement |
||||||||||||||
|
7.75% Secured Debt (Maturity — June 15, 2025) |
12,452 | 10,633 | 9,464 | ||||||||||||
|
||||||||||||||||
Arcus Hunting LLC(10) |
January 6, 2015 | Manufacturer of Bowhunting and Archery Products and Accessories |
||||||||||||||
|
LIBOR Plus 7.00% (Floor 1.00%), Current Coupon 9.40%, Secured Debt (Maturity — November 13, 2019)(9) |
15,394 | 15,351 | 15,394 | ||||||||||||
|
||||||||||||||||
Arise Holdings, Inc.(10) |
March 12, 2018 | Tech-Enabled Business Process Outsourcing |
||||||||||||||
|
Preferred Stock(1,000,000 shares) |
1,000 | 1,704 | |||||||||||||
|
||||||||||||||||
ASC Ortho Management Company, LLC(10) |
August 31, 2018 | Provider of Orthopedic Services |
||||||||||||||
|
LIBOR Plus 7.50% (Floor 1.00%), Current Coupon 9.90%, Secured Debt (Maturity — August 31, 2023)(9) |
4,660 | 4,559 | 4,559 | ||||||||||||
|
13.25% PIK Secured Debt (Maturity — December 1, 2023)(19) |
1,624 | 1,587 | 1,587 | ||||||||||||
| | | | | | | | | | | | | | | | | |
|
6,146 | 6,146 | ||||||||||||||
|
||||||||||||||||
ATI Investment Sub, Inc.(11) |
July 11, 2016 | Manufacturer of Solar Tracking Systems |
||||||||||||||
|
LIBOR Plus 7.25% (Floor 1.00%), Current Coupon 9.76%, Secured Debt (Maturity — June 22, 2021)(9) |
4,385 | 4,346 | 3,943 | ||||||||||||
|
||||||||||||||||
128
MAIN STREET CAPITAL CORPORATION
Consolidated Schedule of Investments — (Continued)
December 31, 2018
(dollars in thousands)
| Portfolio Company(1)(20) |
Investment Date(26) |
Business Description |
Type of Investment(2)(3)(25) |
Principal(4) |
Cost(4) |
Fair Value(18) |
||||||||||
|---|---|---|---|---|---|---|---|---|---|---|---|---|---|---|---|---|
ATX Networks Corp.(11)(13)(21) |
June 30, 2015 | Provider of Radio Frequency Management Equipment |
||||||||||||||
|
LIBOR Plus 6.00% (Floor 1.00%), Current Coupon 8.39% / 1.00% PIK, Current Coupon Plus PIK 9.39%, Secured Debt (Maturity — June 11, 2021)(9)(19) |
14,121 | 13,844 | 13,415 | ||||||||||||
|
||||||||||||||||
Berry Aviation, Inc.(10) |
July 6, 2018 | Charter Airline Services |
||||||||||||||
|
10.50% Current / 1.5% PIK, Secured Debt (Maturity — January 6, 2024)(19) |
4,485 | 4,443 | 4,443 | ||||||||||||
|
Preferred Member Units (Berry Acquisition, LLC) (1,548,387 units; 8% cumulative)(8)(19) |
1,609 | 1,609 | |||||||||||||
| | | | | | | | | | | | | | | | | |
|
6,052 | 6,052 | ||||||||||||||
BigName Commerce, LLC(10) |
May 11, 2017 | Provider of Envelopes and Complimentary Stationery Products |
||||||||||||||
|
LIBOR Plus 7.25% (Floor 1.00%), Current Coupon 9.65%, Secured Debt (Maturity — May 11, 2022)(9) |
2,462 | 2,440 | 2,369 | ||||||||||||
|
||||||||||||||||
Binswanger Enterprises, LLC(10) |
March 10, 2017 | Glass Repair and Installation Service Provider |
||||||||||||||
|
LIBOR Plus 8.00% (Floor 1.00%), Current Coupon 10.74%, Secured Debt (Maturity — March 9, 2022)(9) |
14,368 | 14,169 | 13,743 | ||||||||||||
|
Member Units (1,050,000 units) |
1,050 | 1,330 | |||||||||||||
| | | | | | | | | | | | | | | | | |
|
15,219 | 15,073 | ||||||||||||||
|
||||||||||||||||
Bluestem Brands, Inc.(11) |
December 19, 2013 | Multi-Channel Retailer of General Merchandise |
||||||||||||||
|
LIBOR Plus 7.50% (Floor 1.00%), Current Coupon 10.02%, Secured Debt (Maturity — November 6, 2020)(9) |
11,375 | 11,262 | 7,356 | ||||||||||||
|
||||||||||||||||
Brainworks Software, LLC(10) |
August 12, 2014 | Advertising Sales and Newspaper Circulation Software |
||||||||||||||
|
Prime Plus 9.25% (Floor 3.25%), Current Coupon 14.70%, Secured Debt (Maturity — July 22, 2019)(9) |
6,733 | 6,723 | 6,590 | ||||||||||||
|
||||||||||||||||
Brightwood Capital Fund Investments(12)(13) |
July 21, 2014 | Investment Partnership |
||||||||||||||
|
LP Interests (Brightwood Capital Fund III, LP) (Fully diluted 1.6%)(8) |
12,000 | 10,264 | |||||||||||||
|
LP Interests (Brightwood Capital Fund IV, LP) (Fully diluted 0.6%)(8) |
2,000 | 2,063 | |||||||||||||
| | | | | | | | | | | | | | | | | |
|
14,000 | 12,327 | ||||||||||||||
|
||||||||||||||||
Cadence Aerospace LLC(10) |
November 14, 2017 | Aerostructure Manufacturing |
||||||||||||||
|
LIBOR Plus 6.50% (Floor 1.00%), Current Coupon 9.06%, Secured Debt (Maturity — November 14, 2023)(9) |
19,470 | 19,301 | 18,244 | ||||||||||||
|
||||||||||||||||
129
MAIN STREET CAPITAL CORPORATION
Consolidated Schedule of Investments — (Continued)
December 31, 2018
(dollars in thousands)
| Portfolio Company(1)(20) |
Investment Date(26) |
Business Description |
Type of Investment(2)(3)(25) |
Principal(4) |
Cost(4) |
Fair Value(18) |
||||||||||
|---|---|---|---|---|---|---|---|---|---|---|---|---|---|---|---|---|
California Pizza Kitchen, Inc.(11) |
August 29, 2016 | Casual Restaurant Group |
||||||||||||||
|
LIBOR Plus 6.00% (Floor 1.00%), Current Coupon 8.53%, Secured Debt (Maturity — August 23, 2022)(9) |
12,739 | 12,707 | 12,389 | ||||||||||||
|
||||||||||||||||
Central Security Group, Inc.(11) |
December 4, 2017 | Security Alarm Monitoring Service Provider |
||||||||||||||
|
LIBOR Plus 5.63% (Floor 1.00%), Current Coupon 8.15%, Secured Debt (Maturity — October 6, 2021)(9) |
13,884 | 13,821 | 13,867 | ||||||||||||
|
||||||||||||||||
Cenveo Corporation(11) |
September 4, 2015 | Provider of Digital Marketing Agency Services |
||||||||||||||
|
Libor Plus 9.00% (Floor 1.00%), Current Coupon 11.54%, Secured Debt (Maturity — June 7, 2023)(9) |
6,370 | 6,128 | 6,048 | ||||||||||||
|
Common Stock (177,130 shares) |
5,309 | 2,746 | |||||||||||||
| | | | | | | | | | | | | | | | | |
|
11,437 | 8,794 | ||||||||||||||
|
||||||||||||||||
Clarius BIGS, LLC(10) |
September 23, 2014 | Prints & Advertising Film Financing |
||||||||||||||
|
15% PIK Secured Debt (Maturity — January 5, 2015)(14)(17) |
2,908 | 2,908 | 44 | ||||||||||||
|
||||||||||||||||
Clickbooth.com, LLC(10) |
December 5, 2017 | Provider of Digital Advertising Performance Marketing Solutions |
||||||||||||||
|
LIBOR Plus 8.50% (Floor 1.00%), Current Coupon 10.90%, Secured Debt (Maturity — December 5, 2022)(9) |
2,925 | 2,876 | 2,750 | ||||||||||||
|
||||||||||||||||
Construction Supply Investments, LLC(10) |
December 29, 2016 | Distribution Platform of Specialty Construction Materials to Professional Concrete and Masonry Contractors |
||||||||||||||
|
LIBOR Plus 6.00% (Floor 1.00%), Current Coupon 8.62%, Secured Debt (Maturity — June 30, 2023)(9) |
15,423 | 15,355 | 15,384 | ||||||||||||
|
Member Units (42,207 units) |
4,221 | 4,290 | |||||||||||||
| | | | | | | | | | | | | | | | | |
|
19,576 | 19,674 | ||||||||||||||
CTVSH, PLLC(10) |
August 3, 2017 | Emergency Care and Specialty Service Animal Hospital |
||||||||||||||
|
LIBOR Plus 8.00% (Floor 1.00%), Current Coupon 10.74%, Secured Debt (Maturity — August 3, 2022)(9) |
11,250 | 11,163 | 10,939 | ||||||||||||
|
||||||||||||||||
Darr Equipment LP(10) |
April 15, 2014 | Heavy Equipment Dealer |
||||||||||||||
|
11.5% Current / 1% PIK Secured Debt (Maturity — June 22, 2023)(19) |
5,839 | 5,839 | 5,723 | ||||||||||||
|
Warrants (915,734 equivalent units; Expiration — December 23, 2023; Strike price — $1.50 per unit) |
474 | 60 | |||||||||||||
| | | | | | | | | | | | | | | | | |
|
6,313 | 5,783 | ||||||||||||||
|
||||||||||||||||
130
MAIN STREET CAPITAL CORPORATION
Consolidated Schedule of Investments — (Continued)
December 31, 2018
(dollars in thousands)
| Portfolio Company(1)(20) |
Investment Date(26) |
Business Description |
Type of Investment(2)(3)(25) |
Principal(4) |
Cost(4) |
Fair Value(18) |
||||||||||
|---|---|---|---|---|---|---|---|---|---|---|---|---|---|---|---|---|
Digital River, Inc.(11) |
February 24, 2015 | Provider of Outsourced e-Commerce Solutions and Services |
||||||||||||||
|
LIBOR Plus 6.00% (Floor 1.00%), Current Coupon 8.78%, Secured Debt (Maturity — February 12, 2021)(9) |
10,146 | 10,074 | 10,044 | ||||||||||||
|
||||||||||||||||
DTE Enterprises, LLC(10) |
April 13, 2018 | Industrial Powertrain Repair and Services |
||||||||||||||
|
LIBOR Plus 7.50% (Floor 1.50%), Current Coupon 10.12%, Secured Debt (Maturity — April 13, 2023)(9) |
12,492 | 12,260 | 11,580 | ||||||||||||
|
Class AA Preferred Member Units (non-voting; 10% cumulative)(8)(19) |
778 | 778 | |||||||||||||
|
Class A Preferred Member Units (776,316 units)(8) |
776 | 1,300 | |||||||||||||
| | | | | | | | | | | | | | | | | |
|
13,814 | 13,658 | ||||||||||||||
|
||||||||||||||||
Dynamic Communities, LLC(10) |
July 17, 2018 | Developer of Business Events and Online Community Groups |
||||||||||||||
|
LIBOR Plus 8.00%(Floor 1.00%), Current Coupon 10.80%, Secured Debt(Maturity — July 17, 2023)(9) |
5,600 | 5,495 | 5,495 | ||||||||||||
|
||||||||||||||||
Elite SEM INC.(10) |
August 31, 2018 | Provider of Digital Marketing Agency Services |
||||||||||||||
|
LIBOR Plus 8.50% (Floor 1.00%), Current Coupon 11.27%, Secured Debt (Maturity — February 1, 2022)(9)(23) |
6,875 | 6,750 | 6,750 | ||||||||||||
|
||||||||||||||||
EnCap Energy Fund Investments(12)(13) |
December 28, 2010 | Investment Partnership |
||||||||||||||
|
LP Interests (EnCap Energy Capital Fund VIII, L.P.) (Fully diluted 0.1%)(8) |
3,661 | 2,003 | |||||||||||||
|
LP Interests (EnCap Energy Capital Fund VIII Co- Investors, L.P.) (Fully diluted 0.4%)(8) |
2,103 | 1,153 | |||||||||||||
|
LP Interests (EnCap Energy Capital Fund IX, L.P.) (Fully diluted 0.1%)(8) |
4,430 | 3,784 | |||||||||||||
|
LP Interests (EnCap Energy Capital Fund X, L.P.) (Fully diluted 0.1%)(8) |
7,629 | 7,692 | |||||||||||||
|
LP Interests (EnCap Flatrock Midstream Fund II, L.P.) (Fully diluted 0.8%)(8) |
5,881 | 4,538 | |||||||||||||
|
LP Interests (EnCap Flatrock Midstream Fund III, L.P.) (Fully diluted 0.2%)(8) |
5,423 | 5,051 | |||||||||||||
| | | | | | | | | | | | | | | | | |
|
29,127 | 24,221 | ||||||||||||||
|
||||||||||||||||
Encino Acquisition Partners Holdings, Inc.(11) |
November 16, 2018 | Oil & Gas Exploration & Production |
||||||||||||||
|
LIBOR Plus 6.75% (Floor 1.00%), Current Coupon 9.27%, Secured Debt (Maturity — October 29, 2025)(9) |
9,000 | 8,911 | 8,595 | ||||||||||||
|
||||||||||||||||
131
MAIN STREET CAPITAL CORPORATION
Consolidated Schedule of Investments — (Continued)
December 31, 2018
(dollars in thousands)
| Portfolio Company(1)(20) |
Investment Date(26) |
Business Description |
Type of Investment(2)(3)(25) |
Principal(4) |
Cost(4) |
Fair Value(18) |
||||||||||
|---|---|---|---|---|---|---|---|---|---|---|---|---|---|---|---|---|
EPIC Y-Grade Services, LP(11) |
June 22, 2018 | NGL Transportation & Storage |
||||||||||||||
|
LIBOR Plus 5.50%, Current Coupon 8.02%, Secured Debt (Maturity — June 13, 2024) |
17,500 | 17,175 | 16,625 | ||||||||||||
|
||||||||||||||||
Evergreen Skills Lux S.á r.l. |
May 5, 2014 | Technology-based Performance Support Solutions |
||||||||||||||
|
LIBOR Plus 8.25% (Floor 1.00%), Current Coupon 10.77%, Secured Debt (Maturity — April 28, 2022)(9) |
6,999 | 6,901 | 3,931 | ||||||||||||
|
||||||||||||||||
Extreme Reach, Inc.(11) |
March 31, 2015 | Integrated TV and Video Advertising Platform |
||||||||||||||
|
LIBOR Plus 6.25% (Floor 1.00%), Current Coupon 8.78%, Secured Debt (Maturity — February 7, 2020)(9) |
16,460 | 16,451 | 16,371 | ||||||||||||
|
||||||||||||||||
Felix Investments Holdings II(10) |
August 9, 2017 | Oil & Gas Exploration & Production |
||||||||||||||
|
LIBOR Plus 6.50% (Floor 1.00%), Current Coupon 9.10%, Secured Debt (Maturity — August 9, 2022)(9) |
3,333 | 3,279 | 3,141 | ||||||||||||
|
||||||||||||||||
Flavors Holdings Inc.(11) |
October 15, 2014 | Global Provider of Flavoring and Sweetening Products |
||||||||||||||
|
LIBOR Plus 5.75% (Floor 1.00%), Current Coupon 8.55%, Secured Debt (Maturity — April 3, 2020)(9) |
12,295 | 12,044 | 11,434 | ||||||||||||
|
||||||||||||||||
GeoStabilization International (GSI)(11) |
December 31, 2018 | Geohazard Engineering Services & Maintenance |
||||||||||||||
|
LIBOR Plus 5.50%, Current Coupon 8.09%, Secured Debt (Maturity — December 19, 2025) |
16,500 | 16,335 | 16,418 | ||||||||||||
|
||||||||||||||||
GI KBS Merger Sub LLC(11) |
November 10, 2014 | Outsourced Janitorial Service Provider |
||||||||||||||
|
LIBOR Plus 4.75% (Floor 1.00%), Current Coupon 7.43%, Secured Debt (Maturity — October 29, 2021)(9) |
9,195 | 9,139 | 9,207 | ||||||||||||
|
LIBOR Plus 8.50% (Floor 1.00%), Current Coupon 11.02%, Secured Debt (Maturity — April 29, 2022)(9) |
3,915 | 3,797 | 3,949 | ||||||||||||
| | | | | | | | | | | | | | | | | |
|
12,936 | 13,156 | ||||||||||||||
|
||||||||||||||||
Good Source Solutions, Inc.(10) |
October 23, 2018 | Specialized Food Distributor |
||||||||||||||
|
LIBOR Plus 8.34% (Floor 1.00%), Current Coupon 11.14%, Secured Debt (Maturity — June 29, 2023)(9)(23) |
5,000 | 4,952 | 4,952 | ||||||||||||
132
MAIN STREET CAPITAL CORPORATION
Consolidated Schedule of Investments — (Continued)
December 31, 2018
(dollars in thousands)
| Portfolio Company(1)(20) |
Investment Date(26) |
Business Description |
Type of Investment(2)(3)(25) |
Principal(4) |
Cost(4) |
Fair Value(18) |
||||||||||
|---|---|---|---|---|---|---|---|---|---|---|---|---|---|---|---|---|
GoWireless Holdings, Inc.(11) |
December 31, 2017 | Provider of Wireless Telecommunications Carrier Services |
||||||||||||||
|
LIBOR Plus 6.50% (Floor 1.00%), Current Coupon 9.02%, Secured Debt (Maturity — December 22, 2024)(9) |
17,325 | 17,170 | 16,856 | ||||||||||||
|
||||||||||||||||
Grupo Hima San Pablo, Inc.(11) |
March 7, 2013 | Tertiary Care Hospitals |
||||||||||||||
|
LIBOR Plus 7.00% (Floor 1.50%), Current Coupon 9.52%, Secured Debt (Maturity — January 31, 2019)(9) |
4,688 | 4,688 | 3,629 | ||||||||||||
|
13.75% Secured Debt (Maturity — October 15, 2018)(17) |
2,055 | 2,040 | 226 | ||||||||||||
| | | | | | | | | | | | | | | | | |
|
6,728 | 3,855 | ||||||||||||||
|
||||||||||||||||
HDC/HW Intermediate Holdings(10) |
December 21, 2018 | Managed Services and Hosting Provider |
||||||||||||||
|
LIBOR Plus 7.50% (Floor 1.00%), Current Coupon 10.29%, Secured Debt (Maturity — December 21, 2023)(9) |
3,201 | 3,132 | 3,132 | ||||||||||||
|
||||||||||||||||
Hoover Group, Inc.(10)(13) |
October 21, 2016 | Provider of Storage Tanks and Related Products to the Energy and Petrochemical Markets |
||||||||||||||
|
LIBOR Plus 6.00%, Current Coupon 8.71%, Secured Debt (Maturity — January 28, 2020) |
5,250 | 4,803 | 4,771 | ||||||||||||
|
LIBOR Plus 7.25% (Floor 1.00%), Current Coupon 9.90%, Secured Debt (Maturity — January 28, 2021)(9) |
9,395 | 9,053 | 8,831 | ||||||||||||
| | | | | | | | | | | | | | | | | |
|
13,856 | 13,602 | ||||||||||||||
|
||||||||||||||||
Hunter Defense Technologies, Inc.(10) |
March 29, 2018 | Provider of Military and Commercial Shelters and Systems |
||||||||||||||
|
LIBOR Plus 7.00% (Floor 1.00%), Current Coupon 9.80%, Secured Debt (Maturity — March 29, 2023)(9) |
16,080 | 15,757 | 15,077 | ||||||||||||
|
||||||||||||||||
Hydrofarm Holdings LLC(10) |
May 18, 2017 | Wholesaler of Horticultural Products |
||||||||||||||
|
LIBOR Plus 10.00%, Current Coupon 3.69% / 8.61% PIK, Current Coupon Plus PIK 12.30% Secured Debt (Maturity — May 12, 2022)(19) |
7,235 | 7,139 | 5,660 | ||||||||||||
|
||||||||||||||||
iEnergizer Limited(11)(13)(21) |
May 8, 2013 | Provider of Business Outsourcing Solutions |
||||||||||||||
|
LIBOR Plus 6.00% (Floor 1.25%), Current Coupon 8.53%, Secured Debt (Maturity — May 1, 2019)(9) |
14,100 | 14,052 | 14,117 | ||||||||||||
|
||||||||||||||||
Implus Footcare, LLC(10) |
June 1, 2017 | Provider of Footwear and Related Accessories |
||||||||||||||
|
LIBOR Plus 6.75% (Floor 1.00%), Current Coupon 9.55%, Secured Debt (Maturity — April 30, 2021)(9) |
18,819 | 18,629 | 18,390 | ||||||||||||
|
||||||||||||||||
133
MAIN STREET CAPITAL CORPORATION
Consolidated Schedule of Investments — (Continued)
December 31, 2018
(dollars in thousands)
| Portfolio Company(1)(20) |
Investment Date(26) |
Business Description |
Type of Investment(2)(3)(25) |
Principal(4) |
Cost(4) |
Fair Value(18) |
||||||||||
|---|---|---|---|---|---|---|---|---|---|---|---|---|---|---|---|---|
Independent Pet Partners Intermediate Holdings, LLC(10) |
November 20, 2018 | Omnichannel Retailer of Specialty Pet Products |
||||||||||||||
|
LIBOR Plus 9.00% (Floor 1.00%), Current Coupon 11.90%, Secured Debt (Maturity — November 19, 2023)(9) |
2,078 | 2,037 | 2,037 | ||||||||||||
|
Member Units (1,558,333 units) |
1,558 | 1,558 | |||||||||||||
| | | | | | | | | | | | | | | | | |
|
3,595 | 3,595 | ||||||||||||||
|
||||||||||||||||
Industrial Services Acquisition, LLC(10) |
June 17, 2016 | Industrial Cleaning Services |
||||||||||||||
|
6% Current / 7% PIK Unsecured Debt (Maturity — December 17, 2022)(19) |
4,885 | 4,822 | 4,470 | ||||||||||||
|
Preferred Member Units (Industrial Services Investments, LLC) (144 units; 10% cumulative)(8)(19) |
94 | 94 | |||||||||||||
|
Member Units (Industrial Services Investments, LLC) (900 units) |
900 | 210 | |||||||||||||
| | | | | | | | | | | | | | | | | |
|
5,816 | 4,774 | ||||||||||||||
|
||||||||||||||||
Inn of the Mountain Gods Resort and Casino(11) |
October 30, 2013 | Hotel & Casino Owner & Operator |
||||||||||||||
|
9.25% Secured Debt (Maturity — November 30, 2020) |
7,832 | 7,479 | 7,480 | ||||||||||||
|
||||||||||||||||
Intermedia Holdings, Inc.(11) |
August 3, 2018 | Unified Communications as a Service |
||||||||||||||
|
LIBOR Plus 6.00% (Floor 1.00%), Current Coupon 8.52%, Secured Debt (Maturity — July 19, 2025)(9) |
11,571 | 11,461 | 11,557 | ||||||||||||
|
||||||||||||||||
irth Solutions, LLC |
December 29, 2010 | Provider of Damage Prevention Information Technology Services |
||||||||||||||
|
Member Units (27,893 units) |
1,441 | 2,830 | |||||||||||||
|
||||||||||||||||
Isagenix International, LLC(11) |
June 21, 2018 | Direct Marketer of Health & Wellness Products |
||||||||||||||
|
LIBOR Plus 5.75% (Floor 1.00%), Current Coupon 8.55%, Secured Debt (Maturity — June 14, 2025)(9) |
6,268 | 6,208 | 6,095 | ||||||||||||
|
||||||||||||||||
JAB Wireless, Inc.(10) |
May 2, 2018 | Fixed Wireless Broadband Provider |
||||||||||||||
|
LIBOR Plus 8.00% (Floor 1.00%), Current Coupon 10.39%, Secured Debt (Maturity — May 2, 2023)(9) |
14,888 | 14,754 | 13,987 | ||||||||||||
|
||||||||||||||||
Jacent Strategic Merchandising, LLC(10) |
September 16, 2015 | General Merchandise Distribution |
||||||||||||||
|
LIBOR Plus 7.50% (Floor 1.00%), Current Coupon 10.27%, Secured Debt (Maturity — September 16, 2020)(9) |
10,740 | 10,705 | 10,740 | ||||||||||||
Jackmont Hospitality, Inc.(10) |
May 26, 2015 | Franchisee of Casual Dining Restaurants |
||||||||||||||
|
LIBOR Plus 6.75% (Floor 1.00%), Current Coupon 9.26%, Secured Debt (Maturity — May 26, 2021)(9) |
4,165 | 4,157 | 4,165 | ||||||||||||
|
||||||||||||||||
134
MAIN STREET CAPITAL CORPORATION
Consolidated Schedule of Investments — (Continued)
December 31, 2018
(dollars in thousands)
| Portfolio Company(1)(20) |
Investment Date(26) |
Business Description |
Type of Investment(2)(3)(25) |
Principal(4) |
Cost(4) |
Fair Value(18) |
||||||||||
|---|---|---|---|---|---|---|---|---|---|---|---|---|---|---|---|---|
Jacuzzi Brands LLC(11) |
June 30, 2017 | Manufacturer of Bath and Spa Products |
||||||||||||||
|
LIBOR Plus 7.00% (Floor 1.00%), Current Coupon 9.52%, Secured Debt (Maturity — June 28, 2023)(9) |
3,850 | 3,788 | 3,831 | ||||||||||||
|
||||||||||||||||
Joerns Healthcare, LLC(11) |
April 3, 2013 | Manufacturer and Distributor of Health Care Equipment & Supplies |
||||||||||||||
|
LIBOR Plus 6.00% (Floor 1.00%), Current Coupon 8.71% Secured Debt (Maturity — May 9, 2020)(9) |
13,387 | 13,335 | 11,998 | ||||||||||||
|
||||||||||||||||
Kore Wireless Group Inc.(11) |
December 31, 2018 | Mission Critical Software Platform |
||||||||||||||
|
LIBOR Plus 5.50%, Current Coupon 8.29%, Secured Debt (Maturity — December 20, 2024) |
6,667 | 6,600 | 6,631 | ||||||||||||
|
||||||||||||||||
Larchmont Resources, LLC(11) |
August 13, 2013 | Oil & Gas Exploration & Production |
||||||||||||||
|
LIBOR Plus 9.00% (Floor 1.00%) PIK, 11.77% PIK Secured Debt, (Maturity — August 7, 2020)(9)(19) |
2,312 | 2,312 | 2,266 | ||||||||||||
|
Member Units (Larchmont Intermediate Holdco, LLC) (2,828 units) |
353 | 707 | |||||||||||||
| | | | | | | | | | | | | | | | | |
|
2,665 | 2,973 | ||||||||||||||
|
||||||||||||||||
LKCM Headwater |
January 25, 2013 | Investment Partnership |
||||||||||||||
|
LP Interests (Fully diluted 2.3%)(8) |
1,780 | 3,501 | |||||||||||||
|
||||||||||||||||
Logix Acquisition Company, LLC(10) |
June 24, 2016 | Competitive Local Exchange Carrier |
||||||||||||||
|
LIBOR Plus 5.75% (Floor 1.00%), Current Coupon 8.27%, Secured Debt (Maturity — December 22, 2024)(9) |
12,927 | 12,725 | 12,797 | ||||||||||||
|
||||||||||||||||
Looking Glass Investments, LLC(12)(13) |
July 1, 2015 | Specialty Consumer Finance |
||||||||||||||
|
Member Units (2.5 units) |
125 | 57 | |||||||||||||
|
Member Units (LGI Predictive Analytics LLC) (190,712 units)(8) |
49 | 33 | |||||||||||||
| | | | | | | | | | | | | | | | | |
|
174 | 90 | ||||||||||||||
|
||||||||||||||||
LSF9 Atlantis Holdings, LLC(11) |
May 17, 2017 | Provider of Wireless Telecommunications Carrier Services |
||||||||||||||
|
LIBOR Plus 6.00% (Floor 1.00%), Current Coupon 8.38%, Secured Debt (Maturity — May 1, 2023)(9) |
9,710 | 9,694 | 9,269 | ||||||||||||
|
||||||||||||||||
Lulu's Fashion Lounge, LLC(10) |
August 31, 2017 | Fast Fashion E-Commerce Retailer |
||||||||||||||
|
LIBOR Plus 7.00% (Floor 1.00%), Current Coupon 9.52%, Secured Debt (Maturity — August 28, 2022)(9) |
12,358 | 12,060 | 11,987 | ||||||||||||
|
||||||||||||||||
135
MAIN STREET CAPITAL CORPORATION
Consolidated Schedule of Investments — (Continued)
December 31, 2018
(dollars in thousands)
| Portfolio Company(1)(20) |
Investment Date(26) |
Business Description |
Type of Investment(2)(3)(25) |
Principal(4) |
Cost(4) |
Fair Value(18) |
||||||||||
|---|---|---|---|---|---|---|---|---|---|---|---|---|---|---|---|---|
MHVC Acquisition Corp.(11) |
May 8, 2017 | Provider of differentiated information solutions, systems engineering, and analytics |
||||||||||||||
|
LIBOR Plus 5.25% (Floor 1.00%), Current Coupon 8.06%, Secured Debt (Maturity — April 29, 2024)(9) |
15,475 | 15,442 | 15,088 | ||||||||||||
|
||||||||||||||||
Mills Fleet Farm Group, LLC(10) |
October 24, 2018 | Omnichannel Retailer of Work, Farm and Lifestyle Merchandise |
||||||||||||||
|
LIBOR Plus 6.25% (Floor 1.00%), Current Coupon 8.77%, Secured Debt (Maturity — October 24, 2024)(9) |
15,000 | 14,707 | 15,000 | ||||||||||||
|
||||||||||||||||
Mobileum(10) |
October 23, 2018 | Provider of big data analytics to telecom service providers |
||||||||||||||
|
LIBOR Plus 10.25% (Floor 0.75%), Current Coupon 13.06%, Secured Debt (Maturity — May 1, 2022)(9) |
7,500 | 7,429 | 7,429 | ||||||||||||
|
||||||||||||||||
NBG Acquisition Inc(11) |
April 28, 2017 | Wholesaler of Home Décor Products |
||||||||||||||
|
LIBOR Plus 5.50% (Floor 1.00%), Current Coupon 8.09%, Secured Debt (Maturity — April 26, 2024)(9) |
4,292 | 4,235 | 4,184 | ||||||||||||
|
||||||||||||||||
New Era Technology, Inc.(10) |
June 30, 2018 | Managed Services and Hosting Provider |
||||||||||||||
|
LIBOR Plus 6.50% (Floor 1.00%), Current Coupon 8.99%, Secured Debt (Maturity — June 22, 2023)(9) |
7,654 | 7,526 | 7,616 | ||||||||||||
|
||||||||||||||||
New Media |
June 10, 2014 | Local Newspaper Operator |
||||||||||||||
|
LIBOR Plus 6.25% (Floor 1.00%), Current Coupon 8.77%, Secured Debt (Maturity — July 14, 2022)(9) |
21,125 | 20,797 | 20,967 | ||||||||||||
|
||||||||||||||||
NNE Partners, LLC(10) |
March 2, 2017 | Oil & Gas Exploration & Production |
||||||||||||||
|
LIBOR Plus 8.00%, Current Coupon 10.74%, Secured Debt (Maturity — March 2, 2022) |
20,417 | 20,260 | 19,572 | ||||||||||||
|
||||||||||||||||
North American Lifting Holdings, Inc.(11) |
February 26, 2015 | Crane Service Provider |
||||||||||||||
|
LIBOR Plus 4.50% (Floor 1.00%), Current Coupon 7.30%, Secured Debt (Maturity — November 27, 2020)(9) |
7,664 | 7,093 | 6,997 | ||||||||||||
|
||||||||||||||||
Novetta Solutions, LLC(11) |
June 21, 2017 | Provider of Advanced Analytics Solutions for Defense Agencies |
||||||||||||||
|
LIBOR Plus 5.00% (Floor 1.00%), Current Coupon 7.53%, Secured Debt (Maturity — October 17, 2022)(9) |
15,478 | 15,091 | 15,091 | ||||||||||||
|
||||||||||||||||
136
MAIN STREET CAPITAL CORPORATION
Consolidated Schedule of Investments — (Continued)
December 31, 2018
(dollars in thousands)
| Portfolio Company(1)(20) |
Investment Date(26) |
Business Description |
Type of Investment(2)(3)(25) |
Principal(4) |
Cost(4) |
Fair Value(18) |
||||||||||
|---|---|---|---|---|---|---|---|---|---|---|---|---|---|---|---|---|
NTM Acquisition Corp.(11) |
July 12, 2016 | Provider of B2B Travel Information Content |
||||||||||||||
|
LIBOR Plus 6.25% (Floor 1.00%), Current Coupon 8.96%, Secured Debt (Maturity — June 7, 2022)(9) |
4,419 | 4,396 | 4,375 | ||||||||||||
|
||||||||||||||||
Ospemifene Royalty Sub LLC (QuatRx)(10) |
July 8, 2013 | Estrogen-Deficiency Drug Manufacturer and Distributor |
||||||||||||||
|
11.5% Secured Debt (Maturity — November 15, 2026)(14) |
4,975 | 4,975 | 937 | ||||||||||||
|
||||||||||||||||
Permian Holdco 2, Inc.(11) |
February 12, 2013 | Storage Tank Manufacturer |
||||||||||||||
|
14% PIK Unsecured Debt (Maturity — October 15, 2021)(19) |
396 | 396 | 396 | ||||||||||||
|
Preferred Stock (Permian |
799 | 920 | |||||||||||||
| | | | | | | | | | | | | | | | | |
|
1,195 | 1,316 | ||||||||||||||
|
||||||||||||||||
Pernix Therapeutics Holdings, Inc.(10) |
August 18, 2014 | Pharmaceutical Royalty |
||||||||||||||
|
12% Secured Debt (Maturity — August 1, 2020) |
3,031 | 3,031 | 2,037 | ||||||||||||
|
||||||||||||||||
Pier 1 Imports, Inc.(11) |
February 20, 2018 | Decorative Home Furnishings Retailer |
||||||||||||||
|
LIBOR Plus 3.50% (Floor 1.00%), Current Coupon 6.38%, Secured Debt (Maturity — April 30, 2021)(9) |
9,736 | 9,152 | 6,998 | ||||||||||||
|
||||||||||||||||
Point.360(10) |
July 8, 2015 | Fully Integrated Provider of Digital Media Services |
||||||||||||||
|
Warrants (65,463 equivalent shares; Expiration — July 7, 2020; Strike price — $0.75 per share) |
69 | — | |||||||||||||
|
Common Stock (163,658 shares) |
273 | 5 | |||||||||||||
| | | | | | | | | | | | | | | | | |
|
342 | 5 | ||||||||||||||
|
||||||||||||||||
PricewaterhouseCoopers Public Sector LLP(11) |
May 24, 2018 | Provider of Consulting Services to Governments |
||||||||||||||
|
LIBOR Plus 7.50%, Current Coupon 9.74%, Secured Debt (Maturity — May 1, 2026) |
8,000 | 7,962 | 8,040 | ||||||||||||
|
||||||||||||||||
Prowler Acquisition Corp.(11) |
February 11, 2014 | Specialty Distributor to the Energy Sector |
||||||||||||||
|
LIBOR Plus 4.50% (Floor 1.00%), Current Coupon 7.30%, Secured Debt (Maturity — January 28, 2020)(9) |
20,028 | 19,122 | 19,727 | ||||||||||||
|
||||||||||||||||
PT Network, LLC(10) |
November 1, 2013 | Provider of Outpatient Physical Therapy and Sports Medicine Services |
||||||||||||||
|
LIBOR Plus 5.50% (Floor 1.00%), Current Coupon 7.99%, Secured Debt (Maturity — November 30, 2021)(9) |
8,732 | 8,732 | 8,619 | ||||||||||||
|
||||||||||||||||
137
MAIN STREET CAPITAL CORPORATION
Consolidated Schedule of Investments — (Continued)
December 31, 2018
(dollars in thousands)
| Portfolio Company(1)(20) |
Investment Date(26) |
Business Description |
Type of Investment(2)(3)(25) |
Principal(4) |
Cost(4) |
Fair Value(18) |
||||||||||
|---|---|---|---|---|---|---|---|---|---|---|---|---|---|---|---|---|
Research Now Group, Inc. and Survey Sampling International, LLC(11) |
December 31, 2017 | Provider of Outsourced Online Surveying |
||||||||||||||
|
LIBOR Plus 5.50% (Floor 1.00%), Current Coupon 8.02%, Secured Debt (Maturity — December 20, 2024)(9) |
15,360 | 14,757 | 15,110 | ||||||||||||
|
||||||||||||||||
Resolute Industrial, LLC(10) |
July 26, 2017 | HVAC Equipment Rental and Remanufacturing |
||||||||||||||
|
Member Units (601 units) |
750 | 920 | |||||||||||||
|
||||||||||||||||
RM Bidder, LLC(10) |
November 12, 2015 | Scripted and Unscripted TV and Digital Programming Provider |
||||||||||||||
|
Warrants (327,532 equivalent units; Expiration — October 20, 2025; Strike price — $14.28 per unit) |
425 | — | |||||||||||||
|
Member Units (2,779 units) |
46 | 11 | |||||||||||||
| | | | | | | | | | | | | | | | | |
|
471 | 11 | ||||||||||||||
|
||||||||||||||||
SAFETY Investment Holdings, LLC |
April 29, 2016 | Provider of Intelligent Driver Record Monitoring Software and Services |
||||||||||||||
|
Member Units (2,000,000 units) |
2,000 | 1,820 | |||||||||||||
|
||||||||||||||||
Salient Partners L.P.(11) |
June 25, 2015 | Provider of Asset Management Services |
||||||||||||||
|
LIBOR Plus 5.75% (Floor 1.00%), Current Coupon 8.27%, Secured Debt (Maturity — June 9, 2021)(9) |
7,313 | 7,280 | 7,280 | ||||||||||||
|
||||||||||||||||
SiTV, LLC(11) |
September 26, 2017 | Cable Networks Operator |
||||||||||||||
|
10.375% Secured Debt (Maturity — July 1, 2019) |
10,429 | 7,196 | 3,911 | ||||||||||||
|
||||||||||||||||
SMART Modular Technologies, Inc.(10)(13) |
August 18, 2017 | Provider of Specialty Memory Solutions |
||||||||||||||
|
LIBOR Plus 6.25% (Floor 1.00%), Current Coupon 8.86%, Secured Debt (Maturity — August 9, 2022)(9) |
19,000 | 18,793 | 19,095 | ||||||||||||
|
||||||||||||||||
Sorenson Communications, Inc.(11) |
June 7, 2016 | Manufacturer of Communication Products for Hearing Impaired |
||||||||||||||
|
LIBOR Plus 5.75% (Floor 2.25%), Current Coupon 8.56%, Secured Debt (Maturity — April 30, 2020)(9) |
13,097 | 13,059 | 13,048 | ||||||||||||
|
||||||||||||||||
Staples Canada ULC(10)(13)(21) |
September 14, 2017 | Office Supplies Retailer |
||||||||||||||
|
LIBOR Plus 7.00% (Floor 1.00%), Current Coupon 9.26%, Secured Debt (Maturity — September 12, 2023)(9)(22) |
16,867 | 16,589 | 14,026 | ||||||||||||
|
||||||||||||||||
138
MAIN STREET CAPITAL CORPORATION
Consolidated Schedule of Investments — (Continued)
December 31, 2018
(dollars in thousands)
| Portfolio Company(1)(20) |
Investment Date(26) |
Business Description |
Type of Investment(2)(3)(25) |
Principal(4) |
Cost(4) |
Fair Value(18) |
||||||||||
|---|---|---|---|---|---|---|---|---|---|---|---|---|---|---|---|---|
STL Parent Corp.(10) |
December 14, 2018 | Manufacturer and Servicer of Tank and Hopper Railcars |
||||||||||||||
|
LIBOR Plus 7.00%, Current Coupon 9.52%, Secured Debt (Maturity — December 5, 2022) |
15,000 | 14,475 | 14,475 | ||||||||||||
|
||||||||||||||||
Strike, LLC(11) |
December 12, 2016 | Pipeline Construction and Maintenance Services |
||||||||||||||
|
LIBOR Plus 8.00% (Floor 1.00%), Current Coupon 10.59%, Secured Debt (Maturity — November 30, 2022)(9) |
9,000 | 8,797 | 9,011 | ||||||||||||
|
||||||||||||||||
TE Holdings, LLC(11) |
December 5, 2013 | Oil & Gas Exploration & Production |
||||||||||||||
|
Member Units (97,048 units) |
970 | 66 | |||||||||||||
|
||||||||||||||||
Tectonic Holdings, LLC |
May 15, 2017 | Financial Services Organization |
||||||||||||||
|
Member Units (200,000 units)(8) |
2,000 | 2,420 | |||||||||||||
|
||||||||||||||||
TeleGuam Holdings, LLC(11) |
June 26, 2013 | Cable and Telecom Services Provider |
||||||||||||||
|
LIBOR Plus 8.50% (Floor 1.00%), Current Coupon 11.02%, Secured Debt (Maturity — April 12, 2024)(9) |
7,750 | 7,620 | 7,798 | ||||||||||||
|
||||||||||||||||
TGP Holdings III LLC(11) |
September 30, 2017 | Outdoor Cooking & Accessories |
||||||||||||||
|
LIBOR Plus 8.50% (Floor 1.00%), Current Coupon 11.30%, Secured Debt (Maturity — September 25, 2025)(9) |
5,500 | 5,433 | 5,335 | ||||||||||||
|
||||||||||||||||
The Pasha Group(11) |
February 2, 2018 | Diversified Logistics and Transportation Provided |
||||||||||||||
|
LIBOR Plus 7.50% (Floor 1.00%), Current Coupon 10.06%, Secured Debt (Maturity — January 26, 2023)(9) |
10,938 | 10,655 | 11,006 | ||||||||||||
|
||||||||||||||||
TMC Merger Sub Corp.(11) |
December 22, 2016 | Refractory & Maintenance Services Provider |
||||||||||||||
|
LIBOR Plus 6.75% (Floor 1.00%), Current Coupon 9.31%, Secured Debt (Maturity — October 31, 2022)(9)(24) |
17,207 | 17,014 | 17,121 | ||||||||||||
|
||||||||||||||||
TOMS Shoes, LLC(11) |
November 13, 2014 | Global Designer, Distributor, and Retailer of Casual Footwear |
||||||||||||||
|
LIBOR Plus 5.50% (Floor 1.00%), Current Coupon 8.30%, Secured Debt (Maturity — October 30, 2020)(9) |
4,813 | 4,635 | 3,798 | ||||||||||||
|
||||||||||||||||
Turning Point Brands, Inc.(10)(13) |
February 17, 2017 | Marketer/Distributor of Tobacco Products |
||||||||||||||
|
LIBOR Plus 7.00%, Current Coupon 9.46%, Secured Debt (Maturity — March 7, 2024) |
8,500 | 8,424 | 8,585 | ||||||||||||
|
||||||||||||||||
139
MAIN STREET CAPITAL CORPORATION
Consolidated Schedule of Investments — (Continued)
December 31, 2018
(dollars in thousands)
| Portfolio Company(1)(20) |
Investment Date(26) |
Business Description |
Type of Investment(2)(3)(25) |
Principal(4) |
Cost(4) |
Fair Value(18) |
||||||||||
|---|---|---|---|---|---|---|---|---|---|---|---|---|---|---|---|---|
TVG-I-E CMN ACQUISITION, LLC(10) |
November 3, 2016 | Organic Lead Generation for Online Postsecondary Schools |
||||||||||||||
|
LIBOR Plus 6.00% (Floor 1.00%), Current Coupon 8.52%, Secured Debt (Maturity — November 3, 2021)(9) |
19,503 | 19,191 | 19,454 | ||||||||||||
|
||||||||||||||||
U.S. TelePacific Corp.(11) |
September 14, 2016 | Provider of Communications and Managed Services |
||||||||||||||
|
LIBOR Plus 5.00% (Floor 1.00%), Current Coupon 7.80%, Secured Debt (Maturity — May 2, 2023)(9) |
18,491 | 18,344 | 17,363 | ||||||||||||
|
||||||||||||||||
VIP Cinema Holdings, Inc.(11) |
March 9, 2017 | Supplier of Luxury Seating to the Cinema Industry |
||||||||||||||
|
LIBOR Plus 6.00% (Floor 1.00%), Current Coupon 8.53%, Secured Debt (Maturity — March 1, 2023)(9) |
10,494 | 10,451 | 10,304 | ||||||||||||
|
||||||||||||||||
Vistar Media, Inc.(10) |
February 17, 2017 | Operator of Digital Out-of-Home Advertising Platform |
||||||||||||||
|
LIBOR Plus 10.00% (Floor 1.00%), Current Coupon 12.74%, Secured Debt (Maturity — February 16, 2022)(9) |
3,263 | 3,048 | 2,987 | ||||||||||||
|
Warrants (70,207 equivalent shares; Expiration — February 17, 2027; Strike price — $0.01 per share) |
331 | 790 | |||||||||||||
| | | | | | | | | | | | | | | | | |
|
3,379 | 3,777 | ||||||||||||||
|
||||||||||||||||
Wireless Vision Holdings, LLC(10) |
September 29, 2017 | Provider of Wireless Telecommunications Carrier Services |
||||||||||||||
|
LIBOR Plus 8.91% (Floor 1.00%), Current Coupon 11.41%, Secured Debt (Maturity — September 29, 2022)(9)(28) |
14,279 | 14,055 | 13,414 | ||||||||||||
|
||||||||||||||||
YS Garments, LLC(11) |
August 22, 2018 | Designer and Provider of Branded Activewear |
||||||||||||||
|
LIBOR Plus 6.00% (Floor 1.00%), Current Coupon 8.42% Secured Debt (Maturity — August 9, 2024)(9) |
14,906 | 14,764 | 14,756 | ||||||||||||
|
||||||||||||||||
Zilliant Incorporated |
June 15, 2012 | Price Optimization and Margin Management Solutions |
||||||||||||||
|
Preferred Stock (186,777 shares) |
154 | 260 | |||||||||||||
|
Warrants (952,500 equivalent shares; Expiration — June 15, 2022; Strike price — $0.001 per share) |
1,071 | 1,189 | |||||||||||||
| | | | | | | | | | | | | | | | | |
|
1,225 | 1,449 | ||||||||||||||
|
||||||||||||||||
140
MAIN STREET CAPITAL CORPORATION
Consolidated Schedule of Investments — (Continued)
December 31, 2018
(dollars in thousands)
| Portfolio Company(1)(20) |
Investment Date(26) |
Business Description |
Type of Investment(2)(3)(25) |
Principal(4) |
Cost(4) |
Fair Value(18) |
||||||||||
|---|---|---|---|---|---|---|---|---|---|---|---|---|---|---|---|---|
Subtotal Non-Control/Non-Affiliate Investments (73.8% of net assets at fair value) |
$ | 1,137,108 | $ | 1,089,026 | ||||||||||||
| | | | | | | | | | | | | | | | | |
|
||||||||||||||||
Total Portfolio Investments, December 31, 2018 |
$ | 2,269,033 | $ | 2,453,909 | ||||||||||||
| | | | | | | | | | | | | | | | | |
| | | | | | | | | | | | | | | | | |
| | | | | | | | | | | | | | | | | |
141
MAIN STREET CAPITAL CORPORATION
Consolidated Schedule of Investments — (Continued)
December 31, 2018
(dollars in thousands)
142
MAIN STREET CAPITAL CORPORATION
NOTES TO CONSOLIDATED FINANCIAL STATEMENTS
NOTE A — ORGANIZATION AND BASIS OF PRESENTATION
1. Organization
Main Street Capital Corporation ("MSCC") is a principal investment firm primarily focused on providing customized debt and equity financing to lower middle market ("LMM") companies and debt capital to middle market ("Middle Market") companies. The portfolio investments of MSCC and its consolidated subsidiaries are typically made to support management buyouts, recapitalizations, growth financings, refinancings and acquisitions of companies that operate in a variety of industry sectors. MSCC seeks to partner with entrepreneurs, business owners and management teams and generally provides "one stop" financing alternatives within its LMM portfolio. MSCC and its consolidated subsidiaries invest primarily in secured debt investments, equity investments, warrants and other securities of LMM companies based in the United States and in secured debt investments of Middle Market companies generally headquartered in the United States.
MSCC was formed in March 2007 to operate as an internally managed business development company ("BDC") under the Investment Company Act of 1940, as amended (the "1940 Act"). MSCC wholly owns several investment funds, including Main Street Mezzanine Fund, LP ("MSMF"), Main Street Capital II, LP ("MSC II") and Main Street Capital III, LP ("MSC III" and, collectively with MSMF and MSC II, the "Funds"), and each of their general partners. The Funds are each licensed as a Small Business Investment Company ("SBIC") by the United States Small Business Administration ("SBA"). Because MSCC is internally managed, all of the executive officers and other employees are employed by MSCC. Therefore, MSCC does not pay any external investment advisory fees, but instead directly incurs the operating costs associated with employing investment and portfolio management professionals.
MSC Adviser I, LLC (the "External Investment Manager") was formed in November 2013 as a wholly owned subsidiary of MSCC to provide investment management and other services to parties other than MSCC and its subsidiaries or their portfolio companies ("External Parties") and receives fee income for such services. MSCC has been granted no-action relief by the Securities and Exchange Commission ("SEC") to allow the External Investment Manager to register as a registered investment adviser under the Investment Advisers Act of 1940, as amended. Since the External Investment Manager conducts all of its investment management activities for External Parties, it is accounted for as a portfolio investment of MSCC and is not included as a consolidated subsidiary of MSCC in MSCC's consolidated financial statements.
MSCC has elected to be treated for U.S. federal income tax purposes as a regulated investment company ("RIC") under Subchapter M of the Internal Revenue Code of 1986, as amended (the "Code"). As a result, MSCC generally will not pay corporate-level U.S. federal income taxes on any net ordinary taxable income or capital gains that it distributes to its stockholders.
MSCC has certain direct and indirect wholly owned subsidiaries that have elected to be taxable entities (the "Taxable Subsidiaries"). The primary purpose of the Taxable Subsidiaries is to permit MSCC to hold equity investments in portfolio companies which are "pass-through" entities for tax purposes.
Unless otherwise noted or the context otherwise indicates, the terms "we," "us," "our," the "Company" and "Main Street" refer to MSCC and its consolidated subsidiaries, which include the Funds and the Taxable Subsidiaries.
2. Basis of Presentation
Main Street's consolidated financial statements are prepared in accordance with generally accepted accounting principles in the United States of America ("U.S. GAAP"). The Company is an investment company following accounting and reporting guidance in Financial Accounting Standards Board ("FASB")
143
MAIN STREET CAPITAL CORPORATION
NOTES TO CONSOLIDATED FINANCIAL STATEMENTS — (Continued)
Accounting Standards Codification ("ASC") 946, Financial Services — Investment Companies ("ASC 946"). For each of the periods presented herein, Main Street's consolidated financial statements include the accounts of MSCC and its consolidated subsidiaries. The Investment Portfolio, as used herein, refers to all of Main Street's investments in LMM portfolio companies, investments in Middle Market portfolio companies, Private Loan portfolio investments, Other Portfolio investments and the investment in the External Investment Manager (see "Note C — Fair Value Hierarchy for Investments and Debentures — Portfolio Composition — Investment Portfolio Composition" for additional discussion of Main Street's Investment Portfolio and definitions for the terms Private Loan and Other Portfolio). Main Street's results of operations and cash flows for the years ended December 31, 2019, 2018 and 2017 and financial position as of December 31, 2019 and 2018, are presented on a consolidated basis. The effects of all intercompany transactions between Main Street and its consolidated subsidiaries have been eliminated in consolidation. Certain reclassifications have been made to prior period balances to conform with the current presentation.
Under ASC 946, Main Street is precluded from consolidating other entities in which Main Street has equity investments, including those in which it has a controlling interest, unless the other entity is another investment company. An exception to this general principle in ASC 946 occurs if Main Street holds a controlling interest in an operating company that provides all or substantially all of its services directly to Main Street or to its portfolio companies. Accordingly, as noted above, MSCC's consolidated financial statements include the financial position and operating results for the Funds and the Taxable Subsidiaries. Main Street has determined that all of its portfolio investments do not qualify for this exception, including the investment in the External Investment Manager. Therefore, Main Street's Investment Portfolio is carried on the consolidated balance sheet at fair value, as discussed further in Note B.1., with any adjustments to fair value recognized as "Net Unrealized Appreciation (Depreciation)" on the consolidated statements of operations until the investment is realized, usually upon exit, resulting in any gain or loss being recognized as a "Net Realized Gain (Loss)."
Portfolio Investment Classification
Main Street classifies its Investment Portfolio in accordance with the requirements of the 1940 Act. Under the 1940 Act, (a) "Control Investments" are defined as investments in which Main Street owns more than 25% of the voting securities or has rights to maintain greater than 50% of the board representation, (b) "Affiliate Investments" are defined as investments in which Main Street owns between 5% and 25% (inclusive) of the voting securities and does not have rights to maintain greater than 50% of the board representation, and (c) "Non-Control/Non-Affiliate Investments" are defined as investments that are neither Control Investments nor Affiliate Investments.
NOTE B — SUMMARY OF SIGNIFICANT ACCOUNTING POLICIES
1. Valuation of the Investment Portfolio
Main Street accounts for its Investment Portfolio at fair value. As a result, Main Street follows the provisions of ASC 820, Fair Value Measurements and Disclosures ("ASC 820"). ASC 820 defines fair value, establishes a framework for measuring fair value, establishes a fair value hierarchy based on the quality of inputs used to measure fair value and enhances disclosure requirements for fair value measurements. ASC 820 requires Main Street to assume that the portfolio investment is to be sold in the principal market to independent market participants, which may be a hypothetical market. Market participants are defined as buyers and sellers in the principal market that are independent, knowledgeable and willing and able to transact.
Main Street's portfolio strategy calls for it to invest primarily in illiquid debt and equity securities issued by privately held, LMM companies and more liquid debt securities issued by Middle Market companies that
144
MAIN STREET CAPITAL CORPORATION
NOTES TO CONSOLIDATED FINANCIAL STATEMENTS — (Continued)
are generally larger in size than the LMM companies. Main Street categorizes some of its investments in LMM companies and Middle Market companies as Private Loan portfolio investments, which are primarily debt securities in privately held companies that have been originated through strategic relationships with other investment funds on a collaborative basis, and are often referred to in the debt markets as "club deals." Private Loan investments are typically similar in size, structure, terms and conditions to investments Main Street holds in its LMM portfolio and Middle Market portfolio. Main Street's portfolio also includes Other Portfolio investments which primarily consist of investments that are not consistent with the typical profiles for its LMM portfolio investments, Middle Market portfolio investments or Private Loan portfolio investments, including investments which may be managed by third parties. Main Street's portfolio investments may be subject to restrictions on resale.
LMM investments and Other Portfolio investments generally have no established trading market while Middle Market securities generally have established markets that are not active. Private Loan investments may include investments which have no established trading market or have established markets that are not active. Main Street determines in good faith the fair value of its Investment Portfolio pursuant to a valuation policy in accordance with ASC 820 and a valuation process approved by its Board of Directors and in accordance with the 1940 Act. Main Street's valuation policies and processes are intended to provide a consistent basis for determining the fair value of Main Street's Investment Portfolio.
For LMM portfolio investments, Main Street generally reviews external events, including private mergers, sales and acquisitions involving comparable companies, and includes these events in the valuation process by using an enterprise value waterfall methodology ("Waterfall") for its LMM equity investments and an income approach using a yield-to-maturity model ("Yield-to-Maturity") for its LMM debt investments. For Middle Market portfolio investments, Main Street primarily uses quoted prices in the valuation process. Main Street determines the appropriateness of the use of third-party broker quotes, if any, in determining fair value based on its understanding of the level of actual transactions used by the broker to develop the quote and whether the quote was an indicative price or binding offer, the depth and consistency of broker quotes and the correlation of changes in broker quotes with underlying performance of the portfolio company and other market indices. For Middle Market and Private Loan portfolio investments in debt securities for which it has determined that third-party quotes or other independent pricing are not available or appropriate, Main Street generally estimates the fair value based on the assumptions that it believes hypothetical market participants would use to value the investment in a current hypothetical sale using the Yield-to-Maturity valuation method. For its Other Portfolio equity investments, Main Street generally calculates the fair value of the investment primarily based on the net asset value ("NAV") of the fund and adjusts the fair value for other factors deemed relevant that would affect the fair value of the investment. All of the valuation approaches for Main Street's portfolio investments estimate the value of the investment as if Main Street were to sell, or exit, the investment as of the measurement date.
These valuation approaches consider the value associated with Main Street's ability to control the capital structure of the portfolio company, as well as the timing of a potential exit. For valuation purposes, "control" portfolio investments are composed of debt and equity securities in companies for which Main Street has a controlling interest in the equity ownership of the portfolio company or the ability to nominate a majority of the portfolio company's board of directors. For valuation purposes, "non-control" portfolio investments are generally composed of debt and equity securities in companies for which Main Street does not have a controlling interest in the equity ownership of the portfolio company or the ability to nominate a majority of the portfolio company's board of directors.
Under the Waterfall valuation method, Main Street estimates the enterprise value of a portfolio company using a combination of market and income approaches or other appropriate valuation methods, such as considering recent transactions in the equity securities of the portfolio company or third-party valuations of
145
MAIN STREET CAPITAL CORPORATION
NOTES TO CONSOLIDATED FINANCIAL STATEMENTS — (Continued)
the portfolio company, and then performs a waterfall calculation by allocating the enterprise value over the portfolio company's securities in order of their preference relative to one another. The enterprise value is the fair value at which an enterprise could be sold in a transaction between two willing parties, other than through a forced or liquidation sale. Typically, privately held companies are bought and sold based on multiples of earnings before interest, taxes, depreciation and amortization ("EBITDA"), cash flows, net income, revenues, or in limited cases, book value. There is no single methodology for estimating enterprise value. For any one portfolio company, enterprise value is generally described as a range of values from which a single estimate of enterprise value is derived. In estimating the enterprise value of a portfolio company, Main Street analyzes various factors including the portfolio company's historical and projected financial results. Due to SEC deadlines for Main Street's quarterly and annual financial reporting, the operating results of a portfolio company used in the current period valuation are generally the results from the period ended three months prior to such valuation date and may include unaudited, projected, budgeted or pro forma financial information and may require adjustments for non-recurring items or to normalize the operating results that may require significant judgment in determining. In addition, projecting future financial results requires significant judgment regarding future growth assumptions. In evaluating the operating results, Main Street also analyzes the impact of exposure to litigation, loss of customers or other contingencies. After determining the appropriate enterprise value, Main Street allocates the enterprise value to investments in order of the legal priority of the various components of the portfolio company's capital structure. In applying the Waterfall valuation method, Main Street assumes the loans are paid off at the principal amount in a change in control transaction and are not assumed by the buyer, which Main Street believes is consistent with its past transaction history and standard industry practices.
Under the Yield-to-Maturity valuation method, Main Street also uses the income approach to determine the fair value of debt securities based on projections of the discounted future free cash flows that the debt security will likely generate, including analyzing the discounted cash flows of interest and principal amounts for the debt security, as set forth in the associated loan agreements, as well as the financial position and credit risk of the portfolio company. Main Street's estimate of the expected repayment date of its debt securities is generally the maturity date of the instrument, as Main Street generally intends to hold its loans and debt securities to maturity. The Yield-to-Maturity analysis also considers changes in leverage levels, credit quality, portfolio company performance and other factors. Main Street will generally use the value determined by the Yield-to-Maturity analysis as the fair value for that security; however, because of Main Street's general intent to hold its loans to maturity, the fair value will not exceed the principal amount of the debt security valued using the Yield-to-Maturity valuation method. A change in the assumptions that Main Street uses to estimate the fair value of its debt securities using the Yield-to-Maturity valuation method could have a material impact on the determination of fair value. If there is deterioration in credit quality or if a debt security is in workout status, Main Street may consider other factors in determining the fair value of the debt security, including the value attributable to the debt security from the enterprise value of the portfolio company or the proceeds that would most likely be received in a liquidation analysis.
Under the NAV valuation method, for an investment in an investment fund that does not have a readily determinable fair value, Main Street measures the fair value of the investment predominately based on the NAV of the investment fund as of the measurement date and adjusts the investment's fair value for factors known to Main Street that would affect that fund's NAV, including, but not limited to, fair values for individual investments held by the fund if Main Street holds the same investment or for a publicly traded investment. In addition, in determining the fair value of the investment, Main Street considers whether adjustments to the NAV are necessary in certain circumstances, based on the analysis of any restrictions on redemption of Main Street's investment as of the measurement date, recent actual sales or redemptions of interests in the investment fund, and expected future cash flows available to equity holders, including the rate of return on those cash flows compared to an implied market return on equity required by market
146
MAIN STREET CAPITAL CORPORATION
NOTES TO CONSOLIDATED FINANCIAL STATEMENTS — (Continued)
participants, or other uncertainties surrounding Main Street's ability to realize the full NAV of its interests in the investment fund.
Pursuant to its internal valuation process and the requirements under the 1940 Act, Main Street performs valuation procedures on each of its portfolio investments quarterly. In addition to its internal valuation process, in arriving at estimates of fair value for its investments in its LMM portfolio companies, Main Street, among other things, consults with a nationally recognized independent financial advisory services firm. The nationally recognized independent financial advisory services firm analyzes and provides observations, recommendations and an assurance certification regarding the Company's determinations of the fair value of its LMM portfolio company investments. The nationally recognized independent financial advisory services firm is generally consulted relative to Main Street's investments in each LMM portfolio company at least once every calendar year, and for Main Street's investments in new LMM portfolio companies, at least once in the twelve-month period subsequent to the initial investment. In certain instances, Main Street may determine that it is not cost-effective, and as a result is not in its stockholders' best interest, to consult with the nationally recognized independent financial advisory services firm on its investments in one or more LMM portfolio companies. Such instances include, but are not limited to, situations where the fair value of Main Street's investment in a LMM portfolio company is determined to be insignificant relative to the total Investment Portfolio. Main Street consulted with and received an assurance certification from its independent financial advisory services firm in arriving at Main Street's determination of fair value on its investments in a total of 57 LMM portfolio companies for the year ended December 31, 2019, representing approximately 94% of the total LMM portfolio at fair value as of December 31, 2019, and on a total of 54 LMM portfolio companies for the year ended December 31, 2018, representing approximately 87% of the total LMM portfolio at fair value as of December 31, 2018. Excluding its investments in LMM portfolio companies that, as of December 31, 2019 and 2018, as applicable, had not been in the Investment Portfolio for at least twelve months subsequent to the initial investment or whose primary purpose is to own real estate for which a third-party appraisal is obtained on at least an annual basis, the percentage of the LMM portfolio reviewed and certified by its independent financial advisory services firm for the years ended December 31, 2019 and 2018 was 99% and 98% of the total LMM portfolio at fair value as of December 31, 2019 and 2018, respectively.
For valuation purposes, all of Main Street's Middle Market portfolio investments are non-control investments. To the extent sufficient observable inputs are available to determine fair value, Main Street uses observable inputs to determine the fair value of these investments through obtaining third-party quotes or other independent pricing. For Middle Market portfolio investments for which it has determined that third-party quotes or other independent pricing are not available or appropriate, Main Street generally estimates the fair value based on the assumptions that it believes hypothetical market participants would use to value such Middle Market debt investments in a current hypothetical sale using the Yield-to-Maturity valuation method and such Middle Market equity investments in a current hypothetical sale using the Waterfall valuation method. Because the vast majority of the Middle Market portfolio investments are typically valued using third-party quotes or other independent pricing services (including 91% and 94% of the Middle Market portfolio investments as of December 31, 2019 and 2018, respectively), Main Street generally does not consult with any financial advisory services firms in connection with determining the fair value of its Middle Market investments.
For valuation purposes, all of Main Street's Private Loan portfolio investments are non-control investments. For Private Loan portfolio investments for which it has determined that third-party quotes or other independent pricing are not available or appropriate, Main Street generally estimates the fair value based on the assumptions that it believes hypothetical market participants would use to value such Private Loan debt investments in a current hypothetical sale using the Yield-to-Maturity valuation method and such Private Loan equity investments in a current hypothetical sale using the Waterfall valuation method.
147
MAIN STREET CAPITAL CORPORATION
NOTES TO CONSOLIDATED FINANCIAL STATEMENTS — (Continued)
In addition to its internal valuation process, in arriving at estimates of fair value for its investments in its Private Loan portfolio companies, Main Street, among other things, consults with a nationally recognized independent financial advisory services firm. The nationally recognized independent financial advisory services firm analyzes and provides observations and recommendations and an assurance certification regarding the Company's determinations of the fair value of its Private Loan portfolio company investments. The nationally recognized independent financial advisory services firm is generally consulted relative to Main Street's investments in each Private Loan portfolio company at least once every calendar year, and for Main Street's investments in new Private Loan portfolio companies, at least once in the twelve-month period subsequent to the initial investment. In certain instances, Main Street may determine that it is not cost-effective, and as a result is not in its stockholders' best interest, to consult with the nationally recognized independent financial advisory services firm on its investments in one or more Private Loan portfolio companies. Such instances include, but are not limited to, situations where the fair value of Main Street's investment in a Private Loan portfolio company is determined to be insignificant relative to the total Investment Portfolio. Main Street consulted with and received an assurance certification from its independent financial advisory services firm in arriving at its determination of fair value on its investments in a total of 37 Private Loan portfolio companies for the year ended December 31, 2019, representing approximately 62% of the total Private Loan portfolio at fair value as of December 31, 2019, and on a total of 27 Private Loan portfolio companies for the year ended December 31, 2018, representing approximately 57% of the total Private Loan portfolio at fair value as of December 31, 2018. Excluding its investments in Private Loan portfolio companies that, as of December 31, 2019 and 2018, as applicable, had not been in the Investment Portfolio for at least twelve months subsequent to the initial investment and its investments in Private Loan portfolio companies that were not reviewed because the investment is valued based upon third-party quotes or other independent pricing, the percentage of the Private Loan portfolio reviewed and certified by its independent financial advisory services firm for the years ended December 31, 2019 and 2018 was 94% and 91% of the total Private Loan portfolio at fair value as of December 31, 2019 and 2018, respectively.
For valuation purposes, all of Main Street's Other Portfolio investments are non-control investments. Main Street's Other Portfolio investments comprised 4.1% and 4.4% of Main Street's Investment Portfolio at fair value as of December 31, 2019 and 2018, respectively. Similar to the LMM investment portfolio, market quotations for Other Portfolio equity investments are generally not readily available. For its Other Portfolio equity investments, Main Street generally determines the fair value of these investments using the NAV valuation method.
For valuation purposes, Main Street's investment in the External Investment Manager is a control investment. Market quotations are not readily available for this investment, and as a result, Main Street determines the fair value of the External Investment Manager using the Waterfall valuation method under the market approach. In estimating the enterprise value, Main Street analyzes various factors, including the entity's historical and projected financial results, as well as its size, marketability and performance relative to the population of market comparables. This valuation approach estimates the value of the investment as if Main Street were to sell, or exit, the investment. In addition, Main Street considers its ability to control the capital structure of the company, as well as the timing of a potential exit, in connection with determining the fair value of the External Investment Manager.
Due to the inherent uncertainty in the valuation process, Main Street's determination of fair value for its Investment Portfolio may differ materially from the values that would have been determined had a ready market for the securities existed. In addition, changes in the market environment, portfolio company performance and other events that may occur over the lives of the investments may cause the gains or losses ultimately realized on these investments to be materially different than the valuations currently assigned. Main Street determines the fair value of each individual investment and records changes in fair value as unrealized appreciation or depreciation.
148
MAIN STREET CAPITAL CORPORATION
NOTES TO CONSOLIDATED FINANCIAL STATEMENTS — (Continued)
Main Street uses an internally developed portfolio investment rating system in connection with its investment oversight, portfolio management and analysis and investment valuation procedures for its LMM portfolio companies. This system takes into account both quantitative and qualitative factors of the LMM portfolio company and the investments held therein.
The Board of Directors of Main Street has the final responsibility for overseeing, reviewing and approving, in good faith, Main Street's determination of the fair value for its Investment Portfolio, as well as its valuation procedures, consistent with 1940 Act requirements. Main Street believes its Investment Portfolio as of December 31, 2019 and 2018 approximates fair value as of those dates based on the markets in which Main Street operates and other conditions in existence on those reporting dates.
2. Use of Estimates
The preparation of financial statements in conformity with U.S. GAAP requires management to make estimates and assumptions that affect the reported amounts of assets and liabilities and disclosure of contingent assets and liabilities at the date of the financial statements and the reported amounts of revenue and expenses during the period. Actual results may differ from these estimates under different conditions or assumptions. Additionally, as explained in Note B.1., the consolidated financial statements include investments in the Investment Portfolio whose values have been estimated by Main Street with the oversight, review and approval by Main Street's Board of Directors in the absence of readily ascertainable market values. Because of the inherent uncertainty of the Investment Portfolio valuations, those estimated values may differ materially from the values that would have been determined had a ready market for the securities existed.
3. Cash and Cash Equivalents
Cash and cash equivalents consist of cash and highly liquid investments with an original maturity of three months or less at the date of purchase. Cash and cash equivalents are carried at cost, which approximates fair value.
At December 31, 2019, cash balances totaling $51.2 million exceeded Federal Deposit Insurance Corporation insurance protection levels, subjecting the Company to risk related to the uninsured balance. All of the Company's cash deposits are held at large established high credit quality financial institutions and management believes that the risk of loss associated with any uninsured balances is remote.
4. Interest, Dividend and Fee Income
Main Street records interest and dividend income on the accrual basis to the extent amounts are expected to be collected. Dividend income is recorded as dividends are declared by the portfolio company or at the point an obligation exists for the portfolio company to make a distribution. In accordance with Main Street's valuation policies, Main Street evaluates accrued interest and dividend income periodically for collectability. When a loan or debt security becomes 90 days or more past due, and if Main Street otherwise does not expect the debtor to be able to service all of its debt or other obligations, Main Street will generally place the loan or debt security on non-accrual status and cease recognizing interest income on that loan or debt security until the borrower has demonstrated the ability and intent to pay contractual amounts due. If a loan or debt security's status significantly improves regarding the debtor's ability to service the debt or other obligations, or if a loan or debt security is sold or written-off, Main Street removes it from non-accrual status.
As of December 31, 2019, Main Street's total Investment Portfolio had eight investments on non-accrual status, which comprised approximately 1.4% of its fair value and 4.8% of its cost. As of December 31, 2018,
149
MAIN STREET CAPITAL CORPORATION
NOTES TO CONSOLIDATED FINANCIAL STATEMENTS — (Continued)
Main Street's total Investment Portfolio had six investments on non-accrual status, which comprised approximately 1.3% of its fair value and 3.9% of its cost.
Main Street holds certain debt and preferred equity instruments in its Investment Portfolio that contain payment-in-kind ("PIK") interest and cumulative dividend provisions. The PIK interest, computed at the contractual rate specified in each debt agreement, is periodically added to the principal balance of the debt and is recorded as interest income. Thus, the actual collection of this interest may be deferred until the time of debt principal repayment. Cumulative dividends are recorded as dividend income, and any dividends in arrears are added to the balance of the preferred equity investment. The actual collection of these dividends in arrears may be deferred until such time as the preferred equity is redeemed or sold. To maintain RIC tax treatment (as discussed in Note B.9. below), these non-cash sources of income may need to be paid out to stockholders in the form of distributions, even though Main Street may not have collected the PIK interest and cumulative dividends in cash. Main Street stops accruing PIK interest and cumulative dividends and writes off any accrued and uncollected interest and dividends in arrears when it determines that such PIK interest and dividends in arrears are no longer collectible. For the years ended December 31, 2019, 2018 and 2017, (i) approximately 2.0%, 1.0% and 2.4%, respectively, of Main Street's total investment income was attributable to PIK interest income not paid currently in cash and (ii) approximately 1.0%, 1.0% and 1.6%, respectively, of Main Street's total investment income was attributable to cumulative dividend income not paid currently in cash.
Main Street may periodically provide services, including structuring and advisory services, to its portfolio companies or other third parties. For services that are separately identifiable and evidence exists to substantiate fair value, fee income is recognized as earned, which is generally when the investment or other applicable transaction closes. Fees received in connection with debt financing transactions for services that do not meet these criteria are treated as debt origination fees and are deferred and accreted into income over the life of the financing.
A presentation of total investment income Main Street received from its Investment Portfolio in each of the periods presented is as follows:
| |
Twelve Months Ended December 31, | |||||||||
|---|---|---|---|---|---|---|---|---|---|---|
| |
2019 | 2018 | 2017 | |||||||
| |
(dollars in thousands) |
|||||||||
Interest, fee and dividend income: |
||||||||||
Interest income |
$ | 187,381 | $ | 177,103 | $ | 161,934 | ||||
Dividend income |
49,782 | 46,471 | 34,704 | |||||||
Fee income |
6,210 | 9,781 | 9,103 | |||||||
| | | | | | | | | | | |
Total interest, fee and dividend income |
$ | 243,373 | $ | 233,355 | $ | 205,741 | ||||
| | | | | | | | | | | |
| | | | | | | | | | | |
| | | | | | | | | | | |
5. Deferred Financing Costs
Deferred financing costs include commitment fees and other costs related to Main Street's multi-year revolving credit facility (the "Credit Facility") and its unsecured notes, as well as the commitment fees and leverage fees (approximately 3.4% of the total commitment and draw amounts, as applicable) on the SBIC debentures which are not accounted for under the fair value option under ASC 825 (as discussed further in Note B.11.). See further discussion of Main Street's debt in Note E. Deferred financing costs in connection with the Credit Facility are capitalized as an asset. Deferred financing costs in connection with all other debt arrangements not using the fair value option are a direct deduction from the related debt liability.
150
MAIN STREET CAPITAL CORPORATION
NOTES TO CONSOLIDATED FINANCIAL STATEMENTS — (Continued)
6. Equity Offering Costs
The Company's offering costs are charged against the proceeds from equity offerings when the proceeds are received.
7. Unearned Income — Debt Origination Fees and Original Issue Discount and Discounts/Premiums to Par Value
Main Street capitalizes debt origination fees received in connection with financings and reflects such fees as unearned income netted against the applicable debt investments. The unearned income from the fees is accreted into income based on the effective interest method over the life of the financing.
In connection with its portfolio debt investments, Main Street sometimes receives nominal cost warrants or warrants with an exercise price below the fair value of the underlying equity (together, "nominal cost equity") that are valued as part of the negotiation process with the particular portfolio company. When Main Street receives nominal cost equity, Main Street allocates its cost basis in its investment between its debt security and its nominal cost equity at the time of origination based on amounts negotiated with the particular portfolio company. The allocated amounts are based upon the fair value of the nominal cost equity, which is then used to determine the allocation of cost to the debt security. Any discount recorded on a debt investment resulting from this allocation is reflected as unearned income, which is netted against the applicable debt investment, and accreted into interest income based on the effective interest method over the life of the debt investment. The actual collection of this interest is deferred until the time of debt principal repayment.
Main Street may also purchase debt securities at a discount or at a premium to the par value of the debt security. In the case of a purchase at a discount, Main Street records the investment at the par value of the debt security net of the discount, and the discount is accreted into interest income based on the effective interest method over the life of the debt investment. In the case of a purchase at a premium, Main Street records the investment at the par value of the debt security plus the premium, and the premium is amortized as a reduction to interest income based on the effective interest method over the life of the debt investment.
To maintain RIC tax treatment (as discussed in Note B.9. below), these non-cash sources of income may need to be paid out to stockholders in the form of distributions, even though Main Street may not have collected the interest income. For the years ended December 31, 2019, 2018 and 2017, approximately 2.7%, 3.0% and 3.6%, respectively, of Main Street's total investment income was attributable to interest income from the accretion of discounts associated with debt investments, net of any premium reduction.
8. Share-Based Compensation
Main Street accounts for its share-based compensation plans using the fair value method, as prescribed by ASC 718, Compensation — Stock Compensation. Accordingly, for restricted stock awards, Main Street measures the grant date fair value based upon the market price of its common stock on the date of the grant and amortizes the fair value of the awards as share-based compensation expense over the requisite service period, which is generally the vesting term.
Main Street has also adopted Accounting Standards Update ("ASU") 2016-09, Compensation — Stock Compensation: Improvements to Employee Share-Based Payment Accounting, which requires that all excess tax benefits and tax deficiencies (including tax benefits of dividends on share-based payment awards) be recognized as income tax expense or benefit in the income statement and not delay recognition of a tax benefit until the tax benefit is realized through a reduction to taxes payable. Accordingly, the tax effects of exercised or vested awards are treated as discrete items in the reporting period in which they occur. Additionally, Main Street has elected to account for forfeitures as they occur.
151
MAIN STREET CAPITAL CORPORATION
NOTES TO CONSOLIDATED FINANCIAL STATEMENTS — (Continued)
9. Income Taxes
MSCC has elected to be treated for U.S. federal income tax purposes as a RIC. MSCC's taxable income includes the taxable income generated by MSCC and certain of its subsidiaries, including the Funds, which are treated as disregarded entities for tax purposes. As a RIC, MSCC generally will not pay corporate-level U.S. federal income taxes on any net ordinary taxable income or capital gains that MSCC distributes to its stockholders. MSCC must generally distribute at least 90% of its "investment company taxable income" (which is generally its net ordinary taxable income and realized net short-term capital gains in excess of realized net long-term capital losses) and 90% of its tax-exempt income to maintain its RIC status (pass-through tax treatment for amounts distributed). As part of maintaining RIC status, undistributed taxable income (subject to a 4% non-deductible U.S. federal excise tax) pertaining to a given fiscal year may be distributed up to 12 months subsequent to the end of that fiscal year, provided such dividends are declared on or prior to the later of (i) the filing of the U.S. federal income tax return for the applicable fiscal year or (ii) the fifteenth day of the ninth month following the close of the year in which such taxable income was generated.
The Taxable Subsidiaries primarily hold certain portfolio investments for Main Street. The Taxable Subsidiaries permit Main Street to hold equity investments in portfolio companies which are "pass-through" entities for tax purposes and to continue to comply with the "source-of-income" requirements contained in the RIC tax provisions of the Code. The Taxable Subsidiaries are consolidated with Main Street for U.S. GAAP financial reporting purposes, and the portfolio investments held by the Taxable Subsidiaries are included in Main Street's consolidated financial statements as portfolio investments and recorded at fair value. The Taxable Subsidiaries are not consolidated with MSCC for income tax purposes and may generate income tax expense, or benefit, and tax assets and liabilities, as a result of their ownership of certain portfolio investments. The taxable income, or loss, of the Taxable Subsidiaries may differ from their book income, or loss, due to temporary book and tax timing differences and permanent differences. The Taxable Subsidiaries are each taxed at their normal corporate tax rates based on their taxable income. The income tax expense, or benefit, if any, and the related tax assets and liabilities, of the Taxable Subsidiaries are reflected in Main Street's consolidated financial statements.
The External Investment Manager is an indirect wholly owned subsidiary of MSCC owned through a Taxable Subsidiary and is a disregarded entity for tax purposes. The External Investment Manager has entered into a tax sharing agreement with its Taxable Subsidiary owner. Since the External Investment Manager is accounted for as a portfolio investment of MSCC and is not included as a consolidated subsidiary of MSCC in MSCC's consolidated financial statements, and as a result of the tax sharing agreement with its Taxable Subsidiary owner, for its stand-alone financial reporting purposes the External Investment Manager is treated as if it is taxed at normal corporate tax rates based on its taxable income and, as a result of its activities, may generate income tax expense or benefit. The income tax expense, or benefit, if any, and the related tax assets and liabilities, of the External Investment Manager are reflected in the External Investment Manager's separate financial statements.
In December 2017, the "Tax Cuts and Jobs Act" legislation was enacted. The Tax Cuts and Jobs Act included significant changes to the U.S. corporate tax system, including a U.S. federal corporate income tax rate reduction from 35% to 21% and other changes. ASC 740, Income Taxes, requires the effects of changes in tax rates and laws on deferred tax balances to be recognized in the period in which the legislation was enacted. As such, Main Street has accounted for the tax effects as a result of the enactment of the Tax Cuts and Jobs Act beginning with the period ended December 31, 2017.
The Taxable Subsidiaries and the External Investment Manager use the liability method in accounting for income taxes. Deferred tax assets and liabilities are recorded for temporary differences between the tax basis of assets and liabilities and their reported amounts in the consolidated financial statements, using statutory tax
152
MAIN STREET CAPITAL CORPORATION
NOTES TO CONSOLIDATED FINANCIAL STATEMENTS — (Continued)
rates in effect for the year in which the temporary differences are expected to reverse. A valuation allowance is provided, if necessary, against deferred tax assets when it is more likely than not that some portion or all of the deferred tax asset will not be realized.
Taxable income generally differs from net income for financial reporting purposes due to temporary and permanent differences in the recognition of income and expenses. Taxable income generally excludes net unrealized appreciation or depreciation, as investment gains or losses are not included in taxable income until they are realized. The Company's stockholders' equity includes an adjustment to classification as a result of permanent book-to-tax differences, which include differences in the book and tax treatment of income and expenses.
10. Net Realized Gains or Losses and Net Unrealized Appreciation or Depreciation
Realized gains or losses are measured by the difference between the net proceeds from the sale or redemption of an investment or a financial instrument and the cost basis of the investment or financial instrument, without regard to unrealized appreciation or depreciation previously recognized, and includes investments written-off during the period net of recoveries and realized gains or losses from in-kind redemptions. Net unrealized appreciation or depreciation reflects the net change in the fair value of the Investment Portfolio and financial instruments and the reclassification of any prior period unrealized appreciation or depreciation on exited investments and financial instruments to realized gains or losses.
11. Fair Value of Financial Instruments
Fair value estimates are made at discrete points in time based on relevant information. These estimates may be subjective in nature and involve uncertainties and matters of significant judgment and, therefore, cannot be determined with precision. Main Street believes that the carrying amounts of its financial instruments, consisting of cash and cash equivalents, receivables, payables and other liabilities approximate the fair values of such items due to the short-term nature of these instruments.
As part of Main Street's acquisition of the majority of the equity interests of MSC II in January 2010 (the "MSC II Acquisition"), Main Street elected the fair value option under ASC 825, Financial Instruments ("ASC 825"), relating to accounting for debt obligations at their fair value, for the MSC II SBIC debentures acquired as part of the acquisition accounting related to the MSC II Acquisition and values those obligations as discussed further in Note C. In order to provide for a more consistent basis of presentation, Main Street has continued to elect the fair value option for SBIC debentures issued by MSC II subsequent to the MSC II Acquisition. When the fair value option is elected for a given SBIC debenture, the deferred loan costs associated with the debenture are fully expensed in the current period to "Net Unrealized Appreciation (Depreciation) — SBIC debentures" as part of the fair value adjustment. Interest incurred in connection with SBIC debentures which are valued at fair value is included in interest expense.
12. Earnings per Share
Basic and diluted per share calculations are computed utilizing the weighted-average number of shares of common stock outstanding for the period. In accordance with ASC 260, Earnings Per Share, the unvested shares of restricted stock awarded pursuant to Main Street's equity compensation plans are participating securities and, therefore, are included in the basic earnings per share calculation. As a result, for all periods presented, there is no difference between diluted earnings per share and basic earnings per share amounts.
153
MAIN STREET CAPITAL CORPORATION
NOTES TO CONSOLIDATED FINANCIAL STATEMENTS — (Continued)
13. Recently Issued or Adopted Accounting Standards
In May 2014, the FASB issued ASU 2014-09, Revenue from Contracts with Customers (Topic 606). ASU 2014-09 supersedes the revenue recognition requirements under ASC 605, Revenue Recognition, and most industry-specific guidance throughout the Industry Topics of the ASC. The core principle of the guidance is that an entity should recognize revenue to depict the transfer of promised goods or services to customers in an amount that reflects the consideration to which an entity expects to be entitled in exchange for those goods or services. Under the guidance, an entity is required to perform the following five steps: (1) identify the contract(s) with a customer; (2) identify the performance obligations in the contract; (3) determine the transaction price; (4) allocate the transaction price to the performance obligations in the contract, and (5) recognize revenue when (or as) the entity satisfies a performance obligation. The guidance significantly enhances comparability of revenue recognition practices across entities, industries, jurisdictions and capital markets. Additionally, the guidance requires improved disclosures as to the nature, amount, timing and uncertainty of revenue that is recognized. In March 2016, the FASB issued ASU 2016-08, Revenue from Contracts with Customers (Topic 606): Principal versus Agent Considerations (Reporting Revenue Gross versus Net), which clarified the implementation guidance on principal versus agent considerations. In April 2016, the FASB issued ASU 2016-10, Revenue from Contracts with Customers (Topic 606): Identifying Performance Obligations and Licensing, which clarified the implementation guidance regarding performance obligations and licensing arrangements. In May 2016, the FASB issued ASU No. 2016-12, Revenue from Contracts with Customers (Topic 606) — Narrow-Scope Improvements and Practical Expedients, which clarified guidance on assessing collectability, presenting sales tax, measuring noncash consideration, and certain transition matters. In December 2016, the FASB issued ASU No. 2016-20, Revenue from Contracts with Customers (Topic 606) — Technical Corrections and Improvements, which provided disclosure relief, and clarified the scope and application of the new revenue standard and related cost guidance. The guidance was effective for the annual reporting period beginning after December 15, 2017, including interim periods within that reporting period. Substantially all of Main Street's income is outside the scope of ASU 2014-09. For those income items that are within the scope (primarily fee income), Main Street has similar performance obligations as compared with deliverables and separate units of account previously identified. As a result, Main Street's timing of its income recognition remains the same and the adoption of the standard did not have a material impact on the consolidated financial statements.
In February 2016, the FASB issued ASU 2016-02, Leases, which amended the FASB Accounting Standards Codification and created ASC 842, Leases ("ASC 842"), to require lessees to recognize on the balance sheet a right-of-use asset, representing its right to use the underlying asset for the lease term, and a lease liability for all leases with terms greater than 12 months, utilizing a modified retrospective transition approach, which includes a number of optional practical expedients that entities may elect to apply. The guidance in ASC 842 also requires qualitative and quantitative disclosures designed to assess the amount, timing and uncertainty of cash flows arising from leases. Main Street adopted ASC 842 effective January 1, 2019. Under ASC 842, Main Street evaluates leases to determine if the leases are considered financing or operating leases. Main Street currently has one operating lease for office space for which it has recorded a right-of-use asset and lease liability for the operating lease obligation. Non-lease components (maintenance, property tax, insurance and parking) are not included in the lease cost. The lease asset is presented as a single lease cost that is amortized on a straight-line basis over the life of the lease.
In August 2016, the FASB issued ASU 2016-15, Statement of Cash Flows (Topic 230), which is intended to reduce the existing diversity in practice in how certain cash receipts and cash payments are presented and classified in the statement of cash flows. The guidance was effective for annual periods beginning after December 15, 2017, and interim periods therein. Main Street adopted ASU 2016-15 effective January 1, 2018. The impact of the adoption of this accounting standard on Main Street's consolidated financial statements was not material.
154
MAIN STREET CAPITAL CORPORATION
NOTES TO CONSOLIDATED FINANCIAL STATEMENTS — (Continued)
In August 2018, the FASB issued ASU 2018-13, Fair Value Measurement (Topic 820), which is intended to improve fair value and defined benefit disclosure requirements by removing disclosures that are not cost beneficial, clarifying disclosures' specific requirements, and adding relevant disclosure requirements. The amendments take effect for all organizations for fiscal years, and interim periods within those fiscal years, beginning after December 15, 2019. Early adoption is permitted. Main Street elected to early adopt ASU 2018-13 during the year ended December 31, 2018. No significant changes to the fair value disclosures were necessary in the notes to the consolidated financial statements in order to comply with ASU 2018-13.
In August 2018, the SEC adopted rules (the "SEC Release") amending certain disclosure requirements intended to eliminate redundant, duplicative, overlapping, outdated, or superseded, in light of other SEC disclosure requirements, U.S. GAAP requirements or changes in the information environment. In part, the SEC Release requires an investment company to present distributable earnings in total on the consolidated balance sheet and consolidated statement of changes in net assets, rather than showing the three components of distributable earnings as previously shown. Main Street adopted this part of the SEC Release during the year ended December 31, 2018. The impact of the adoption of these rules on Main Street's consolidated financial statements was not material. Additionally, the SEC Release requires disclosure of changes in net assets within a registrant's Form 10-Q filing on a quarter-to-date and year-to-date basis for both the current year and prior year comparative periods. Main Street adopted the new requirement to present changes in net assets in interim financial statements within Form 10-Q filings effective January 1, 2019. The adoption of these rules did not have a material impact on the consolidated financial statements.
From time to time, new accounting pronouncements are issued by the FASB or other standards setting bodies that are adopted by Main Street as of the specified effective date. Main Street believes that the impact of recently issued standards and any that are not yet effective will not have a material impact on its consolidated financial statements upon adoption.
NOTE C — FAIR VALUE HIERARCHY FOR INVESTMENTS AND DEBENTURES — PORTFOLIO COMPOSITION
ASC 820 defines fair value, establishes a framework for measuring fair value, establishes a fair value hierarchy based on the quality of inputs used to measure fair value, and enhances disclosure requirements for fair value measurements. Main Street accounts for its investments at fair value.
Fair Value Hierarchy
In accordance with ASC 820, Main Street has categorized its investments based on the priority of the inputs to the valuation technique into a three-level fair value hierarchy. The fair value hierarchy gives the highest priority to quoted prices in active markets for identical investments (Level 1) and the lowest priority to unobservable inputs (Level 3).
Investments recorded on Main Street's balance sheet are categorized based on the inputs to the valuation techniques as follows:
Level 1 — Investments whose values are based on unadjusted quoted prices for identical assets in an active market that Main Street has the ability to access (examples include investments in active exchange-traded equity securities and investments in most U.S. government and agency securities).
Level 2 — Investments whose values are based on quoted prices in markets that are not active or model inputs that are observable either directly or indirectly for substantially the full term of the investment. Level 2 inputs include the following:
155
MAIN STREET CAPITAL CORPORATION
NOTES TO CONSOLIDATED FINANCIAL STATEMENTS — (Continued)
Level 3 — Investments whose values are based on prices or valuation techniques that require inputs that are both unobservable and significant to the overall fair value measurement (for example, investments in illiquid securities issued by privately held companies). These inputs reflect management's own assumptions about the assumptions a market participant would use in pricing the investment.
As required by ASC 820, when the inputs used to measure fair value fall within different levels of the hierarchy, the level within which the fair value measurement is categorized is based on the lowest level input that is significant to the fair value measurement in its entirety. For example, a Level 3 fair value measurement may include inputs that are observable (Levels 1 and 2) and unobservable (Level 3). Therefore, unrealized appreciation and depreciation related to such investments categorized within the Level 3 tables below may include changes in fair value that are attributable to both observable inputs (Levels 1 and 2) and unobservable inputs (Level 3).
As of December 31, 2019 and 2018, all of Main Street's LMM portfolio investments consisted of illiquid securities issued by privately held companies. As a result, the fair value determination for all of Main Street's LMM portfolio investments primarily consisted of unobservable inputs. As a result, all of Main Street's LMM portfolio investments were categorized as Level 3 as of December 31, 2019 and 2018
As of December 31, 2019 and 2018, Main Street's Middle Market portfolio investments consisted primarily of investments in secured and unsecured debt investments and independently rated debt investments. The fair value determination for these investments consisted of a combination of observable inputs in non-active markets for which sufficient observable inputs were not available to determine the fair value of these investments and unobservable inputs. As a result, all of Main Street's Middle Market portfolio investments were categorized as Level 3 as of December 31, 2019 and 2018.
As of December 31, 2019 and 2018, Main Street's Private Loan portfolio investments primarily consisted of investments in interest-bearing secured debt investments. The fair value determination for these investments consisted of a combination of observable inputs in non-active markets for which sufficient observable inputs were not available to determine the fair value of these investments and unobservable inputs. As a result, all of Main Street's Private Loan portfolio investments were categorized as Level 3 as of December 31, 2019 and 2018.
As of December 31, 2019 and 2018, Main Street's Other Portfolio investments consisted of illiquid securities issued by privately held companies. The fair value determination for these investments primarily consisted of unobservable inputs. As a result, all of Main Street's Other Portfolio investments were categorized as Level 3 as of December 31, 2019 and 2018.
The fair value determination of each portfolio investment categorized as Level 3 required one or more of the following unobservable inputs:
156
MAIN STREET CAPITAL CORPORATION
NOTES TO CONSOLIDATED FINANCIAL STATEMENTS — (Continued)
The use of significant unobservable inputs creates uncertainty in the measurement of fair value as of the reporting date. The significant unobservable inputs used in the fair value measurement of Main Street's LMM equity securities, which are generally valued through an average of the discounted cash flow technique and the market comparable/enterprise value technique (unless one of these approaches is determined to not be appropriate), are (i) EBITDA multiples and (ii) the weighted-average cost of capital ("WACC"). Significant increases (decreases) in EBITDA multiple inputs in isolation would result in a significantly higher (lower) fair value measurement. On the contrary, significant increases (decreases) in WACC inputs in isolation would result in a significantly lower (higher) fair value measurement. The significant unobservable inputs used in the fair value measurement of Main Street's LMM, Middle Market and Private Loan securities are (i) risk adjusted discount rates used in the Yield-to-Maturity valuation technique (see "Note B.1. — Valuation of the Investment Portfolio") and (ii) the percentage of expected principal recovery. Significant increases (decreases) in any of these discount rates in isolation would result in a significantly lower (higher) fair value measurement. Significant increases (decreases) in any of these expected principal recovery percentages in isolation would result in a significantly higher (lower) fair value measurement. However, due to the nature of certain investments, fair value measurements may be based on other criteria, such as third-party appraisals of collateral and fair values as determined by independent third parties, which are not presented in the tables below.
157
MAIN STREET CAPITAL CORPORATION
NOTES TO CONSOLIDATED FINANCIAL STATEMENTS — (Continued)
The following tables provide a summary of the significant unobservable inputs used to fair value Main Street's Level 3 portfolio investments as of December 31, 2019 and 2018:
Type of Investment
|
Fair Value as of December 31, 2019 (in thousands) |
Valuation Technique | Significant Unobservable Inputs |
Range(3) | Weighted Average(3) |
Median(3) | ||||||||||
|---|---|---|---|---|---|---|---|---|---|---|---|---|---|---|---|---|
Equity investments |
$ | 819,749 | Discounted cash flow |
WACC |
9.6% - 20.3% | 13.6% | 14.2% | |||||||||
|
Market comparable / Enterprise Value |
EBITDA multiple(1) |
4.9x - 8.5x(2) | 7.2x | 6.4x | |||||||||||
Debt investments |
$ |
1,212,741 |
Discounted cash flow |
Risk adjusted discount factor |
5.9% - 16.5%(2) |
10.4% |
10.0% |
|||||||||
|
Expected principal recovery percentage |
1.4% - 100.0% | 99.3% | 100.0% | ||||||||||||
Debt investments |
$ |
569,834 |
Market approach |
Third-party quote |
28.1 - 101.0 |
94.7 |
98.0 |
|||||||||
| | | | | | | | | | | | | | | | | |
Total Level 3 investments |
$ | 2,602,324 | ||||||||||||||
Type of Investment
|
Fair Value as of December 31, 2018 (in thousands) |
Valuation Technique | Significant Unobservable Inputs |
Range(3) | Weighted Average(3) |
Median(3) | ||||||||||
|---|---|---|---|---|---|---|---|---|---|---|---|---|---|---|---|---|
Equity investments |
$ | 767,156 | Discounted cash flow |
WACC |
9.9% - 20.7% | 13.7% | 14.3% | |||||||||
|
Market comparable / Enterprise Value |
EBITDA multiple(1) |
4.7x - 8.0x(2) | 7.0x | 6.0x | |||||||||||
Debt investments |
$ | 1,039,453 | Discounted cash flow |
Risk adjusted discount factor |
8.5% - 17.0%(2) | 12.2% | 12.0% | |||||||||
|
Expected principal recovery percentage |
1.5% - 100.0% | 99.3% | 100.0% | ||||||||||||
Debt investments |
$ | 647,300 | Market approach |
Third-party quote |
37.5 - 101.0 | 96.0 | 98.3 | |||||||||
| | | | | | | | | | | | | | | | | |
Total Level 3 investments |
$ | 2,453,909 | ||||||||||||||
158
MAIN STREET CAPITAL CORPORATION
NOTES TO CONSOLIDATED FINANCIAL STATEMENTS — (Continued)
The following tables provide a summary of changes in fair value of Main Street's Level 3 portfolio investments for the years ended December 31, 2019 and 2018 (amounts in thousands):
Type of Investment |
Fair Value as of December 31, 2018 |
Transfers Into Level 3 Hierarchy |
Redemptions/ Repayments |
New Investments |
Net Changes from Unrealized to Realized |
Net Unrealized Appreciation (Depreciation) |
Other(1) | Fair Value as of December 31, 2019 |
|||||||||||||||||
|---|---|---|---|---|---|---|---|---|---|---|---|---|---|---|---|---|---|---|---|---|---|---|---|---|---|
Debt |
$ | 1,686,753 | $ | — | $ | (471,923 | ) | $ | 595,285 | $ | 35,204 | $ | (43,969 | ) | $ | (18,775 | ) | $ | 1,782,575 | ||||||
Equity |
$ | 755,710 | $ | — | $ | (24,322 | ) | $ | 46,046 | $ | (15,287 | ) | $ | 26,809 | $ | 20,582 | $ | 809,538 | |||||||
Equity Warrant |
$ | 11,446 | $ | — | $ | 1,217 | $ | 316 | $ | (1,090 | ) | $ | 129 | $ | (1,807 | ) | $ | 10,211 | |||||||
| | | | | | | | | | | | | | | | | | | | | | | | | | |
|
$ | 2,453,909 | $ | — | $ | (495,028 | ) | $ | 641,647 | $ | 18,827 | $ | (17,031 | ) | $ | — | $ | 2,602,324 | |||||||
| | | | | | | | | | | | | | | | | | | | | | | | | | |
| | | | | | | | | | | | | | | | | | | | | | | | | | |
| | | | | | | | | | | | | | | | | | | | | | | | | | |
Type of Investment |
Fair Value as of December 31, 2017 |
Transfers Into Level 3 Hierarchy |
Redemptions/ Repayments |
New Investments |
Net Changes from Unrealized to Realized |
Net Unrealized Appreciation (Depreciation) |
Other(1) | Fair Value as of December 31, 2018 |
|||||||||||||||||
|---|---|---|---|---|---|---|---|---|---|---|---|---|---|---|---|---|---|---|---|---|---|---|---|---|---|
Debt |
$ | 1,518,297 | $ | — | $ | (653,200 | ) | $ | 837,162 | $ | 38,722 | $ | (45,778 | ) | $ | (8,450 | ) | $ | 1,686,753 | ||||||
Equity |
641,493 | — | (48,585 | ) | 114,639 | (33,971 | ) | 73,684 | 8,450 | 755,710 | |||||||||||||||
Equity Warrant |
11,515 | — | (680 | ) | 181 | (720 | ) | 1,150 | — | 11,446 | |||||||||||||||
| | | | | | | | | | | | | | | | | | | | | | | | | | |
|
$ | 2,171,305 | $ | — | $ | (702,465 | ) | $ | 951,982 | $ | 4,031 | $ | 29,056 | $ | — | $ | 2,453,909 | ||||||||
| | | | | | | | | | | | | | | | | | | | | | | | | | |
| | | | | | | | | | | | | | | | | | | | | | | | | | |
| | | | | | | | | | | | | | | | | | | | | | | | | | |
As of December 31, 2019 and 2018, the fair value determination for the SBIC debentures recorded at fair value primarily consisted of unobservable inputs. As a result, the SBIC debentures which are recorded at fair value were categorized as Level 3. Main Street determines the fair value of these instruments primarily using a Yield-to-Maturity approach that analyzes the discounted cash flows of interest and principal for each SBIC debenture recorded at fair value based on estimated market interest rates for debt instruments of similar structure, terms, and maturity. Main Street's estimate of the expected repayment date of principal for each SBIC debenture recorded at fair value is the legal maturity date of the instrument. The significant unobservable inputs used in the fair value measurement of Main Street's SBIC debentures recorded at fair value are the estimated market interest rates used to fair value each debenture using the yield valuation technique described above. Significant increases (decreases) in the estimated market interest rates in isolation would result in a significantly lower (higher) fair value measurement.
The following tables provide a summary of the significant unobservable inputs used to fair value Main Street's Level 3 SBIC debentures as of December 31, 2019 and 2018 (amounts in thousands):
Type of Instrument
|
Fair Value as of December 31, 2019 |
Valuation Technique | Significant Unobservable Inputs |
Range | Weighted Average |
||||||||
|---|---|---|---|---|---|---|---|---|---|---|---|---|---|
SBIC debentures |
$ | 21,927 | Discounted cash flow | Estimated market interest rates | 3.2% - 3.5% | 3.2 | % | ||||||
Type of Instrument
|
Fair Value as of December 31, 2018 |
Valuation Technique | Significant Unobservable Inputs |
Range | Weighted Average |
||||||||
|---|---|---|---|---|---|---|---|---|---|---|---|---|---|
SBIC debentures |
$ | 44,688 | Discounted cash flow | Estimated market interest rates | 5.5% - 5.8% | 5.6 | % | ||||||
159
MAIN STREET CAPITAL CORPORATION
NOTES TO CONSOLIDATED FINANCIAL STATEMENTS — (Continued)
The following tables provide a summary of changes for the Level 3 SBIC debentures recorded at fair value for the years ended December 31, 2019 and 2018 (amounts in thousands):
Type of Instrument
|
Fair Value as of December 31, 2018 |
Repayments | Net Realized Loss |
New SBIC Debentures |
Net Unrealized (Appreciation) Depreciation |
Fair Value as of December 31, 2019 |
|||||||||||||
|---|---|---|---|---|---|---|---|---|---|---|---|---|---|---|---|---|---|---|---|
SBIC debentures at fair value |
$ | 44,688 | $ | (24,000 | ) | $ | 5,689 | $ | — | $ | (4,450 | ) | $ | 21,927 | |||||
| | | | | | | | | | | | | | | | | | | | |
| | | | | | | | | | | | | | | | | | | | |
| | | | | | | | | | | | | | | | | | | | |
Type of Instrument
|
Fair Value as of December 31, 2017 |
Repayments | Net Realized Loss |
New SBIC Debentures |
Net Unrealized (Appreciation) Depreciation |
Fair Value as of December 31, 2018 |
|||||||||||||
|---|---|---|---|---|---|---|---|---|---|---|---|---|---|---|---|---|---|---|---|
SBIC debentures at fair value |
$ | 48,608 | $ | (4,000 | ) | $ | 1,374 | $ | — | $ | (1,294 | ) | $ | 44,688 | |||||
| | | | | | | | | | | | | | | | | | | | |
| | | | | | | | | | | | | | | | | | | | |
| | | | | | | | | | | | | | | | | | | | |
At December 31, 2019 and 2018, Main Street's investments and SBIC debentures at fair value were categorized as follows in the fair value hierarchy for ASC 820 purposes:
| |
|
Fair Value Measurements | |||||||||||
|---|---|---|---|---|---|---|---|---|---|---|---|---|---|
| |
|
(in thousands) |
|||||||||||
At December 31, 2019
|
Fair Value | Quoted Prices in Active Markets for Identical Assets (Level 1) |
Significant Other Observable Inputs (Level 2) |
Significant Unobservable Inputs (Level 3) |
|||||||||
LMM portfolio investments |
$ | 1,206,865 | $ | — | $ | — | $ | 1,206,865 | |||||
Middle Market portfolio investments |
522,083 | — | — | 522,083 | |||||||||
Private Loan portfolio investments |
692,117 | — | — | 692,117 | |||||||||
Other Portfolio investments |
106,739 | — | — | 106,739 | |||||||||
External Investment Manager |
74,520 | — | — | 74,520 | |||||||||
| | | | | | | | | | | | | | |
Total investments |
$ | 2,602,324 | $ | — | $ | — | $ | 2,602,324 | |||||
| | | | | | | | | | | | | | |
| | | | | | | | | | | | | | |
| | | | | | | | | | | | | | |
SBIC debentures at fair value |
$ | 21,927 | $ | — | $ | — | $ | 21,927 | |||||
| | | | | | | | | | | | | | |
| | | | | | | | | | | | | | |
| | | | | | | | | | | | | | |
| |
|
Fair Value Measurements | |||||||||||
|---|---|---|---|---|---|---|---|---|---|---|---|---|---|
| |
|
(in thousands) |
|||||||||||
At December 31, 2018
|
Fair Value | Quoted Prices in Active Markets for Identical Assets (Level 1) |
Significant Other Observable Inputs (Level 2) |
Significant Unobservable Inputs (Level 3) |
|||||||||
LMM portfolio investments |
$ | 1,195,035 | $ | — | $ | — | $ | 1,195,035 | |||||
Middle Market portfolio investments |
576,929 | — | — | 576,929 | |||||||||
Private Loan portfolio investments |
507,892 | — | — | 507,892 | |||||||||
Other Portfolio investments |
108,305 | — | — | 108,305 | |||||||||
External Investment Manager |
65,748 | — | — | 65,748 | |||||||||
| | | | | | | | | | | | | | |
Total investments |
$ | 2,453,909 | $ | — | $ | — | $ | 2,453,909 | |||||
| | | | | | | | | | | | | | |
| | | | | | | | | | | | | | |
| | | | | | | | | | | | | | |
SBIC debentures at fair value |
$ | 44,688 | $ | — | $ | — | $ | 44,688 | |||||
| | | | | | | | | | | | | | |
| | | | | | | | | | | | | | |
| | | | | | | | | | | | | | |
160
MAIN STREET CAPITAL CORPORATION
NOTES TO CONSOLIDATED FINANCIAL STATEMENTS — (Continued)
Investment Portfolio Composition
Main Street's LMM portfolio investments primarily consist of secured debt, equity warrants and direct equity investments in privately held, LMM companies based in the United States. Main Street's LMM portfolio companies generally have annual revenues between $10 million and $150 million, and its LMM investments generally range in size from $5 million to $50 million. The LMM debt investments are typically secured by either a first or second priority lien on the assets of the portfolio company, can include either fixed or floating rate terms and generally have a term of between five and seven years from the original investment date. In most LMM portfolio investments, Main Street receives nominally priced equity warrants and/or makes direct equity investments in connection with a debt investment.
Main Street's Middle Market portfolio investments primarily consist of direct investments in or secondary purchases of interest-bearing debt securities in privately held companies based in the United States that are generally larger in size than the companies included in Main Street's LMM portfolio. Main Street's Middle Market portfolio companies generally have annual revenues between $150 million and $1.5 billion, and its Middle Market investments generally range in size from $3 million to $20 million. Main Street's Middle Market portfolio debt investments are generally secured by either a first or second priority lien on the assets of the portfolio company and typically have a term of between three and seven years from the original investment date.
Main Street's private loan ("Private Loan") portfolio investments are primarily debt securities in privately held companies which have been originated through strategic relationships with other investment funds on a collaborative basis, and are often referred to in the debt markets as "club deals." Private Loan investments are typically similar in size, structure, terms and conditions to investments Main Street holds in its LMM portfolio and Middle Market portfolio. Main Street's Private Loan portfolio debt investments are generally secured by either a first or second priority lien on the assets of the portfolio company and typically have a term of between three and seven years from the original investment date.
Main Street's other portfolio ("Other Portfolio") investments primarily consist of investments which are not consistent with the typical profiles for LMM, Middle Market and Private Loan portfolio investments, including investments which may be managed by third parties. In the Other Portfolio, Main Street may incur indirect fees and expenses in connection with investments managed by third parties, such as investments in other investment companies or private funds. For Other Portfolio investments, Main Street generally receives distributions related to the assets held by the portfolio company. Those assets are typically expected to be liquidated over a five to ten year period.
Main Street's external asset management business is conducted through its External Investment Manager. The External Investment Manager earns management fees based on the assets of the funds under management and may earn incentive fees, or a carried interest, based on the performance of the funds managed. Main Street entered into an agreement with the External Investment Manager to share employees in connection with its asset management business generally, and specifically for its relationship with HMS Income Fund, Inc. ("HMS Income"). Through this agreement, Main Street shares employees with the External Investment Manager, including their related infrastructure, business relationships, management expertise and capital raising capabilities. Main Street allocates the related expenses to the External Investment Manager pursuant to the sharing agreement. Main Street's total expenses for the years ended December 31, 2019, 2018 and 2017 are net of expenses allocated to the External Investment Manager of $6.7 million, $6.8 million and $6.4 million, respectively.
Investment income, consisting of interest, dividends and fees, can fluctuate dramatically due to various factors, including the level of new investment activity, repayments of debt investments or sales of equity interests. Investment income in any given year could also be highly concentrated among several portfolio
161
MAIN STREET CAPITAL CORPORATION
NOTES TO CONSOLIDATED FINANCIAL STATEMENTS — (Continued)
companies. For the years ended December 31, 2019, 2018 and 2017, Main Street did not record investment income from any single portfolio company in excess of 10% of total investment income.
The following tables provide a summary of Main Street's investments in the LMM, Middle Market and Private Loan portfolios as of December 31, 2019 and 2018 (this information excludes the Other Portfolio investments and the External Investment Manager which are discussed further below):
| |
As of December 31, 2019 | |||||||||
|---|---|---|---|---|---|---|---|---|---|---|
| |
LMM(a) | Middle Market |
Private Loan |
|||||||
| |
(dollars in millions) |
|||||||||
Number of portfolio companies |
69 | 51 | 65 | |||||||
Fair value |
$ | 1,206.9 | $ | 522.1 | $ | 692.1 | ||||
Cost |
$ | 1,002.2 | $ | 572.3 | $ | 734.8 | ||||
% of portfolio at cost — debt |
65.9% | 94.8% | 94.6% | |||||||
% of portfolio at cost — equity |
34.1% | 5.2% | 5.4% | |||||||
% of debt investments at cost secured by first priority lien |
98.1% | 91.3% | 95.4% | |||||||
Weighted-average annual effective yield(b) |
11.8% | 8.6% | 9.5% | |||||||
Average EBITDA(c) |
$ | 5.1 | $ | 85.0 | $ | 57.8 | ||||
162
MAIN STREET CAPITAL CORPORATION
NOTES TO CONSOLIDATED FINANCIAL STATEMENTS — (Continued)
investments in these portfolio companies, and those portfolio companies whose primary purpose is to own real estate.
| |
As of December 31, 2018 | |||||||||
|---|---|---|---|---|---|---|---|---|---|---|
| |
LMM(a) | Middle Market |
Private Loan |
|||||||
| |
(dollars in millions) |
|||||||||
Number of portfolio companies |
69 | 56 | 59 | |||||||
Fair value |
$ | 1,195.0 | $ | 576.9 | $ | 507.9 | ||||
Cost |
$ | 990.9 | $ | 608.8 | $ | 553.3 | ||||
% of portfolio at cost — debt |
68.7% | 96.3% | 93.0% | |||||||
% of portfolio at cost — equity |
31.3% | 3.7% | 7.0% | |||||||
% of debt investments at cost secured by first priority lien |
98.5% | 87.9% | 92.0% | |||||||
Weighted-average annual effective yield(b) |
12.3% | 9.6% | 10.4% | |||||||
Average EBITDA(c) |
$ | 4.7 | $ | 99.1 | $ | 46.1 | ||||
As of December 31, 2019, Main Street had Other Portfolio investments in eleven companies, collectively totaling approximately $106.7 million in fair value and approximately $118.4 million in cost basis and which comprised approximately 4.1% of Main Street's Investment Portfolio at fair value. As of December 31, 2018, Main Street had Other Portfolio investments in eleven companies, collectively totaling approximately $108.3 million in fair value and approximately $116.0 million in cost basis and which comprised approximately 4.4% of Main Street's Investment Portfolio at fair value.
As discussed further in Note A.1., Main Street holds an investment in the External Investment Manager, a wholly owned subsidiary that is treated as a portfolio investment. As of December 31, 2019, there was no cost basis in this investment and the investment had a fair value of approximately $74.5 million, which comprised approximately 2.9% of Main Street's Investment Portfolio at fair value. As of December 31, 2018, there was no cost basis in this investment and the investment had a fair value of approximately $65.7 million, which comprised approximately 2.7% of Main Street's Investment Portfolio at fair value.
The following tables summarize the composition of Main Street's total combined LMM portfolio investments, Middle Market portfolio investments and Private Loan portfolio investments at cost and fair value by type of investment as a percentage of the total combined LMM portfolio investments, Middle
163
MAIN STREET CAPITAL CORPORATION
NOTES TO CONSOLIDATED FINANCIAL STATEMENTS — (Continued)
Market portfolio investments and Private Loan portfolio investments, as of December 31, 2019 and 2018 (this information excludes the Other Portfolio investments and the External Investment Manager).
Cost:
|
December 31, 2019 |
December 31, 2018 |
|||||
|---|---|---|---|---|---|---|---|
First lien debt |
78.2% | 77.1% | |||||
Equity |
17.2% | 16.6% | |||||
Second lien debt |
3.5% | 5.3% | |||||
Equity warrants |
0.6% | 0.6% | |||||
Other |
0.5% | 0.4% | |||||
| | | | | | | | |
|
100.0% | 100.0% | |||||
| | | | | | | | |
| | | | | | | | |
| | | | | | | | |
Fair Value:
|
December 31, 2019 |
December 31, 2018 |
|||||
|---|---|---|---|---|---|---|---|
First lien debt |
70.1% | 69.0% | |||||
Equity |
26.0% | 25.5% | |||||
Second lien debt |
3.0% | 4.6% | |||||
Equity warrants |
0.4% | 0.5% | |||||
Other |
0.5% | 0.4% | |||||
| | | | | | | | |
|
100.0% | 100.0% | |||||
| | | | | | | | |
| | | | | | | | |
| | | | | | | | |
The following tables summarize the composition of Main Street's total combined LMM portfolio investments, Middle Market portfolio investments and Private Loan portfolio investments by geographic region of the United States and other countries at cost and fair value as a percentage of the total combined LMM portfolio investments, Middle Market portfolio investments and Private Loan portfolio investments, as of December 31, 2019 and 2018 (this information excludes the Other Portfolio investments and the External Investment Manager). The geographic composition is determined by the location of the corporate headquarters of the portfolio company.
Cost:
|
December 31, 2019 |
December 31, 2018 |
|||||
|---|---|---|---|---|---|---|---|
Southwest |
25.0% | 26.7% | |||||
West |
24.6% | 27.2% | |||||
Midwest |
20.6% | 19.4% | |||||
Northeast |
14.8% | 14.3% | |||||
Southeast |
13.2% | 10.0% | |||||
Canada |
1.2% | 1.4% | |||||
Other Non-United States |
0.6% | 1.0% | |||||
| | | | | | | | |
|
100.0% | 100.0% | |||||
| | | | | | | | |
| | | | | | | | |
| | | | | | | | |
164
MAIN STREET CAPITAL CORPORATION
NOTES TO CONSOLIDATED FINANCIAL STATEMENTS — (Continued)
Fair Value:
|
December 31, 2019 |
December 31, 2018 |
|||||
|---|---|---|---|---|---|---|---|
Southwest |
26.7% | 28.4% | |||||
West |
25.1% | 28.2% | |||||
Midwest |
20.6% | 18.9% | |||||
Northeast |
14.4% | 13.4% | |||||
Southeast |
11.6% | 8.9% | |||||
Canada |
1.1% | 1.2% | |||||
Other Non-United States |
0.5% | 1.0% | |||||
| | | | | | | | |
|
100.0% | 100.0% | |||||
| | | | | | | | |
| | | | | | | | |
| | | | | | | | |
Main Street's LMM portfolio investments, Middle Market portfolio investments and Private Loan portfolio investments are in companies conducting business in a variety of industries. The following tables summarize the composition of Main Street's total combined LMM portfolio investments, Middle Market portfolio investments and Private Loan portfolio investments by industry at cost and fair value as of
165
MAIN STREET CAPITAL CORPORATION
NOTES TO CONSOLIDATED FINANCIAL STATEMENTS — (Continued)
December 31, 2019 and 2018 (this information excludes the Other Portfolio investments and the External Investment Manager).
Cost:
|
December 31, 2019 |
December 31, 2018 |
|||||
|---|---|---|---|---|---|---|---|
Machinery |
7.7% | 6.5% | |||||
Commercial Services & Supplies |
6.1% | 4.9% | |||||
Construction & Engineering |
5.4% | 7.5% | |||||
Energy Equipment & Services |
5.4% | 6.4% | |||||
Media |
5.3% | 6.5% | |||||
Aerospace & Defense |
4.9% | 3.8% | |||||
IT Services |
4.6% | 3.8% | |||||
Health Care Providers & Services |
4.5% | 2.8% | |||||
Internet Software & Services |
4.1% | 4.1% | |||||
Diversified Telecommunication Services |
3.9% | 4.8% | |||||
Leisure Equipment & Products |
3.8% | 3.9% | |||||
Hotels, Restaurants & Leisure |
3.7% | 3.3% | |||||
Oil, Gas & Consumable Fuels |
3.6% | 3.0% | |||||
Electronic Equipment, Instruments & Components |
3.5% | 3.5% | |||||
Specialty Retail |
3.1% | 4.2% | |||||
Communications Equipment |
3.1% | 2.5% | |||||
Food Products |
3.0% | 3.8% | |||||
Professional Services |
2.9% | 2.6% | |||||
Software |
2.4% | 2.6% | |||||
Computers & Peripherals |
2.3% | 2.6% | |||||
Diversified Financial Services |
1.9% | 0.6% | |||||
Containers & Packaging |
1.7% | 1.9% | |||||
Road & Rail |
1.4% | 1.8% | |||||
Building Products |
1.3% | 1.6% | |||||
Distributors |
1.1% | 1.7% | |||||
Construction Materials |
1.0% | 1.8% | |||||
Transportation Infrastructure |
1.0% | 0.5% | |||||
Food & Staples Retailing |
1.0% | 0.8% | |||||
Chemicals |
1.0% | 0.0% | |||||
Internet & Catalog Retail |
0.9% | 1.1% | |||||
Other(1) |
4.4% | 5.1% | |||||
| | | | | | | | |
|
100.0% | 100.0% | |||||
| | | | | | | | |
| | | | | | | | |
| | | | | | | | |
166
MAIN STREET CAPITAL CORPORATION
NOTES TO CONSOLIDATED FINANCIAL STATEMENTS — (Continued)
Fair Value:
|
December 31, 2019 |
December 31, 2018 |
|||||
|---|---|---|---|---|---|---|---|
Machinery |
9.9% | 8.8% | |||||
Construction & Engineering |
5.6% | 7.9% | |||||
Commercial Services & Supplies |
5.5% | 4.4% | |||||
Energy Equipment & Services |
4.9% | 5.7% | |||||
IT Services |
4.8% | 3.9% | |||||
Media |
4.7% | 5.4% | |||||
Aerospace & Defense |
4.7% | 3.5% | |||||
Health Care Providers & Services |
4.3% | 2.7% | |||||
Internet Software & Services |
3.8% | 3.8% | |||||
Computers & Peripherals |
3.8% | 3.8% | |||||
Leisure Equipment & Products |
3.5% | 3.7% | |||||
Specialty Retail |
3.4% | 4.2% | |||||
Hotels, Restaurants & Leisure |
3.3% | 3.2% | |||||
Diversified Telecommunication Services |
3.3% | 4.0% | |||||
Oil, Gas & Consumable Fuels |
3.2% | 2.7% | |||||
Food Products |
2.7% | 3.5% | |||||
Software |
2.7% | 2.9% | |||||
Electronic Equipment, Instruments & Components |
2.7% | 2.8% | |||||
Communications Equipment |
2.7% | 2.2% | |||||
Diversified Consumer Services |
2.2% | 2.9% | |||||
Professional Services |
2.2% | 2.4% | |||||
Diversified Financial Services |
2.1% | 0.9% | |||||
Containers & Packaging |
1.7% | 1.8% | |||||
Construction Materials |
1.5% | 2.1% | |||||
Road & Rail |
1.5% | 1.8% | |||||
Building Products |
1.2% | 1.6% | |||||
Distributors |
1.0% | 1.5% | |||||
Transportation Infrastructure |
1.0% | 0.5% | |||||
Food & Staples Retailing |
1.0% | 0.7% | |||||
Other(1) |
5.1% | 4.7% | |||||
| | | | | | | | |
|
100.0% | 100.0% | |||||
| | | | | | | | |
| | | | | | | | |
| | | | | | | | |
At December 31, 2019 and 2018, Main Street had no portfolio investment that was greater than 10% of the Investment Portfolio at fair value.
Unconsolidated Significant Subsidiaries
In accordance with Rules 3-09 and 4-08(g) of Regulation S-X, Main Street must determine which of its unconsolidated controlled portfolio companies, if any, are considered "significant subsidiaries." In evaluating these unconsolidated controlled portfolio companies, there are three tests utilized to determine if any of Main Street's Control Investments (as defined in Note A, including those unconsolidated portfolio companies defined as Control Investments in which Main Street does not own greater than 50% of the voting securities or maintain greater than 50% of the board representation) are considered significant subsidiaries: the
167
MAIN STREET CAPITAL CORPORATION
NOTES TO CONSOLIDATED FINANCIAL STATEMENTS — (Continued)
investment test, the asset test and the income test. The income test is measured by dividing the absolute value of the combined total of total investment income, net realized gain (loss) and net unrealized appreciation (depreciation) from each Control Investment for the period being tested by the absolute value of Main Street's pre-tax income for the same period. Rule 3-09 of Regulation S-X, as interpreted by the SEC, requires Main Street to include separate audited financial statements of an unconsolidated majority-owned subsidiary (Control Investments in which Main Street owns greater than 50% of the voting securities) in an annual report if any of the three tests exceed 20% of Main Street's total investments at fair value, total assets or total income, respectively. Rule 4-08(g) of Regulation S-X requires summarized financial information of a Control Investment in an annual report if any of the three tests exceeds 10% of Main Street's annual total amounts and Rule 10-01(b)(1) of Regulation S-X requires summarized financial information in a quarterly report if any of the three tests exceeds 20% of Main Street's year-to-date total amounts.
As of December 31, 2019 and 2018, Main Street had no single investment that represented greater than 10% of its total Investment Portfolio at fair value and no single investment whose total assets represented greater than 10% of its total assets. After performing the income test for the year ended December 31, 2019 and 2018, Main Street determined that its income from three of its Control Investments individually generated more than 10% of its total income, primarily due to the unrealized appreciation and dividend income that was recognized relating to the investments. As such, GJH, GRT and the wholly owned External Investment Manager were each considered significant subsidiaries at the 10% income level (see further discussion and summarized financial information of the External Investment Manager in Note D). Additionally, after performing the income test for the year ended December 31, 2017, Main Street determined that its income from one of its Control Investments individually generated more than 10% of its total income, primarily due to unrealized appreciation that was recognized on the investment. As such, CBT, an unconsolidated portfolio company that was a Control Investment, but for which Main Street was not the majority owner and did not have rights to maintain greater than 50% of the board representation, was considered a significant subsidiary at the 10% level as of December 31, 2017.
The following table shows the summarized financial information for CBT:
| |
As of December 31, | ||||||
|---|---|---|---|---|---|---|---|
| |
2019 | 2018 | |||||
| |
(dollars in thousands) |
||||||
Balance Sheet Data |
|||||||
Current Assets |
$ | 3,581 | $ | 4,025 | |||
Noncurrent Assets |
10,916 | 11,372 | |||||
Current Liabilities |
12,464 | 15,103 | |||||
Noncurrent Liabilities |
— | — | |||||
| |
Twelve Months Ended December 31, |
|||||||||
|---|---|---|---|---|---|---|---|---|---|---|
| |
2019 | 2018 | 2017 | |||||||
| |
(dollars in thousands) |
|||||||||
Summary of Operations |
||||||||||
Total Revenue |
$ | 34,236 | $ | 39,209 | $ | 40,802 | ||||
Gross Profit |
29,788 | 35,160 | 35,837 | |||||||
Income from Operations |
1,864 | 3,978 | 9,018 | |||||||
Net Income |
1,814 | 4,868 | 18,379 | |||||||
168
MAIN STREET CAPITAL CORPORATION
NOTES TO CONSOLIDATED FINANCIAL STATEMENTS — (Continued)
The following table shows the summarized financial information for GJH:
| |
As of December 31, | ||||||
|---|---|---|---|---|---|---|---|
| |
2019 | 2018 | |||||
Balance Sheet Data |
|||||||
Current Assets |
$ | 19,936 | $ | 16,983 | |||
Noncurrent Assets |
31,945 | 32,763 | |||||
Current Liabilities |
8,472 | 7,711 | |||||
Noncurrent Liabilities |
24,756 | 25,239 | |||||
| |
Twelve Months Ended December 31, |
|||||||||
|---|---|---|---|---|---|---|---|---|---|---|
| |
2019 | 2018 | 2017 | |||||||
| |
(dollars in thousands) |
|||||||||
Summary of Operations |
||||||||||
Total Revenue |
$ | 58,863 | $ | 53,998 | $ | 42,429 | ||||
Gross Profit |
23,430 | 21,702 | 17,067 | |||||||
Income from Operations |
7,005 | 6,478 | 3,149 | |||||||
Net Income |
5,552 | 2,648 | (486 | ) | ||||||
The following table shows the summarized financial information for GRT:
| |
As of December 31, | ||||||
|---|---|---|---|---|---|---|---|
| |
2019 | 2018 | |||||
| |
(dollars in thousands) |
||||||
Balance Sheet Data |
|||||||
Current Assets |
$ | 10,256 | $ | 8,399 | |||
Noncurrent Assets |
20,921 | 24,242 | |||||
Current Liabilities |
6,713 | 2,870 | |||||
Noncurrent Liabilities |
22,412 | 14,445 | |||||
| |
Twelve Months Ended December 31, |
|||||||||
|---|---|---|---|---|---|---|---|---|---|---|
| |
2019 | 2018 | 2017 | |||||||
| |
(dollars in thousands) |
|||||||||
Summary of Operations |
||||||||||
Total Revenue |
$ | 39,908 | $ | 37,821 | $ | 31,165 | ||||
Gross Profit |
11,064 | 9,526 | 6,737 | |||||||
Income from Operations |
6,404 | 4,934 | 2,329 | |||||||
Net Income |
3,128 | 2,470 | (103 | ) | ||||||
NOTE D — EXTERNAL INVESTMENT MANAGER
As discussed further in Note A.1., the External Investment Manager provides investment management and other services to External Parties. The External Investment Manager is accounted for as a portfolio investment of MSCC since the External Investment Manager conducts all of its investment management activities for External Parties.
During May 2012, Main Street entered into an investment sub-advisory agreement with HMS Adviser, LP ("HMS Adviser"), which is the investment advisor to HMS Income, a non-listed BDC, to provide certain investment advisory services to HMS Adviser. In December 2013, after obtaining required
169
MAIN STREET CAPITAL CORPORATION
NOTES TO CONSOLIDATED FINANCIAL STATEMENTS — (Continued)
no-action relief from the SEC to allow it to own a registered investment adviser, Main Street assigned the sub-advisory agreement to the External Investment Manager since the fees received from such arrangement could otherwise have negative consequences on MSCC's ability to meet the source-of-income requirement necessary for it to maintain its RIC tax treatment. Under the investment sub-advisory agreement, the External Investment Manager is entitled to 50% of the base management fee and the incentive fees earned by HMS Adviser under its advisory agreement with HMS Income. The External Investment Manager agreed to waive the historical incentive fees otherwise earned through December 31, 2018. During the years ended December 31, 2019, 2018 and 2017, the External Investment Manager earned $13.1 million, $11.6 million and $10.9 million, respectively, in fee income, which consisted of $11.1 million of base management fees and $2.0 million in incentive fees in 2019 compared to $11.6 million and $10.9 million of base management fees for the comparable period in 2018 and 2017, respectively, under the sub-advisory agreement with HMS Adviser.
The investment in the External Investment Manager is accounted for using fair value accounting, with the fair value determined by Main Street and approved, in good faith, by Main Street's Board of Directors. Main Street determines the fair value of the External Investment Manager using the Waterfall valuation method under the market approach (see further discussion in Note B.1.). Any change in fair value of the investment in the External Investment Manager is recognized on Main Street's consolidated statements of operations in "Net Unrealized Appreciation (Depreciation) — Control investments."
The External Investment Manager is an indirect wholly owned subsidiary of MSCC owned through a Taxable Subsidiary and is a disregarded entity for tax purposes. The External Investment Manager has entered into a tax sharing agreement with its Taxable Subsidiary owner. Since the External Investment Manager is accounted for as a portfolio investment of MSCC and is not included as a consolidated subsidiary of MSCC in MSCC's consolidated financial statements, and as a result of the tax sharing agreement with its Taxable Subsidiary owner, for financial reporting purposes the External Investment Manager is treated as if it is taxed at normal corporate tax rates based on its taxable income and, as a result of its activities, may generate income tax expense or benefit. Main Street owns the External Investment Manager through the Taxable Subsidiary to allow MSCC to continue to comply with the "source-of-income" requirements contained in the RIC tax provisions of the Code. The taxable income, or loss, of the External Investment Manager may differ from its book income, or loss, due to temporary book and tax timing differences and permanent differences. As a result of the above described financial reporting and tax treatment, the External Investment Manager provides for any income tax expense, or benefit, and any tax assets or liabilities in its separate financial statements.
Main Street shares employees with the External Investment Manager and allocates costs related to such shared employees to the External Investment Manager generally based on a combination of the direct time spent, new investment origination activity and assets under management, depending on the nature of the expense. For the years ended December 31, 2019, 2018 and 2017, Main Street allocated $6.7 million, $6.8 million and $6.4 million of total expenses, respectively, to the External Investment Manager. The total contribution of the External Investment Manager to Main Street's net investment income consists of the combination of the expenses allocated to the External Investment Manager and the dividend income received from the External Investment Manager. For the years ended December 31, 2019, 2018 and 2017, the total contribution to Main Street's net investment income was $11.7 million, $10.6 million and $9.4 million, respectively.
170
MAIN STREET CAPITAL CORPORATION
NOTES TO CONSOLIDATED FINANCIAL STATEMENTS — (Continued)
Summarized financial information from the separate financial statements of the External Investment Manager as of December 31, 2019 and 2018 and for the years ended December 31, 2019, 2018 and 2017 is as follows:
| |
Twelve Months Ended December 31, |
|||||||||
|---|---|---|---|---|---|---|---|---|---|---|
| |
2019 | 2018 | 2017 | |||||||
| |
(dollars in thousands) |
|||||||||
Management fee income |
$ | 11,116 | $ | 11,592 | $ | 10,946 | ||||
Incentive fees |
1,972 | — | — | |||||||
| | | | | | | | | | | |
Total revenues |
13,088 | 11,592 | 10,946 | |||||||
Expenses allocated from MSCC or its subsidiaries: |
||||||||||
Salaries, share-based compensation and other personnel costs |
(4,388 | ) | (4,324 | ) | (3,989 | ) | ||||
Other G&A expenses |
(2,284 | ) | (2,444 | ) | (2,381 | ) | ||||
| | | | | | | | | | | |
Total allocated expenses |
(6,672 | ) | (6,768 | ) | (6,370 | ) | ||||
| | | | | | | | | | | |
Pre-tax income |
6,416 | 4,824 | 4,576 | |||||||
Tax expense |
(1,427 | ) | (1,002 | ) | (1,544 | ) | ||||
| | | | | | | | | | | |
Net income |
$ | 4,989 | $ | 3,822 | $ | 3,032 | ||||
| | | | | | | | | | | |
| | | | | | | | | | | |
| | | | | | | | | | | |
| |
As of December 31, 2019 |
As of December 31, 2018 |
|||||
|---|---|---|---|---|---|---|---|
| |
(dollars in thousands) |
||||||
Cash |
$ | — | $ | — | |||
Accounts receivable — HMS Income |
2,708 | 2,947 | |||||
| | | | | | | | |
Total assets |
$ | 2,708 | $ | 2,947 | |||
| | | | | | | | |
| | | | | | | | |
| | | | | | | | |
Accounts payable to MSCC and its subsidiaries |
$ | 1,592 | $ | 1,786 | |||
Dividend payable to MSCC and its subsidiaries |
1,116 | 1,161 | |||||
Equity |
— | — | |||||
| | | | | | | | |
Total liabilities and equity |
$ | 2,708 | $ | 2,947 | |||
| | | | | | | | |
| | | | | | | | |
| | | | | | | | |
NOTE E — DEBT
SBIC Debentures
Under existing SBIC regulations, SBA-approved SBICs under common control have the ability to issue debentures guaranteed by the SBA up to a regulatory maximum amount of $350.0 million. Main Street, through the Funds, has an effective maximum amount of $347.0 million as a result of certain voluntary prepayments of SBIC debentures under historical commitments from the SBA. SBIC debentures payable were $311.8 million and $345.8 million at December 31, 2019 and 2018, respectively. SBIC debentures provide for interest to be paid semiannually, with principal due at the applicable 10-year maturity date of each debenture. During the year ended December 31, 2019, Main Street received a $25.0 million commitment from the SBA in order to issue new SBIC debentures in the future and opportunistically prepaid $34.0 million of existing SBIC debentures that were scheduled to mature over the next year as part of an effort to manage the maturity dates of the oldest SBIC debentures. As a result of this prepayment, Main Street recognized a realized loss of $5.7 million due primarily to the previously recognized gain recorded as a result of recording the MSC II
171
MAIN STREET CAPITAL CORPORATION
NOTES TO CONSOLIDATED FINANCIAL STATEMENTS — (Continued)
debentures at fair value on the date of the acquisition of the majority interests of MSC II. The effect of the realized loss is substantially offset by the reversal of all previously recognized unrealized depreciation due to fair value adjustments since the date of the acquisition. Main Street expects to issue new SBIC debentures under the SBIC program in the future in an amount up to the regulatory maximum amount for affiliated SBIC funds. The weighted-average annual interest rate on the SBIC debentures was 3.6% and 3.7% as of December 31, 2019 and 2018, respectively. The first principal maturity due under the existing SBIC debentures is in 2020, and the weighted-average remaining duration as of December 31, 2019 was approximately 5.1 years. For the years ended December 31, 2019, 2018 and 2017, Main Street recognized interest expense, including the amortization of upfront leverage and other miscellaneous fees, attributable to the SBIC debentures of $12.7 million, $12.8 million and $10.5 million, respectively. In accordance with SBIC regulations, the Funds are precluded from incurring additional non-SBIC debt without the prior approval of the SBA.
As of December 31, 2019, the recorded value of the SBIC debentures was $306.2 million which consisted of (i) $21.9 million recorded at fair value, or $0.1 million less than the $22.0 million par value of the SBIC debentures issued by MSC II, (ii) $139.8 million par value of SBIC debentures outstanding issued by MSMF, with a recorded value of $138.5 million that was net of unamortized debt issuance costs of $1.3 million and (iii) $150.0 million par value of SBIC debentures issued by MSC III with a recorded value of $145.7 million that was net of unamortized debt issuance costs of $4.3 million. As of December 31, 2019, if Main Street had adopted the fair value option under ASC 825 for all of its SBIC debentures, Main Street estimates the fair value of its SBIC debentures would be approximately $310.2 million, or $1.6 million less than the $311.8 million face value of the SBIC debentures.
The maturity dates and fixed interest rates for Main Street's SBIC Debentures as of December 31, 2019 and 2018 are summarized in the following table:
Maturity Date
|
Fixed Interest Rate |
December 31, 2019 |
December 31, 2018 |
|||||||
|---|---|---|---|---|---|---|---|---|---|---|
9/1/2019 |
4.95 | % | — | 16,000,000 | ||||||
3/1/2020 |
4.51 | % | — | 10,000,000 | ||||||
9/1/2020 |
3.50 | % | 35,000,000 | 35,000,000 | ||||||
9/1/2020 |
3.93 | % | 2,000,000 | 10,000,000 | ||||||
3/1/2021 |
4.37 | % | 10,000,000 | 10,000,000 | ||||||
3/1/2021 |
4.60 | % | 20,000,000 | 20,000,000 | ||||||
9/1/2021 |
3.39 | % | 10,000,000 | 10,000,000 | ||||||
9/1/2022 |
2.53 | % | 5,000,000 | 5,000,000 | ||||||
3/1/2023 |
3.16 | % | 16,000,000 | 16,000,000 | ||||||
3/1/2024 |
3.95 | % | 39,000,000 | 39,000,000 | ||||||
3/1/2024 |
3.55 | % | 24,800,000 | 24,800,000 | ||||||
3/1/2027 |
3.52 | % | 40,400,000 | 40,400,000 | ||||||
9/1/2027 |
3.19 | % | 34,600,000 | 34,600,000 | ||||||
3/1/2028 |
3.41 | % | 43,000,000 | 43,000,000 | ||||||
9/1/2028 |
3.55 | % | 32,000,000 | 32,000,000 | ||||||
| | | | | | | | | | | |
Ending Balance |
311,800,000 | 345,800,000 | ||||||||
| | | | | | | | | | | |
| | | | | | | | | | | |
| | | | | | | | | | | |
Credit Facility
Main Street maintains the Credit Facility to provide additional liquidity to support its investment and operational activities. The Credit Facility includes total commitments of $705.0 million from a diversified
172
MAIN STREET CAPITAL CORPORATION
NOTES TO CONSOLIDATED FINANCIAL STATEMENTS — (Continued)
group of 17 lenders. The Credit Facility matures in September 2023 and contains an accordion feature which allows Main Street to increase the total commitments under the facility to up to $800.0 million from new and existing lenders on the same terms and conditions as the existing commitments.
Borrowings under the Credit Facility bear interest, subject to Main Street's election and resetting on a monthly basis on the first of each month, on a per annum basis at a rate equal to the applicable LIBOR rate (1.8% as of December 31, 2019) plus (i) 1.875% (or the applicable base rate (Prime Rate of 4.75% as of December 31, 2019) plus 0.875%) as long as Main Street meets certain agreed upon excess collateral and maximum leverage requirements or (ii) 2.0% (or the applicable base rate plus 1.0%) otherwise. Main Street pays unused commitment fees of 0.25% per annum on the unused lender commitments under the Credit Facility. The Credit Facility is secured by a first lien on the assets of MSCC and its subsidiaries, excluding the equity ownership or assets of the Funds and the External Investment Manager. The Credit Facility contains certain affirmative and negative covenants, including but not limited to: (i) maintaining a minimum availability of at least 10% of the borrowing base, (ii) maintaining an interest coverage ratio of at least 2.0 to 1.0, (iii) maintaining an asset coverage ratio (tangible net worth to Credit Facility borrowings) of at least 1.5 to 1.0 and (iv) maintaining a minimum tangible net worth. The Credit Facility is provided on a revolving basis through its final maturity date in September 2023, and contains two, one-year extension options which could extend the final maturity by up to two years, subject to certain conditions, including lender approval.
At December 31, 2019, Main Street had $300.0 million in borrowings outstanding under the Credit Facility. As of December 31, 2019, if Main Street had adopted the fair value option under ASC 825 for its Credit Facility, Main Street estimates its fair value would approximate its recorded value. Main Street recognized interest expense related to the Credit Facility, including unused commitment fees and amortization of deferred issuance costs, of $11.0 million, $11.7 million and $10.6 million, respectively, for the years ended December 31, 2019, 2018 and 2017. As of December 31, 2019, the interest rate on the Credit Facility was 3.6% (based on the LIBOR rate of 1.7% as of the most recent reset date of December 1, 2019 plus 1.875%). The average interest rate for borrowings under the Credit Facility during the year ended December 31, 2019 was 4.1%. As of December 31, 2019, Main Street was in compliance with all financial covenants of the Credit Facility.
6.125% Notes
In April 2013, Main Street issued $92.0 million, including the underwriters' full exercise of their option to purchase additional principal amounts to cover over-allotments, in aggregate principal amount of 6.125% Notes due 2023 (the "6.125% Notes"). The 6.125% Notes bore interest at a rate of 6.125% per year payable quarterly on January 1, April 1, July 1 and October 1 of each year. On April 2, 2018, Main Street redeemed the entire principal amount of the issued and outstanding 6.125% Notes, effective April 1, 2018 (the "Redemption Date"), at par value plus the accrued and unpaid interest thereon from January 1, 2018 through, but excluding, the Redemption Date. As part of the redemption, Main Street recognized a realized loss on extinguishment of debt of $1.5 million in the second quarter of 2018 related to the write-off of the related unamortized deferred financing costs. Main Street recognized interest expense related to the 6.125% Notes, including amortization of unamortized deferred issuance costs, of $1.5 million and $5.9 million for the years ended December 31 2018 and 2017, respectively.
4.50% Notes due 2019
In November 2014, Main Street issued $175.0 million in aggregate principal amount of 4.50% unsecured notes due 2019 (the "4.50% Notes due 2019") at an issue price of 99.53%. The 4.50% Notes due 2019 bore interest at a rate of 4.50% per year payable semiannually on June 1 and December 1 of each year. On December 2, 2019, Main Street repaid the entire principal amount of the issued and outstanding 4.50% Notes
173
MAIN STREET CAPITAL CORPORATION
NOTES TO CONSOLIDATED FINANCIAL STATEMENTS — (Continued)
due 2019, effective December 1, 2019 (the "Maturity Date"), at par value plus the accrued and unpaid interest thereon from June 1, 2019 through the Maturity Date. Main Street recognized interest expense related to the 4.50% Notes due 2019, including amortization of unamortized deferred issuance costs, of $7.9 million for the year ended December 31, 2019 and $8.6 million for each of the years ended December 31 2018 and 2017.
4.50% Notes due 2022
In November 2017, Main Street issued $185.0 million in aggregate principal amount of 4.50% unsecured notes due 2022 (the "4.50% Notes due 2022") at an issue price of 99.16%. The 4.50% Notes due 2022 are unsecured obligations and rank pari passu with Main Street's current and future unsecured indebtedness; senior to any of its future indebtedness that expressly provides it is subordinated to the 4.50% Notes due 2022; effectively subordinated to all of its existing and future secured indebtedness, to the extent of the value of the assets securing such indebtedness, including borrowings under its Credit Facility; and structurally subordinated to all existing and future indebtedness and other obligations of any of its subsidiaries, including without limitation, the indebtedness of the Funds. The 4.50% Notes due 2022 mature on December 1, 2022, and may be redeemed in whole or in part at any time at Main Street's option subject to certain make-whole provisions. The 4.50% Notes due 2022 bear interest at a rate of 4.50% per year payable semiannually on June 1 and December 1 of each year. The total net proceeds from the 4.50% Notes due 2022, resulting from the issue price and after underwriting discounts and estimated offering expenses payable, were approximately $182.2 million. Main Street may from time to time repurchase the 4.50% Notes due 2022 in accordance with the 1940 Act and the rules promulgated thereunder. As of December 31, 2019, the outstanding balance of the 4.50% Notes due 2022 was $185.0 million and the recorded value of $183.2 million was net of unamortized debt issuance costs of $1.8 million. As of December 31, 2019, if Main Street had adopted the fair value option under ASC 825 for the 4.50% Notes due 2022, Main Street estimates its fair value would be approximately $194.8 million. Main Street recognized interest expense related to the 4.50% Notes due 2022, including amortization of unamortized deferred issuance costs, of $8.9 million, $9.0 million and $0.9 million for the years ended December 31, 2019, 2018 and 2017, respectively.
The indenture governing the 4.50% Notes due 2022 (the "4.50% Notes due 2022 Indenture") contains certain covenants, including covenants requiring Main Street's compliance with (regardless of whether Main Street is subject to) the asset coverage requirements set forth in Section 18(a)(1)(A) as modified by Section 61(a)(1) of the 1940 Act, as well as covenants requiring Main Street to provide financial information to the holders of the 4.50% Notes due 2022 and the Trustee if Main Street ceases to be subject to the reporting requirements of the Exchange Act. These covenants are subject to limitations and exceptions that are described in the 4.50% Notes due 2022 Indenture. As of December 31, 2019, Main Street was in compliance with these covenants.
5.20% Notes
In April 2019, Main Street issued $250.0 million in aggregate principal amount of 5.20% unsecured notes due 2024 (the "5.20% Notes") at an issue price of 99.125%. Subsequently, in December 2019, Main Street issued an additional $75.0 million of the 5.20% Notes at an issue price of 105.0%. The 5.20% Notes issued in December 2019 have identical terms as, and are a part of a single series with, the 5.20% Notes issued in April 2019. The 5.20% Notes are unsecured obligations and rank pari passu with Main Street's current and future unsecured indebtedness; senior to any of its future indebtedness that expressly provides it is subordinated to the 5.20% Notes; effectively subordinated to all of its existing and future secured indebtedness, to the extent of the value of the assets securing such indebtedness, including borrowings under its Credit Facility; and structurally subordinated to all existing and future indebtedness and other obligations of any of its subsidiaries, including without limitation, the indebtedness of the Funds. The 5.20% Notes
174
MAIN STREET CAPITAL CORPORATION
NOTES TO CONSOLIDATED FINANCIAL STATEMENTS — (Continued)
mature on May 1, 2024, and may be redeemed in whole or in part at any time at Main Street's option subject to certain make-whole provisions. The 5.20% Notes bear interest at a rate of 5.20% per year payable semiannually on May 1 and November 1 of each year. The total net proceeds from the 5.20% Notes, resulting from the issue price and after underwriting discounts and estimated offering expenses payable, were approximately $324.1 million. Main Street may from time to time repurchase the 5.20% Notes in accordance with the 1940 Act and the rules promulgated thereunder. As of December 31, 2019, the outstanding balance of the 5.20% Notes was $325.0 million and the recorded value of $324.6 million was net of unamortized debt issuance costs of $0.4 million. As of December 31, 2019, if Main Street had adopted the fair value option under ASC 825 for the 5.20% Notes, Main Street estimates its fair value would be approximately $350.9 million. Main Street recognized interest expense related to the 5.20% Notes, including amortization of unamortized deferred issuance costs, of $9.7 million for the year ended December 31, 2019.
The indenture governing the 5.20% Notes (the "5.20% Notes Indenture") contains certain covenants, including covenants requiring Main Street's compliance with (regardless of whether Main Street is subject to) the asset coverage requirements set forth in Section 18(a)(1)(A) as modified by Section 61(a)(1) of the 1940 Act, as well as covenants requiring Main Street to provide financial information to the holders of the 5.20% Notes and the Trustee if Main Street ceases to be subject to the reporting requirements of the Exchange Act. These covenants are subject to limitations and exceptions that are described in the 5.20% Notes Indenture. As of December 31, 2019, Main Street was in compliance with these covenants.
Contractual Payment Obligations
A summary of Main Street's contractual payment obligations for the repayment of outstanding indebtedness at December 31, 2019 is as follows:
| |
2020 | 2021 | 2022 | 2023 | 2024 | Thereafter | Total | |||||||||||||||
|---|---|---|---|---|---|---|---|---|---|---|---|---|---|---|---|---|---|---|---|---|---|---|
SBIC debentures |
$ | 37,000 | $ | 40,000 | $ | 5,000 | $ | 16,000 | $ | 63,800 | $ | 150,000 | $ | 311,800 | ||||||||
4.50% Notes due 2022 |
— | — | 185,000 | — | — | — | 185,000 | |||||||||||||||
5.20% Notes due 2024 |
— | — | — | — | 325,000 | — | 325,000 | |||||||||||||||
Credit Facility |
— | — | — | 300,000 | — | — | 300,000 | |||||||||||||||
| | | | | | | | | | | | | | | | | | | | | | | |
Total |
$ | 37,000 | $ | 40,000 | $ | 190,000 | $ | 316,000 | $ | 388,800 | $ | 150,000 | $ | 1,121,800 | ||||||||
| | | | | | | | | | | | | | | | | | | | | | | |
| | | | | | | | | | | | | | | | | | | | | | | |
| | | | | | | | | | | | | | | | | | | | | | | |
175
MAIN STREET CAPITAL CORPORATION
NOTES TO CONSOLIDATED FINANCIAL STATEMENTS — (Continued)
Senior Securities
Information about Main Street's senior securities is shown in the following table as of December 31 for the years indicated in the table, unless otherwise noted.
Class and Year
|
Total Amount Outstanding Exclusive of Treasury Securities(1) |
Asset Coverage per Unit(2) |
Involuntary Liquidating Preference per Unit(3) |
Average Market Value per Unit(4) |
|||||||||
|---|---|---|---|---|---|---|---|---|---|---|---|---|---|
| |
(dollars in thousands) |
|
|
|
|||||||||
SBIC Debentures |
|||||||||||||
2010 |
$ | 180,000 | 2,030 | — | N/A | ||||||||
2011 |
220,000 | 2,202 | — | N/A | |||||||||
2012 |
225,000 | 2,763 | — | N/A | |||||||||
2013 |
200,200 | 2,476 | — | N/A | |||||||||
2014 |
225,000 | 2,323 | — | N/A | |||||||||
2015 |
225,000 | 2,368 | — | N/A | |||||||||
2016 |
240,000 | 2,415 | — | N/A | |||||||||
2017 |
295,800 | 2,687 | — | N/A | |||||||||
2018 |
345,800 | 2,455 | — | N/A | |||||||||
2019 |
311,800 | 2,363 | — | N/A | |||||||||
Credit Facility |
|||||||||||||
2010 |
$ | 39,000 | 2,030 | — | N/A | ||||||||
2011 |
107,000 | 2,202 | — | N/A | |||||||||
2012 |
132,000 | 2,763 | — | N/A | |||||||||
2013 |
237,000 | 2,476 | — | N/A | |||||||||
2014 |
218,000 | 2,323 | — | N/A | |||||||||
2015 |
291,000 | 2,368 | — | N/A | |||||||||
2016 |
343,000 | 2,415 | — | N/A | |||||||||
2017 |
64,000 | 2,687 | — | N/A | |||||||||
2018 |
301,000 | 2,455 | — | N/A | |||||||||
2019 |
300,000 | 2,363 | — | N/A | |||||||||
6.125% Notes |
|||||||||||||
2013 |
$ | 90,882 | 2,476 | — | $ | 24.35 | |||||||
2014 |
90,823 | 2,323 | — | 24.78 | |||||||||
2015 |
90,738 | 2,368 | — | 25.40 | |||||||||
2016 |
90,655 | 2,415 | — | 25.76 | |||||||||
2017 |
90,655 | 2,687 | — | 25.93 | |||||||||
4.50% Notes Due 2019 |
|||||||||||||
2014 |
$ | 175,000 | 2,323 | — | N/A | ||||||||
2015 |
175,000 | 2,368 | — | N/A | |||||||||
2016 |
175,000 | 2,415 | — | N/A | |||||||||
2017 |
175,000 | 2,687 | — | N/A | |||||||||
2018 |
175,000 | 2,455 | — | N/A | |||||||||
176
MAIN STREET CAPITAL CORPORATION
NOTES TO CONSOLIDATED FINANCIAL STATEMENTS — (Continued)
Class and Year
|
Total Amount Outstanding Exclusive of Treasury Securities(1) |
Asset Coverage per Unit(2) |
Involuntary Liquidating Preference per Unit(3) |
Average Market Value per Unit(4) |
|||||||||
|---|---|---|---|---|---|---|---|---|---|---|---|---|---|
| |
(dollars in thousands) |
|
|
|
|||||||||
4.50% Notes Due 2022 |
|||||||||||||
2017 |
$ | 185,000 | 2,687 | — | N/A | ||||||||
2018 |
185,000 | 2,455 | — | N/A | |||||||||
2019 |
185,000 | 2,363 | — | N/A | |||||||||
5.20% Notes Due 2024 |
|||||||||||||
2019 |
325,000 | 2,363 | — | N/A | |||||||||
177
MAIN STREET CAPITAL CORPORATION
NOTES TO CONSOLIDATED FINANCIAL STATEMENTS — (Continued)
NOTE F — FINANCIAL HIGHLIGHTS
| |
Twelve Months Ended December 31, | |||||||||||||||
|---|---|---|---|---|---|---|---|---|---|---|---|---|---|---|---|---|
Per Share Data:
|
2019 | 2018 | 2017 | 2016 | 2015 | |||||||||||
NAV at the beginning of the period |
$ | 24.09 | $ | 23.53 | $ | 22.10 | $ | 21.24 | $ | 20.85 | ||||||
Net investment income(1) |
2.50 | 2.60 | 2.39 | 2.23 | 2.18 | |||||||||||
Net realized gain (loss)(1)(2) |
(0.33 | ) | (0.03 | ) | 0.19 | 0.56 | (0.43 | ) | ||||||||
Net unrealized appreciation (depreciation)(1)(2) |
(0.09 | ) | 0.32 | 0.86 | (0.14 | ) | 0.20 | |||||||||
Income tax benefit (provision)(1)(2) |
(0.02 | ) | (0.09 | ) | (0.43 | ) | 0.02 | 0.18 | ||||||||
| | | | | | | | | | | | | | | | | |
Net increase in net assets resulting from operations(1) |
2.06 | 2.80 | 3.01 | 2.67 | 2.13 | |||||||||||
Dividends paid from net investment income |
(2.91 | ) | (2.69 | ) | (2.47 | ) | (1.99 | ) | (2.49 | ) | ||||||
Distributions from capital gains |
— | (0.16 | ) | (0.32 | ) | (0.74 | ) | (0.16 | ) | |||||||
| | | | | | | | | | | | | | | | | |
Total dividends paid |
(2.91 | ) | (2.85 | ) | (2.79 | ) | (2.73 | ) | (2.65 | ) | ||||||
Impact of the net change in monthly dividends declared prior to the end of the period and paid in the subsequent period |
(0.01 | ) | (0.01 | ) | (0.01 | ) | (0.01 | ) | (0.01 | ) | ||||||
Accretive effect of stock offerings (issuing shares above NAV per share) |
0.55 | 0.47 | 1.07 | 0.76 | 0.74 | |||||||||||
Accretive effect of DRIP issuance (issuing shares above NAV per share) |
0.12 | 0.09 | 0.06 | 0.08 | 0.12 | |||||||||||
Other(3) |
0.01 | 0.06 | 0.09 | 0.09 | 0.06 | |||||||||||
| | | | | | | | | | | | | | | | | |
NAV at the end of the period |
$ | 23.91 | $ | 24.09 | $ | 23.53 | $ | 22.10 | $ | 21.24 | ||||||
| | | | | | | | | | | | | | | | | |
| | | | | | | | | | | | | | | | | |
| | | | | | | | | | | | | | | | | |
Market value at the end of the period |
$ | 43.11 | $ | 33.81 | $ | 39.73 | $ | 36.77 | $ | 29.08 | ||||||
Shares outstanding at the end of the period |
64,252,937 | 61,264,861 | 58,660,680 | 54,354,857 | 50,413,744 | |||||||||||
| |
2019 | 2018 | 2017 | 2016 | 2015 | |||||||||||
|---|---|---|---|---|---|---|---|---|---|---|---|---|---|---|---|---|
| |
(dollars in thousands) |
|||||||||||||||
NAV at end of period |
$ | 1,536,390 | $ | 1,476,049 | $ | 1,380,368 | $ | 1,201,481 | $ | 1,070,894 | ||||||
Average NAV |
$ | 1,517,615 | $ | 1,441,163 | $ | 1,287,639 | $ | 1,118,567 | $ | 1,055,313 | ||||||
Average outstanding debt |
$ | 1,055,800 | $ | 947,694 | $ | 843,993 | $ | 801,048 | $ | 759,396 | ||||||
Ratio of total expenses, including income tax expense, to average NAV(1) |
5.75% | 5.75% | 7.37% | 5.48% | 4.63% | |||||||||||
Ratio of operating expenses to average NAV(2) |
5.67% | 5.32% | 5.47% | 5.59% | 5.45% | |||||||||||
Ratio of operating expenses, excluding interest expense, to average NAV(2) |
2.36% | 2.30% | 2.63% | 2.58% | 2.41% | |||||||||||
Ratio of net investment income to average NAV |
10.37% | 10.87% | 10.51% | 10.35% | 10.15% | |||||||||||
Portfolio turnover ratio |
18.86% | 29.13% | 38.18% | 24.63% | 25.37% | |||||||||||
Total investment return(3) |
36.86% | (8.25)% | 16.02% | 37.36% | 8.49% | |||||||||||
Total return based on change in NAV(4) |
8.78% | 12.19% | 14.20% | 12.97% | 11.11% | |||||||||||
178
MAIN STREET CAPITAL CORPORATION
NOTES TO CONSOLIDATED FINANCIAL STATEMENTS — (Continued)
depreciation on portfolio investments held in Taxable Subsidiaries and due to the change in the loss carryforwards, which are non-cash in nature and may vary significantly from period to period. Main Street is required to include net deferred tax provision/benefit in calculating its total expenses even though these net deferred taxes are not currently payable/receivable.
NOTE G — DIVIDENDS, DISTRIBUTIONS AND TAXABLE INCOME
During 2019, Main Street paid supplemental dividends of $0.250 per share in June 2019 and $0.240 per share in December 2019, regular monthly dividends of $0.195 per share for each month of January through March 2019, regular monthly dividends of $0.200 per share for each month of April through June 2019 and regular monthly dividends of $0.205 per share for each month of July through December 2019, with such dividends totaling $182.8 million, or $2.905 per share. The 2019 regular monthly dividends, which total $151.6 million, or $2.415 per share, represent a 5.2% increase from the regular monthly dividends paid per share for the year ended 2018. For tax purposes, the 2019 dividends, which included the effects of dividends on an accrual basis, total $2.915 per share and were comprised of (i) ordinary income totaling approximately $2.636 per share, (ii) qualified dividend income totaling approximately $0.249 per share and (iii) long term capital gain totaling approximately $0.031 per share. As of December 31, 2019, Main Street estimates that it has generated undistributed taxable income of approximately $42.3 million, or $0.66 per share, that will be carried forward toward distributions to be paid in 2020. For the years ended December 31, 2018 and 2017, Main Street paid total dividends of approximately $170.9 million, or $2.845 per share, and $157.6 million, or $2.785 per share, respectively.
MSCC has elected to be treated for U.S. federal income tax purposes as a RIC. MSCC's taxable income includes the taxable income generated by MSCC and certain of its subsidiaries, including the Funds, which are treated as disregarded entities for tax purposes. As a RIC, MSCC generally will not pay corporate-level U.S. federal income taxes on any net ordinary taxable income or capital gains that MSCC distributes to its stockholders. MSCC must generally distribute at least 90% of its "investment company taxable income" (which is generally its net ordinary taxable income and realized net short-term capital gains in excess of realized net long-term capital losses) and 90% of its tax-exempt income to maintain its RIC status (pass-through tax treatment for amounts distributed). As part of maintaining RIC status, undistributed taxable income (subject to a 4% non-deductible U.S. federal excise tax) pertaining to a given fiscal year may be distributed up to 12 months subsequent to the end of that fiscal year, provided such dividends are declared on or prior to the later of (i) filing of the U.S. federal income tax return for the applicable fiscal year or (ii) the fifteenth day of the ninth month following the close of the year in which such taxable income was generated.
Ordinary dividend distributions from a RIC do not qualify for the 20% maximum tax rate (plus a 3.8% Medicare surtax, if applicable) on dividend income from domestic corporations and qualified foreign corporations, except to the extent that the RIC received the income in the form of qualifying dividends from domestic corporations and qualified foreign corporations. The tax attributes for distributions will generally
179
MAIN STREET CAPITAL CORPORATION
NOTES TO CONSOLIDATED FINANCIAL STATEMENTS — (Continued)
include both ordinary income and qualified dividends, but may also include either one or both of capital gains and return of capital. The tax character of distributions paid for the years ended December 31, 2019, 2018 and 2017 was as follows:
| |
Twelve Months Ended December 31, | |||||||||
|---|---|---|---|---|---|---|---|---|---|---|
| |
2019 | 2018 | 2017 | |||||||
| |
(dollars in thousands) |
|||||||||
Ordinary income(1) |
$ | 166,280 | $ | 136,934 | $ | 126,540 | ||||
Qualified dividends |
15,451 | 12,277 | 4,656 | |||||||
Distributions of long term capital gains |
1,858 | 22,513 | 27,479 | |||||||
| | | | | | | | | | | |
Distributions on tax basis |
$ | 183,589 | $ | 171,724 | $ | 158,675 | ||||
| | | | | | | | | | | |
| | | | | | | | | | | |
| | | | | | | | | | | |
Listed below is a reconciliation of "Net increase in net assets resulting from operations" to taxable income and to total distributions declared to common stockholders for the years ended December 31, 2019, 2018 and 2017.
| |
Year ended December 31, | |||||||||
|---|---|---|---|---|---|---|---|---|---|---|
| |
2019 | 2018 | 2017 | |||||||
| |
(estimated, dollars in thousands) |
|||||||||
Net increase in net assets resulting from operations |
$ | 129,569 | $ | 168,213 | $ | 170,622 | ||||
Book-tax difference from share-based compensation expense |
(354 | ) | (1,430 | ) | (867 | ) | ||||
Net unrealized (appreciation) depreciation |
5,754 | (19,275 | ) | (48,757 | ) | |||||
Income tax provision |
1,242 | 6,152 | 24,471 | |||||||
Pre-tax book (income) loss not consolidated for tax purposes |
(30,690 | ) | (454 | ) | 2,357 | |||||
Book income and tax income differences, including debt origination, structuring fees, dividends, realized gains and changes in estimates |
65,686 | 17,649 | 10,844 | |||||||
| | | | | | | | | | | |
Estimated taxable income(1) |
171,207 | 170,855 | 158,670 | |||||||
Taxable income earned in prior year and carried forward for distribution in current year |
41,489 | 42,357 | 42,362 | |||||||
Taxable income earned prior to period end and carried forward for distribution next period |
(42,281 | ) | (53,436 | ) | (53,503 | ) | ||||
Dividend payable as of period end and paid in the following period |
13,174 | 11,948 | 11,146 | |||||||
| | | | | | | | | | | |
Total distributions accrued or paid to common stockholders |
$ | 183,589 | $ | 171,724 | $ | 158,675 | ||||
| | | | | | | | | | | |
| | | | | | | | | | | |
| | | | | | | | | | | |
The Taxable Subsidiaries primarily hold certain portfolio investments for Main Street. The Taxable Subsidiaries permit Main Street to hold equity investments in portfolio companies which are "pass-through" entities for tax purposes and to continue to comply with the "source-of-income" requirements contained in the RIC tax provisions of the Code. The Taxable Subsidiaries are consolidated with Main Street for U.S. GAAP financial reporting purposes, and the portfolio investments held by the Taxable Subsidiaries are
180
MAIN STREET CAPITAL CORPORATION
NOTES TO CONSOLIDATED FINANCIAL STATEMENTS — (Continued)
included in Main Street's consolidated financial statements as portfolio investments and recorded at fair value. The Taxable Subsidiaries are not consolidated with MSCC for income tax purposes and may generate income tax expense, or benefit, and tax assets and liabilities, as a result of their ownership of certain portfolio investments. The taxable income, or loss, of the Taxable Subsidiaries may differ from their book income, or loss, due to temporary book and tax timing differences and permanent differences. The Taxable Subsidiaries are each taxed at their normal corporate tax rates based on their taxable income. The income tax expense, or benefit, if any, and the related tax assets and liabilities, of the Taxable Subsidiaries are reflected in Main Street's consolidated financial statements.
The income tax expense, or benefit, and the related tax assets and liabilities generated by the Taxable Subsidiaries, if any, are reflected in Main Street's consolidated statement of operations. Main Street's provision for income taxes was comprised of the following for the years ended December 31, 2019, 2018 and 2017 (amounts in thousands):
| |
Twelve Months Ended December 31, |
|||||||||
|---|---|---|---|---|---|---|---|---|---|---|
| |
2019 | 2018 | 2017 | |||||||
Current tax expense (benefit): |
||||||||||
Federal |
$ | 1,019 | $ | (2,398 | ) | $ | 1,865 | |||
State |
1,408 | 1,688 | 1,415 | |||||||
| | | | | | | | | | | |
Total current tax expense (benefit) |
2,427 | (710 | ) | 3,280 | ||||||
Deferred tax expense (benefit): |
||||||||||
Federal |
(1,267 | ) | 3,763 | 15,248 | ||||||
State |
(1,037 | ) | 2,070 | 4,017 | ||||||
| | | | | | | | | | | |
Total deferred tax expense (benefit) |
(2,304 | ) | 5,833 | 19,265 | ||||||
Excise tax |
1,119 | 1,029 | 1,926 | |||||||
| | | | | | | | | | | |
Total income tax provision (benefit) |
$ | 1,242 | $ | 6,152 | $ | 24,471 | ||||
| | | | | | | | | | | |
| | | | | | | | | | | |
| | | | | | | | | | | |
MSCC operates in a manner to maintain its RIC status and to eliminate corporate-level U.S. federal income tax (other than the 4% excise tax) by distributing sufficient investment company taxable income and long-term capital gains. As a result, MSCC will have an effective tax rate equal to 0% before the excise tax and income taxes incurred by the Taxable Subsidiaries. As such, a reconciliation of the differences between Main Street's reported income tax expense and its tax expense at the federal statutory rate of 21% is not meaningful.
As of December 31, 2019, the cost of investments for U.S. federal income tax purposes was $2,330.6 million, with such investments having a gross unrealized appreciation of $507.6 million and gross unrealized depreciation of $235.8 million.
Management believes that the realization of the deferred tax assets is more likely than not based on expectations as to future taxable income and scheduled reversals of temporary differences. Accordingly, Main Street did not record a valuation allowance related to its deferred tax assets at December 31, 2019 and 2018.
181
MAIN STREET CAPITAL CORPORATION
NOTES TO CONSOLIDATED FINANCIAL STATEMENTS — (Continued)
The following table sets forth the significant components of net deferred tax assets and liabilities as of December 31, 2019 and 2018 (amounts in thousands):
| |
Years Ended December 31, |
||||||
|---|---|---|---|---|---|---|---|
| |
2019 | 2018 | |||||
Deferred tax assets: |
|||||||
Net operating loss carryforwards |
$ | 32,778 | $ | 29,546 | |||
Interest Expense Carryforwards |
10,079 | 5,199 | |||||
Capital loss carryforwards |
— | 2,795 | |||||
Other |
2,041 | 1,532 | |||||
| | | | | | | | |
Total deferred tax assets |
44,898 | 39,072 | |||||
| | | | | | | | |
Deferred tax liabilities: |
|||||||
Net unrealized appreciation of portfolio investments |
(31,851 | ) | (37,137 | ) | |||
Net basis differences in portfolio investments |
(29,196 | ) | (18,961 | ) | |||
| | | | | | | | |
Total deferred tax liabilities |
(61,047 | ) | (56,098 | ) | |||
| | | | | | | | |
Total deferred tax asset (liabilities), net |
$ | (16,149 | ) | $ | (17,026 | ) | |
| | | | | | | | |
| | | | | | | | |
| | | | | | | | |
For the year ended December 31, 2019, for U.S. federal income tax purposes, the Taxable Subsidiaries had no remaining net capital loss carryforwards as they had fully utilized their capital loss carryover from prior years of $9.9 million. At December 31, 2019, the Taxable Subsidiaries had a net operating loss carryforward from prior years which, if unused, will expire in various taxable years from 2028 through 2037. Any net operating losses generated in 2018 and future periods are not subject to expiration and will carryforward indefinitely until utilized. The timing and manner in which Main Street will utilize any loss carryforwards generated before December 31, 2018 may be limited in the future under the provisions of the Code. Additionally, the Taxable Subsidiaries have interest expense limitation carryforwards which have an indefinite carryforward. In addition, for the year ended December 31, 2019, for U.S. federal income tax purposes at the RIC level, MSCC had net capital loss carryforwards totaling approximately $19.7 million available to offset future capital gains, to the extent available and permitted by U.S. federal income tax law. However, as long as MSCC maintains its RIC status, any capital loss carryforwards at the RIC are not subject to a federal income tax-effect and are not subject to an expiration date.
NOTE H — COMMON STOCK
Main Street maintains a program with certain selling agents through which it can sell shares of its common stock by means of at-the-market offerings from time to time (the "ATM Program"). During the year ended December 31, 2019, Main Street sold 2,247,187 shares of its common stock at a weighted-average price of $40.05 per share and raised $90.0 million of gross proceeds under the ATM Program. Net proceeds were $88.8 million after commissions to the selling agents on shares sold and offering costs. As of December 31, 2019, 8,359,150 shares remained available for sale under the ATM Program. As of December 31, 2019, sales transactions representing 11,596 shares had not settled and were not included in shares issued and outstanding on the face of the consolidated balance sheet, but were included in the weighted-average shares outstanding in the consolidated statements of operations and in the shares used to calculate net asset value per share.
During the year ended December 31, 2018, Main Street sold 2,060,019 shares of its common stock at a weighted-average price of $38.48 per share and raised $79.3 million of gross proceeds under the ATM
182
MAIN STREET CAPITAL CORPORATION
NOTES TO CONSOLIDATED FINANCIAL STATEMENTS — (Continued)
Program. Net proceeds were $78.0 million after commissions to the selling agents on shares sold and offering costs.
During the year ended December 31, 2017, Main Street sold 3,944,972 shares of its common stock at a weighted-average price of $38.72 per share and raised $152.8 million of gross proceeds under the ATM Program. Net proceeds were $150.9 million after commissions to the selling agents on shares sold and offering costs.
NOTE I — DIVIDEND REINVESTMENT PLAN ("DRIP")
Main Street's DRIP provides for the reinvestment of dividends on behalf of its stockholders, unless a stockholder has elected to receive dividends in cash. As a result, if Main Street declares a cash dividend, its stockholders who have not "opted out" of the DRIP by the dividend record date will have their cash dividend automatically reinvested into additional shares of MSCC common stock. The share requirements of the DRIP may be satisfied through the issuance of shares of common stock or through open market purchases of common stock by the DRIP plan administrator. Newly issued shares will be valued based upon the final closing price of MSCC's common stock on the valuation date determined for each dividend by Main Street's Board of Directors. Shares purchased in the open market to satisfy the DRIP requirements will be valued based upon the average price of the applicable shares purchased, before any associated brokerage or other costs. Main Street's DRIP is administered by its transfer agent on behalf of Main Street's record holders and participating brokerage firms. Brokerage firms and other financial intermediaries may decide not to participate in Main Street's DRIP but may provide a similar dividend reinvestment plan for their clients.
For the year ended December 31, 2019, $18.1 million of the total $182.8 million in dividends paid to stockholders represented DRIP participation. During this period, the DRIP participation requirements were satisfied with the issuance of 441,927 newly issued shares. For the year ended December 31, 2018, $14.9 million of the total $170.9 million in dividends paid to stockholders represented DRIP participation. During this period, the DRIP participation requirements were satisfied with the issuance of 394,403 newly issued shares. For the year ended December 31, 2017, $9.2 million of the total $157.6 million in dividends paid to stockholders represented DRIP participation. During this period, the DRIP participation requirements were satisfied with the issuance of 234,513 newly issued shares. The shares disclosed above relate only to Main Street's DRIP and exclude any activity related to broker-managed dividend reinvestment plans.
NOTE J — SHARE-BASED COMPENSATION
Main Street accounts for its share-based compensation plans using the fair value method, as prescribed by ASC 718, Compensation — Stock Compensation. Accordingly, for restricted stock awards, Main Street measured the grant date fair value based upon the market price of its common stock on the date of the grant and amortizes the fair value of the awards as share-based compensation expense over the requisite service period, which is generally the vesting term.
Main Street's Board of Directors approves the issuance of shares of restricted stock to Main Street employees pursuant to the Main Street Capital Corporation 2015 Equity and Incentive Plan (the "Equity and Incentive Plan"). These shares generally vest over a three-year period from the grant date. The fair value is expensed over the service period, starting on the grant date. The following table summarizes the restricted stock issuances approved by Main Street's Board of Directors under the Equity and Incentive Plan, net of
183
MAIN STREET CAPITAL CORPORATION
NOTES TO CONSOLIDATED FINANCIAL STATEMENTS — (Continued)
shares forfeited, if any, and the remaining shares of restricted stock available for issuance as of December 31, 2019.
Restricted stock authorized under the plan |
3,000,000 | |||
Less net restricted stock granted during: |
||||
Year ended December 31, 2015 |
(900 | ) | ||
Year ended December 31, 2016 |
(260,514 | ) | ||
Year ended December 31, 2017 |
(223,812 | ) | ||
Year ended December 31, 2018 |
(243,779 | ) | ||
Year ended December 31, 2019 |
(384,049 | ) | ||
| | | | | |
Restricted stock available for issuance as of December 31, 2019 |
1,886,946 | |||
| | | | | |
| | | | | |
| | | | | |
As of December 31, 2019, the following table summarizes the restricted stock issued to Main Street's non-employee directors and the remaining shares of restricted stock available for issuance pursuant to the Main Street Capital Corporation 2015 Non-Employee Director Restricted Stock Plan. These shares are granted upon appointment or election to the board and vest on the day immediately preceding the annual meeting of stockholders following the respective grant date and are expensed over such service period.
Restricted stock authorized under the plan |
300,000 | |||
Less net restricted stock granted during: |
||||
Year ended December 31, 2015 |
(6,806 | ) | ||
Year ended December 31, 2016 |
(6,748 | ) | ||
Year ended December 31, 2017 |
(5,948 | ) | ||
Year ended December 31, 2018 |
(6,376 | ) | ||
Year ended December 31, 2019 |
(6,008 | ) | ||
| | | | | |
Restricted stock available for issuance as of December 31, 2019 |
268,114 | |||
| | | | | |
| | | | | |
| | | | | |
For the years ended December 31, 2019, 2018 and 2017, Main Street recognized total share-based compensation expense of $10.1 million, $9.2 million and $10.0 million, respectively, related to the restricted stock issued to Main Street employees and non-employee directors. As of December 31, 2019, there was $15.8 million of total unrecognized compensation expense related to Main Street's non-vested restricted shares. This compensation expense is expected to be recognized over a remaining weighted-average period of approximately 2.1 years as of December 31, 2019.
184
MAIN STREET CAPITAL CORPORATION
NOTES TO CONSOLIDATED FINANCIAL STATEMENTS — (Continued)
NOTE K — COMMITMENTS AND CONTINGENCIES
As of December 31, 2019, Main Street had the following outstanding commitments (in thousands):
| |
Amount | |||
|---|---|---|---|---|
Investments with equity capital commitments that have not yet funded: |
||||
Congruent Credit Opportunities Funds |
||||
Congruent Credit Opportunities Fund II, LP |
$ | 8,488 | ||
Congruent Credit Opportunities Fund III, LP |
8,117 | |||
| | | | | |
|
$ | 16,605 | ||
Encap Energy Fund Investments |
||||
EnCap Energy Capital Fund VIII, L.P. |
$ | 220 | ||
EnCap Energy Capital Fund IX, L.P. |
308 | |||
EnCap Energy Capital Fund X, L.P. |
1,661 | |||
EnCap Flatrock Midstream Fund II, L.P. |
4,728 | |||
EnCap Flatrock Midstream Fund III, L.P. |
803 | |||
| | | | | |
|
$ | 7,720 | ||
EIG Fund Investments |
$ |
4,666 |
||
Freeport Fund Investments |
||||
Freeport Financial SBIC Fund LP |
$ | 1,375 | ||
Freeport First Lien Loan Fund III LP |
2,544 | |||
| | | | | |
|
$ | 3,919 | ||
Brightwood Capital Fund Investments |
||||
Brightwood Capital Fund III, LP |
$ | 3,000 | ||
Brightwood Capital Fund IV, LP |
500 | |||
| | | | | |
|
$ | 3,500 | ||
Harris Preston Fund Investments |
||||
HPEP 3, L.P. |
$ | 2,526 | ||
LKCM Headwater Investments I, L.P. |
$ |
2,500 |
||
Dos Rios Partners |
||||
Dos Rios Partners, LP |
$ | 1,594 | ||
Dos Rios Partners — A, LP |
506 | |||
| | | | | |
|
$ | 2,100 | ||
Construction Supply Investments, LLC |
$ |
495 |
||
Access Media Holdings, LLC |
$ |
284 |
||
| | | | | |
Total equity commitments |
$ | 44,315 | ||
| | | | | |
185
MAIN STREET CAPITAL CORPORATION
NOTES TO CONSOLIDATED FINANCIAL STATEMENTS — (Continued)
| |
Amount | |||
|---|---|---|---|---|
Investments with commitments to fund revolving loans that have not been fully drawn or term loans with additional commitments not yet funded: |
||||
Independent Pet Partners Intermediate Holdings, LLC |
$ |
12,236 |
||
SI East, LLC |
7,500 | |||
Hunter Defense Technologies, Inc. |
6,460 | |||
Fortna, Inc. |
4,411 | |||
GS HVAM Intermediate, LLC |
3,636 | |||
PaySimple, Inc. |
3,318 | |||
GRT Rubber Technologies LLC |
3,099 | |||
Arcus Hunting LLC |
2,795 | |||
Echo US Holdings, LLC. |
2,586 | |||
Centre Technologies Holdings, LLC |
2,400 | |||
Boccella Precast Products LLC |
2,000 | |||
PPL RVs, Inc. |
2,000 | |||
Lynx FBO Operating LLC |
1,875 | |||
Chamberlin Holding LLC |
1,600 | |||
Direct Marketing Solutions, Inc. |
1,600 | |||
Trantech Radiator Topco, LLC |
1,600 | |||
Meisler Operating LLC |
1,600 | |||
Chisholm Energy Holdings, LLC |
1,429 | |||
Hawk Ridge Systems, LLC |
1,400 | |||
Gamber-Johnson Holdings, LLC |
1,200 | |||
LL Management, Inc.(Lab Logistics) |
1,182 | |||
NRI Clinical Research, LLC |
1,000 | |||
CompareNetworks Topco, LLC |
1,000 | |||
Analytical Systems Keco, LLC |
800 | |||
CTVSH, PLLC |
800 | |||
HW Temps LLC |
800 | |||
ASC Ortho Management Company, LLC |
750 | |||
DTE Enterprises RLOC |
750 | |||
Mac Lean-Fogg Company |
735 | |||
PT Network, LLC |
658 | |||
Invincible Boat Company, LLC. |
648 | |||
TEAM Public Choices, LLC |
614 | |||
Wireless Vision Holdings, LLC |
592 | |||
HDC/HW Intermediate Holdings |
320 | |||
American Nuts, LLC |
281 | |||
Dynamic Communities, LLC |
250 | |||
NinjaTrader, LLC |
200 | |||
| | | | | |
Total loan commitments |
$ | 76,125 | ||
| | | | | |
Total commitments |
$ | 120,440 | ||
| | | | | |
| | | | | |
| | | | | |
Main Street will fund its unfunded commitments from the same sources it uses to fund its investment commitments that are funded at the time they are made (which are typically through existing cash and cash equivalents and borrowings under the Credit Facility). Main Street follows a process to manage its liquidity and ensure that it has available capital to fund its unfunded commitments as necessary. The Company had
186
MAIN STREET CAPITAL CORPORATION
NOTES TO CONSOLIDATED FINANCIAL STATEMENTS — (Continued)
total unrealized depreciation of $0.3 million on the outstanding unfunded commitments as of December 31, 2019.
Effective January 1, 2019, ASC 842 required that a lessee evaluate its leases to determine whether they should be classified as operating or financing leases. Main Street identified one operating lease for its office space. The lease commenced May 15, 2017 and expires January 31, 2028. It contains two five-year extension options for a final expiration date of January 31, 2038.
As Main Street classified this lease as an operating lease prior to implementation, ASC 842-10-65-1 indicates that a right-of-use asset and lease liability should be recorded based on the effective date. Main Street adopted ASC 842 effective January 1, 2019 and recorded a right-of-use asset and a lease liability as of that date. After this date, Main Street has recorded lease expense on a straight-line basis, consistent with the accounting treatment for lease expense prior to the adoption of ASC 842.
Total lease expense incurred by Main Street for each of the years ended December 31 2019, 2018 and 2017 was $0.7 million. As of December 31, 2019, the asset related to the operating lease was $4.8 million and is included in the interest receivable and other assets balance on the consolidated balance sheet. The lease liability was $5.6 million and is included in the accounts payable and other liabilities balance on the consolidated balance sheet. As of December 31, 2019, the remaining lease term was 8.1 years and the discount rate was 4.2%.
The following table shows future minimum payments under Main Street's operating lease as of December 31, 2019 (in thousands):
For the Years Ended December 31,
|
Amount | |||
|---|---|---|---|---|
2020 |
$ | 762 | ||
2021 |
776 | |||
2022 |
790 | |||
2023 |
804 | |||
2024 |
818 | |||
Thereafter |
2,611 | |||
| | | | | |
Total |
$ | 6,561 | ||
| | | | | |
| | | | | |
| | | | | |
Main Street may, from time to time, be involved in litigation arising out of its operations in the normal course of business or otherwise. Furthermore, third parties may try to impose liability on Main Street in connection with the activities of its portfolio companies. While the outcome of any current legal proceedings cannot at this time be predicted with certainty, Main Street does not expect any current matters will materially affect its financial condition or results of operations; however, there can be no assurance whether any pending legal proceedings will have a material adverse effect on Main Street's financial condition or results of operations in any future reporting period.
187
MAIN STREET CAPITAL CORPORATION
NOTES TO CONSOLIDATED FINANCIAL STATEMENTS — (Continued)
NOTE L — SELECTED QUARTERLY DATA (UNAUDITED)
| |
2019 | ||||||||||||
|---|---|---|---|---|---|---|---|---|---|---|---|---|---|
| |
(dollars in thousands, except per share amounts) |
||||||||||||
| |
Qtr. 1 | Qtr. 2 | Qtr. 3 | Qtr. 4 | |||||||||
Total investment income |
$ | 61,365 | $ | 61,293 | $ | 60,068 | $ | 60,649 | |||||
Net investment income |
$ | 39,491 | $ | 39,617 | $ | 39,012 | $ | 39,247 | |||||
Net increase in net assets resulting from operations |
$ | 41,401 | $ | 38,254 | $ | 33,902 | $ | 16,014 | |||||
Net investment income per share — basic and diluted |
$ | 0.64 | $ | 0.63 | $ | 0.62 | $ | 0.62 | |||||
Net increase in net assets resulting from operations per share — basic and diluted |
$ | 0.67 | $ | 0.61 | $ | 0.54 | $ | 0.25 | |||||
| |
2018 | ||||||||||||
|---|---|---|---|---|---|---|---|---|---|---|---|---|---|
| |
(dollars in thousands, except per share amounts) |
||||||||||||
| |
Qtr. 1 | Qtr. 2 | Qtr. 3 | Qtr. 4 | |||||||||
Total investment income |
$ | 55,942 | $ | 59,869 | $ | 58,263 | $ | 59,280 | |||||
Net investment income |
$ | 36,975 | $ | 39,512 | $ | 38,075 | $ | 42,083 | |||||
Net increase in net assets resulting from operations |
$ | 34,517 | $ | 55,451 | $ | 68,740 | $ | 9,505 | |||||
Net investment income per share — basic and diluted |
$ | 0.63 | $ | 0.66 | $ | 0.63 | $ | 0.69 | |||||
Net increase in net assets resulting from operations per share — basic and diluted |
$ | 0.59 | $ | 0.93 | $ | 1.13 | $ | 0.16 | |||||
| |
2017 | ||||||||||||
|---|---|---|---|---|---|---|---|---|---|---|---|---|---|
| |
(dollars in thousands, except per share amounts) |
||||||||||||
| |
Qtr. 1 | Qtr. 2 | Qtr. 3 | Qtr. 4 | |||||||||
Total investment income |
$ | 47,889 | $ | 50,271 | $ | 51,786 | $ | 55,795 | |||||
Net investment income |
$ | 31,166 | $ | 32,693 | $ | 34,029 | $ | 37,483 | |||||
Net increase in net assets resulting from operations |
$ | 31,450 | $ | 42,829 | $ | 34,899 | $ | 61,444 | |||||
Net investment income per share — basic and diluted |
$ | 0.57 | $ | 0.58 | $ | 0.60 | $ | 0.64 | |||||
Net increase in net assets resulting from operations per share — basic and diluted |
$ | 0.57 | $ | 0.76 | $ | 0.61 | $ | 1.05 | |||||
NOTE M — RELATED PARTY TRANSACTIONS
As discussed further in Note D, the External Investment Manager is treated as a wholly owned portfolio company of MSCC and is included as part of Main Street's Investment Portfolio. At December 31, 2019, Main Street had a receivable of approximately $2.7 million due from the External Investment Manager which included (i) approximately $1.6 million related primarily to operating expenses incurred by MSCC or its subsidiaries as required to support the External Investment Manager's business and amounts due from the External Investment Manager to Main Street under a tax sharing agreement (see further discussion in Note D) and (ii) approximately $1.1 million of dividends declared but not paid by the External Investment Manager.
In November 2015, Main Street's Board of Directors approved and adopted the Main Street Capital Corporation Deferred Compensation Plan (the "2015 Deferred Compensation Plan"). The 2015 Deferred Compensation Plan became effective on January 1, 2016 and replaced the Deferred Compensation Plan for Non-Employee Directors previously adopted by the Board of Directors in June 2013 (the "2013 Deferred Compensation Plan"). Under the 2015 Deferred Compensation Plan, non-employee directors and certain key
188
MAIN STREET CAPITAL CORPORATION
NOTES TO CONSOLIDATED FINANCIAL STATEMENTS — (Continued)
employees may defer receipt of some or all of their cash compensation and directors' fees, subject to certain limitations. Individuals participating in the 2015 Deferred Compensation Plan receive distributions of their respective balances based on predetermined payout schedules or other events as defined by the plan and are also able to direct investments made on their behalf among investment alternatives permitted from time to time under the plan, including phantom Main Street stock units. As of December 31, 2019, $8.0 million of compensation and directors' fees had been deferred under the 2015 Deferred Compensation Plan (including amounts previously deferred under the 2013 Deferred Compensation Plan). Of this amount, $4.2 million was deferred into phantom Main Street stock units, representing 119,064 shares of Main Street's common stock. Including phantom stock units issued through dividend reinvestment and net of any shares distributed, the phantom stock units outstanding as of December 31, 2019 represented 150,955 shares of Main Street's common stock. Any amounts deferred under the plan represented by phantom Main Street stock units will not be issued or included as outstanding on the consolidated statements of changes in net assets until such shares are actually distributed to the participant in accordance with the plan, but the related phantom stock units are included in weighted-average shares outstanding with the related dollar amount of the deferral included in total expenses in Main Street's consolidated statements of operations as earned. The dividend amounts related to additional phantom stock units are included in the statements of changes in net assets as an increase to dividends to stockholders offset by a corresponding increase to additional paid-in capital.
NOTE N — SUBSEQUENT EVENTS
During February 2020, Main Street declared regular monthly dividends of $0.205 per share for each month of April, May and June 2020. These regular monthly dividends equal a total of $0.615 per share for the second quarter of 2020 and represent a 2.5% increase from the dividends declared for the second quarter of 2019. Including the dividends declared for the second quarter of 2020, Main Street will have paid $28.370 per share in cumulative dividends since its October 2007 initial public offering.
189
Report of Independent Registered Public Accounting Firm
Board
of Directors and Stockholders
Main Street Capital Corporation
Opinion on financial statement schedule
We have audited in accordance with the standards of the Public Company Accounting Oversight Board (United States) ("PCAOB") the consolidated financial statements of Main Street Capital Corporation and subsidiaries (the "Company") referred to in our report dated February 28, 2020, which is included in the annual report on Form 10-K. Our audits of the consolidated financial statements also included the audit of the financial statement schedule (listed in the index appearing under Item 15(2)). In our opinion, this financial statement schedule, when considered in relation to the consolidated financial statements as a whole, presents fairly, in all material respects, the information set forth therein.
Basis for opinion
This financial statement schedule is the responsibility of the Company's management. Our responsibility is to express an opinion on the Company's financial statement schedule based on our audits. We are a public accounting firm registered with the PCAOB and are required to be independent with respect to the Company in accordance with the U.S. federal securities laws and the applicable rules and regulations of the Securities and Exchange Commission and the PCAOB.
/s/ GRANT THORNTON LLP
Houston,
Texas
February 28, 2020
190
MAIN STREET CAPITAL CORPORATION
Consolidated Schedule of Investments in and Advances to Affiliates
December 31, 2019
(dollars in thousands)
Company
|
Investment(1)(10)(11)
|
Geography | Amount of Realized Gain/(Loss) |
Amount of Unrealized Gain/(Loss) |
Amount of Interest, Fees or Dividends Credited to Income(2) |
December 31, 2018 Fair Value |
Gross Additions(3) |
Gross Reductions(4) |
December 31, 2019 Fair Value |
|||||||||||||||||
|---|---|---|---|---|---|---|---|---|---|---|---|---|---|---|---|---|---|---|---|---|---|---|---|---|---|---|
Majority-owned investments |
||||||||||||||||||||||||||
|
||||||||||||||||||||||||||
Café Brazil, LLC |
Member Units | (8) | $ | — | $ | (2,340 | ) | $ | 233 | $ | 4,780 | $ | — | $ | 2,340 | $ | 2,440 | |||||||||
| | | | | | | | | | | | | | | | | | | | | | | | | | | |
California Splendor Holdings LLC |
LIBOR Plus 8.00% (Floor 1.00%) | (9) | — | — | 1,175 | 10,928 | 17,176 | 21,000 | 7,104 | |||||||||||||||||
|
LIBOR Plus 10.00% (Floor 1.00%) | (9) | — | — | 3,595 | 27,755 | 46 | — | 27,801 | |||||||||||||||||
|
Preferred Member Units | (9) | — | — | 438 | — | 7,438 | 275 | 7,163 | |||||||||||||||||
|
Preferred Member Units | (9) | — | (2,363 | ) | 250 | 9,745 | — | 2,363 | 7,382 | ||||||||||||||||
| | | | | | | | | | | | | | | | | | | | | | | | | | | |
Clad-Rex Steel, LLC |
LIBOR Plus 9.00% (Floor 1.00%) | (5) | — | (128 | ) | 1,367 | 12,080 | 29 | 1,328 | 10,781 | ||||||||||||||||
|
Member Units | (5) | — | (980 | ) | 269 | 10,610 | — | 980 | 9,630 | ||||||||||||||||
|
10% Secured Debt | (5) | — | — | 115 | 1,161 | — | 24 | 1,137 | |||||||||||||||||
|
Member Units | (5) | — | 110 | — | 350 | 110 | — | 460 | |||||||||||||||||
| | | | | | | | | | | | | | | | | | | | | | | | | | | |
CMS Minerals Investments |
Member Units | (9) | — | (359 | ) | 41 | 2,580 | — | 680 | 1,900 | ||||||||||||||||
| | | | | | | | | | | | | | | | | | | | | | | | | | | |
CompareNetworks Topco, LLC |
LIBOR Plus 11.00% (Floor 1.00%) | (9) | — | — | 1,270 | — | 8,924 | 636 | 8,288 | |||||||||||||||||
|
Preferred Member Units | (9) | — | 1,035 | 2 | — | 3,010 | — | 3,010 | |||||||||||||||||
| | | | | | | | | | | | | | | | | | | | | | | | | | | |
Direct Marketing Solutions, Inc. |
LIBOR Plus 11.00% (Floor 1.00%) | (9) | — | 110 | 2,391 | 17,848 | 159 | 2,300 | 15,707 | |||||||||||||||||
|
Preferred Stock | (9) | — | 5,300 | — | 14,900 | 5,300 | — | 20,200 | |||||||||||||||||
| | | | | | | | | | | | | | | | | | | | | | | | | | | |
Gamber-Johnson Holdings, LLC |
LIBOR Plus 6.50% (Floor 2.00%) | (5) | — | (57 | ) | 1,980 | 21,486 | 57 | 2,521 | 19,022 | ||||||||||||||||
|
Member Units | (5) | — | 7,950 | 3,721 | 45,460 | 7,950 | — | 53,410 | |||||||||||||||||
| | | | | | | | | | | | | | | | | | | | | | | | | | | |
GRT Rubber Technologies LLC |
LIBOR Plus 7.00% | (8) | — | (23 | ) | 1,226 | 9,740 | 5,299 | 23 | 15,016 | ||||||||||||||||
|
Member Units | (8) | — | 8,390 | 11,152 | 39,060 | 8,390 | — | 47,450 | |||||||||||||||||
| | | | | | | | | | | | | | | | | | | | | | | | | | | |
Guerdon Modular Holdings, Inc. |
16% Secured Debt | (9) | — | (12,018 | ) | 424 | 12,002 | 16 | 12,018 | — | ||||||||||||||||
|
LIBOR Plus 8.50% (Floor 1.00%) | (9) | — | (1,010 | ) | 9 | — | 1,010 | 1,010 | — | ||||||||||||||||
|
Preferred Stock | (9) | — | — | — | — | — | — | — | |||||||||||||||||
|
Common Stock | (9) | (134 | ) | — | — | — | 134 | 134 | — | ||||||||||||||||
|
Warrants | (9) | — | — | — | — | — | — | — | |||||||||||||||||
| | | | | | | | | | | | | | | | | | | | | | | | | | | |
Harborside Holdings, LLC |
Member Units | (8) | — | (140 | ) | — | 9,500 | 200 | 140 | 9,560 | ||||||||||||||||
| | | | | | | | | | | | | | | | | | | | | | | | | | | |
IDX Broker, LLC |
11.5% Secured Debt | (9) | — | (46 | ) | 1,669 | 14,350 | 46 | 996 | 13,400 | ||||||||||||||||
|
Preferred Member Units | (9) | — | 1,520 | 345 | 13,520 | 1,520 | — | 15,040 | |||||||||||||||||
| | | | | | | | | | | | | | | | | | | | | | | | | | | |
Jensen Jewelers of Idaho, LLC |
Prime Plus 6.75% (Floor 2.00%) | (9) | — | 22 | 406 | 3,355 | 4,001 | 3,356 | 4,000 | |||||||||||||||||
|
Member Units | (9) | — | 3,180 | 953 | 5,090 | 3,180 | — | 8,270 | |||||||||||||||||
| | | | | | | | | | | | | | | | | | | | | | | | | | | |
Kickhaefer Manufacturing Company, LLC |
11.5% Secured Debt | (5) | — | — | 3,265 | 28,775 | 71 | 3,864 | 24,982 | |||||||||||||||||
|
Member Units | (5) | — | — | — | 12,240 | — | — | 12,240 | |||||||||||||||||
|
9.0% Secured Debt | (5) | — | — | 357 | 3,970 | — | 31 | 3,939 | |||||||||||||||||
|
Member Units | (5) | — | 168 | 108 | 992 | 168 | — | 1,160 | |||||||||||||||||
| | | | | | | | | | | | | | | | | | | | | | | | | | | |
Lamb Ventures, LLC |
LIBOR Plus 5.75% | (8) | — | (2 | ) | 10 | — | 402 | 402 | — | ||||||||||||||||
|
11% Secured Debt | (8) | — | (32 | ) | 608 | 8,339 | 3,532 | 11,871 | — | ||||||||||||||||
|
Preferred Equity | (8) | — | — | — | 400 | — | 400 | — | |||||||||||||||||
|
Member Units | (8) | 6,006 | (2,167 | ) | 394 | 7,440 | — | 7,440 | — | ||||||||||||||||
|
9.5% Secured Debt | (8) | — | (4 | ) | 24 | 432 | 4 | 436 | — | ||||||||||||||||
|
Member Units | (8) | (139 | ) | (5 | ) | 74 | 630 | — | 630 | — | |||||||||||||||
| | | | | | | | | | | | | | | | | | | | | | | | | | | |
Market Force Information, LLC |
8% Secured Debt | (9) | — | (92 | ) | 132 | 200 | 2,787 | 292 | 2,695 | ||||||||||||||||
|
6% Current / 6% PIK Secured Debt | (9) | — | (536 | ) | 3,103 | 22,624 | 533 | 536 | 22,621 | ||||||||||||||||
|
Member Units | (9) | — | (9,762 | ) | — | 13,100 | 1,942 | 9,762 | 5,280 | ||||||||||||||||
| | | | | | | | | | | | | | | | | | | | | | | | | | | |
MH Corbin Holding LLC |
5% Current / 5% PIK Secured Debt | (5) | — | 462 | 1,446 | 11,733 | 1,557 | 4,400 | 8,890 | |||||||||||||||||
|
Preferred Member Units | (5) | — | (980 | ) | — | 1,000 | — | 980 | 20 | ||||||||||||||||
|
Preferred Member Units | (5) | — | 370 | — | — | 4,770 | — | 4,770 | |||||||||||||||||
| | | | | | | | | | | | | | | | | | | | | | | | | | | |
Mid-Columbia Lumber Products, LLC |
10% Secured Debt | (9) | — | (148 | ) | 181 | 1,746 | 4 | 148 | 1,602 | ||||||||||||||||
|
12% Secured Debt | (9) | — | (255 | ) | 493 | 3,880 | 19 | 255 | 3,644 | ||||||||||||||||
|
Member Units | (9) | — | (4,098 | ) | 6 | 3,860 | 238 | 4,098 | — | ||||||||||||||||
|
9.5% Secured Debt | (9) | — | — | 69 | 746 | — | 45 | 701 | |||||||||||||||||
|
Member Units | (9) | — | 170 | 73 | 1,470 | 170 | — | 1,640 | |||||||||||||||||
| | | | | | | | | | | | | | | | | | | | | | | | | | | |
MSC Adviser I, LLC |
Member Units | (8) | — | 8,772 | 4,988 | 65,748 | 8,772 | — | 74,520 | |||||||||||||||||
| | | | | | | | | | | | | | | | | | | | | | | | | | | |
Mystic Logistics Holdings, LLC |
12% Secured Debt | (6) | — | — | 875 | 7,506 | 29 | 1,282 | 6,253 | |||||||||||||||||
|
Common Stock | (6) | — | 8,200 | 219 | 210 | 8,200 | — | 8,410 | |||||||||||||||||
| | | | | | | | | | | | | | | | | | | | | | | | | | | |
PPL RVs, Inc. |
LIBOR Plus 8.75% (Floor 0.50%) | (8) | — | (94 | ) | 1,463 | 15,100 | 41 | 3,023 | 12,118 | ||||||||||||||||
|
Common Stock | (8) | — | (450 | ) | — | 10,380 | — | 450 | 9,930 | ||||||||||||||||
| | | | | | | | | | | | | | | | | | | | | | | | | | | |
Principle Environmental, LLC |
13% Secured Debt | (8) | — | (61 | ) | 935 | 7,477 | 61 | 1,141 | 6,397 | ||||||||||||||||
(d/b.a TruHorizon |
Preferred Member Units | (8) | — | 300 | 2,317 | 13,090 | 300 | — | 13,390 | |||||||||||||||||
Environmental Solutions) |
Warrants | (8) | — | 310 | — | 780 | 310 | — | 1,090 | |||||||||||||||||
| | | | | | | | | | | | | | | | | | | | | | | | | | | |
Quality Lease Service, LLC |
Zero Coupon Secured Debt | (7) | (741 | ) | 891 | — | 6,450 | 891 | 7,341 | — | ||||||||||||||||
|
Member Units | (7) | — | (1,490 | ) | — | 3,809 | 6,970 | 1,490 | 9,289 | ||||||||||||||||
| | | | | | | | | | | | | | | | | | | | | | | | | | | |
191
Company
|
Investment(1)(10)(11)
|
Geography | Amount of Realized Gain/(Loss) |
Amount of Unrealized Gain/(Loss) |
Amount of Interest, Fees or Dividends Credited to Income(2) |
December 31, 2018 Fair Value |
Gross Additions(3) |
Gross Reductions(4) |
December 31, 2019 Fair Value |
|||||||||||||||||
|---|---|---|---|---|---|---|---|---|---|---|---|---|---|---|---|---|---|---|---|---|---|---|---|---|---|---|
The MPI Group, LLC |
9% Secured Debt | (7) | — | 342 | 267 | 2,582 | 342 | — | 2,924 | |||||||||||||||||
|
Series A Preferred Units | (7) | (8 | ) | (440 | ) | — | 440 | 8 | 448 | — | |||||||||||||||
|
Warrants | (7) | — | — | — | — | — | — | — | |||||||||||||||||
|
Member Units | (7) | — | (839 | ) | 137 | 2,479 | — | 839 | 1,640 | ||||||||||||||||
| | | | | | | | | | | | | | | | | | | | | | | | | | | |
Trantech Radiator Topco, LLC |
12% Secured Debt | (7) | — | — | 981 | — | 10,302 | 1,200 | 9,102 | |||||||||||||||||
|
Common Stock | (7) | — | — | 68 | — | 4,655 | — | 4,655 | |||||||||||||||||
| | | | | | | | | | | | | | | | | | | | | | | | | | | |
Vision Interests, Inc. |
13% Secured Debt | (9) | — | — | 271 | 2,153 | — | 125 | 2,028 | |||||||||||||||||
|
Series A Preferred Stock | (9) | — | 349 | — | 3,740 | 349 | — | 4,089 | |||||||||||||||||
|
Common Stock | (9) | — | 129 | — | 280 | 129 | — | 409 | |||||||||||||||||
| | | | | | | | | | | | | | | | | | | | | | | | | | | |
Ziegler's NYPD, LLC |
6.5% Secured Debt | (8) | — | (2 | ) | 72 | 1,000 | 2 | 2 | 1,000 | ||||||||||||||||
|
12% Secured Debt | (8) | — | — | 67 | 425 | 200 | — | 625 | |||||||||||||||||
|
14% Secured Debt | (8) | — | — | 402 | 2,750 | — | — | 2,750 | |||||||||||||||||
|
Warrants | (8) | — | — | — | — | — | — | — | |||||||||||||||||
|
Preferred Member Units | (8) | — | 20 | — | 1,249 | 20 | — | 1,269 | |||||||||||||||||
| | | | | | | | | | | | | | | | | | | | | | | | | | | |
Other controlled investments |
||||||||||||||||||||||||||
|
||||||||||||||||||||||||||
Access Media Holdings, LLC |
10% PIK Secured Debt | (5) | — | (2,171 | ) | 50 | 8,558 | — | 2,171 | 6,387 | ||||||||||||||||
|
Preferred Member Units(12) | (5) | — | — | — | (284 | ) | — | — | (284 | ) | |||||||||||||||
|
Member Units | (5) | — | — | — | — | — | — | — | |||||||||||||||||
| | | | | | | | | | | | | | | | | | | | | | | | | | | |
Analytical Systems Keco, LLC |
LIBOR Plus 10.00% (Floor 2.00%) | (8) | — | — | 448 | — | 5,245 | 35 | 5,210 | |||||||||||||||||
|
Preferred Member Units | (8) | — | — | — | — | 3,200 | — | 3,200 | |||||||||||||||||
|
Warrants | (8) | — | — | — | — | 316 | — | 316 | |||||||||||||||||
| | | | | | | | | | | | | | | | | | | | | | | | | | | |
ASC Interests, LLC |
11% Secured Debt | (8) | — | — | 201 | 1,622 | 17 | — | 1,639 | |||||||||||||||||
|
Member Units | (8) | — | (80 | ) | — | 1,370 | — | 80 | 1,290 | ||||||||||||||||
| | | | | | | | | | | | | | | | | | | | | | | | | | | |
ATS Workholding, LLC |
5% Secured Debt | (9) | — | (28 | ) | 364 | 4,390 | 225 | 94 | 4,521 | ||||||||||||||||
|
Preferred Member Units | (9) | — | (2,787 | ) | — | 3,726 | — | 2,787 | 939 | ||||||||||||||||
| | | | | | | | | | | | | | | | | | | | | | | | | | | |
Bond-Coat, Inc. |
15% Secured Debt | (8) | — | (229 | ) | 1,853 | 11,596 | 106 | 229 | 11,473 | ||||||||||||||||
|
Common Stock | (8) | — | (1,070 | ) | — | 9,370 | — | 1,070 | 8,300 | ||||||||||||||||
| | | | | | | | | | | | | | | | | | | | | | | | | | | |
Brewer Crane Holdings, LLC |
LIBOR Plus 10.00% (Floor 1.00%) | (9) | — | — | 1,167 | 9,467 | 18 | 496 | 8,989 | |||||||||||||||||
|
Preferred Member Units | (9) | — | — | 120 | 4,280 | — | — | 4,280 | |||||||||||||||||
| | | | | | | | | | | | | | | | | | | | | | | | | | | |
Bridge Capital Solutions Corporation |
13% Secured Debt | (6) | — | — | 1,480 | 6,221 | 1,576 | — | 7,797 | |||||||||||||||||
|
Warrants | (6) | — | (520 | ) | — | 4,020 | — | 520 | 3,500 | ||||||||||||||||
|
13% Secured Debt | (6) | — | (6 | ) | 101 | 1,000 | 2 | 6 | 996 | ||||||||||||||||
|
Preferred Member Units | (6) | — | — | 75 | 1,000 | — | — | 1,000 | |||||||||||||||||
| | | | | | | | | | | | | | | | | | | | | | | | | | | |
CBT Nuggets, LLC |
Member Units | (9) | — | (10,760 | ) | 300 | 61,610 | — | 10,760 | 50,850 | ||||||||||||||||
| | | | | | | | | | | | | | | | | | | | | | | | | | | |
Centre Technologies Holdings, LLC |
LIBOR Plus 9.00% (Floor 2.00%) | (8) | — | — | 1,572 | — | 12,136 | — | 12,136 | |||||||||||||||||
|
Preferred Member Units | (8) | — | — | 120 | — | 5,840 | — | 5,840 | |||||||||||||||||
| | | | | | | | | | | | | | | | | | | | | | | | | | | |
Chamberlin Holding LLC |
LIBOR Plus 10.00% (Floor 1.00%) | (8) | — | 125 | 2,474 | 20,028 | 174 | 2,429 | 17,773 | |||||||||||||||||
|
Member Units | (8) | — | 5,100 | 1,659 | 18,940 | 5,100 | — | 24,040 | |||||||||||||||||
|
Member Units | (8) | — | 403 | 45 | 732 | 718 | — | 1,450 | |||||||||||||||||
| | | | | | | | | | | | | | | | | | | | | | | | | | | |
Charps, LLC |
11.50% Secured Debt | (5) | — | (83 | ) | 675 | 11,888 | 1,695 | 13,583 | — | ||||||||||||||||
|
15% Secured Debt | (5) | — | — | 175 | — | 2,000 | — | 2,000 | |||||||||||||||||
|
Preferred Member Units | (5) | — | 4,650 | 579 | 2,270 | 4,650 | — | 6,920 | |||||||||||||||||
| | | | | | | | | | | | | | | | | | | | | | | | | | | |
Copper Trail Fund Investments |
LP Interests (CTMH, LP) | (9) | — | — | 5 | 872 | — | — | 872 | |||||||||||||||||
| | | | | | | | | | | | | | | | | | | | | | | | | | | |
Datacom, LLC |
8.00% Secured Debt | (8) | — | (75 | ) | — | 1,690 | — | 75 | 1,615 | ||||||||||||||||
|
10.50% PIK Secured Debt | (8) | — | 361 | — | 9,786 | 361 | 5 | 10,142 | |||||||||||||||||
|
Class A Preferred Member Units | (8) | — | — | — | — | — | — | — | |||||||||||||||||
|
Class B Preferred Member Units | (8) | — | — | — | — | — | — | — | |||||||||||||||||
| | | | | | | | | | | | | | | | | | | | | | | | | | | |
Digital Products Holdings LLC |
LIBOR Plus 10.00% (Floor 1.00%) | (5) | — | (1,025 | ) | 2,944 | 25,511 | 87 | 7,146 | 18,452 | ||||||||||||||||
|
Preferred Member Units | (5) | — | (4,327 | ) | 200 | 8,466 | 1,035 | 4,327 | 5,174 | ||||||||||||||||
| | | | | | | | | | | | | | | | | | | | | | | | | | | |
Garreco, LLC |
LIBOR Plus 8.00% (Floor 1.00%, Ceiling 1.50%) | (8) | — | — | 472 | 5,099 | 18 | 602 | 4,515 | |||||||||||||||||
|
Member Units | (8) | — | (30 | ) | — | 2,590 | — | 30 | 2,560 | ||||||||||||||||
| | | | | | | | | | | | | | | | | | | | | | | | | | | |
Gulf Manufacturing, LLC |
Member Units | (8) | — | (4,260 | ) | 671 | 11,690 | — | 4,260 | 7,430 | ||||||||||||||||
| | | | | | | | | | | | | | | | | | | | | | | | | | | |
Gulf Publishing Holdings, LLC |
LIBOR Plus 9.50% (Floor 1.00%) | (8) | — | — | 25 | — | 320 | 40 | 280 | |||||||||||||||||
|
12.5% Secured Debt | (8) | — | — | 1,619 | 12,594 | 28 | 129 | 12,493 | |||||||||||||||||
|
Member Units | (8) | — | (1,700 | ) | — | 4,120 | — | 1,700 | 2,420 | ||||||||||||||||
| | | | | | | | | | | | | | | | | | | | | | | | | | | |
Harris Preston Fund Investments |
LP Interests (2717 MH, L.P.) | (8) | — | 329 | — | 1,133 | 2,524 | 500 | 3,157 | |||||||||||||||||
| | | | | | | | | | | | | | | | | | | | | | | | | | | |
Harrison Hydra-Gen, Ltd. |
Common Stock | (8) | — | (100 | ) | 247 | 8,070 | — | 100 | 7,970 | ||||||||||||||||
| | | | | | | | | | | | | | | | | | | | | | | | | | | |
KBK Industries, LLC |
Member Units | (5) | — | 6,860 | 1,923 | 8,610 | 6,860 | — | 15,470 | |||||||||||||||||
| | | | | | | | | | | | | | | | | | | | | | | | | | | |
J&J Services, Inc. |
11.50% Secured Debt | (7) | — | — | 531 | — | 17,430 | — | 17,430 | |||||||||||||||||
|
Preferred Stock | (7) | — | — | — | — | 7,160 | — | 7,160 | |||||||||||||||||
| | | | | | | | | | | | | | | | | | | | | | | | | | | |
NAPCO Precast, LLC |
LIBOR Plus 8.50% | (8) | — | (11 | ) | 123 | 11,475 | 11 | 11,486 | — | ||||||||||||||||
|
Member Units | (8) | — | 770 | 3,063 | 13,990 | 770 | — | 14,760 | |||||||||||||||||
| | | | | | | | | | | | | | | | | | | | | | | | | | | |
NexRev LLC |
11% Secured Debt | (8) | — | — | 1,956 | 17,288 | 835 | 654 | 17,469 | |||||||||||||||||
|
Preferred Member Units | (8) | — | (1,580 | ) | 195 | 7,890 | — | 1,580 | 6,310 | ||||||||||||||||
| | | | | | | | | | | | | | | | | | | | | | | | | | | |
NRI Clinical Research, LLC |
LIBOR Plus 6.50% (Floor 1.50%) | (9) | — | — | 11 | — | 200 | 200 | — | |||||||||||||||||
|
14% Secured Debt | (9) | — | (44 | ) | 971 | 6,685 | 44 | 748 | 5,981 | ||||||||||||||||
|
Warrants | (9) | — | 570 | — | 660 | 570 | — | 1,230 | |||||||||||||||||
|
Member Units | (9) | — | 2,510 | 32 | 2,478 | 2,510 | — | 4,988 | |||||||||||||||||
| | | | | | | | | | | | | | | | | | | | | | | | | | | |
NRP Jones, LLC |
12% Secured Debt | (5) | — | — | 776 | 6,376 | — | — | 6,376 | |||||||||||||||||
|
Member Units | (5) | — | (1,250 | ) | 323 | 5,960 | — | 1,250 | 4,710 | ||||||||||||||||
| | | | | | | | | | | | | | | | | | | | | | | | | | | |
192
Company
|
Investment(1)(10)(11)
|
Geography | Amount of Realized Gain/(Loss) |
Amount of Unrealized Gain/(Loss) |
Amount of Interest, Fees or Dividends Credited to Income(2) |
December 31, 2018 Fair Value |
Gross Additions(3) |
Gross Reductions(4) |
December 31, 2019 Fair Value |
|||||||||||||||||
|---|---|---|---|---|---|---|---|---|---|---|---|---|---|---|---|---|---|---|---|---|---|---|---|---|---|---|
NuStep, LLC |
12% Secured Debt | (5) | — | — | 2,556 | 20,458 | 44 | 799 | 19,703 | |||||||||||||||||
|
Preferred Member Units | (5) | — | — | — | 10,200 | — | — | 10,200 | |||||||||||||||||
| | | | | | | | | | | | | | | | | | | | | | | | | | | |
OMi Holdings, Inc. |
Common Stock | (8) | — | 930 | 1,920 | 16,020 | 930 | — | 16,950 | |||||||||||||||||
| | | | | | | | | | | | | | | | | | | | | | | | | | | |
Pegasus Research Group, LLC |
Member Units | (8) | — | 490 | — | 7,680 | 490 | — | 8,170 | |||||||||||||||||
| | | | | | | | | | | | | | | | | | | | | | | | | | | |
River Aggregates, LLC |
Zero Coupon Secured Debt | (8) | — | — | — | 722 | — | — | 722 | |||||||||||||||||
|
Member Units | (8) | — | 380 | — | 4,610 | 380 | — | 4,990 | |||||||||||||||||
|
Member Units | (8) | — | 239 | — | 2,930 | 239 | — | 3,169 | |||||||||||||||||
| | | | | | | | | | | | | | | | | | | | | | | | | | | |
Tedder Industries, LLC |
12%, Secured Debt | (9) | — | — | 69 | 480 | 1,200 | 1,040 | 640 | |||||||||||||||||
|
12%, Secured Debt | (9) | — | — | 2,021 | 16,246 | 26 | — | 16,272 | |||||||||||||||||
|
Preferred Member Units | (9) | — | — | — | 7,476 | 660 | — | 8,136 | |||||||||||||||||
| | | | | | | | | | | | | | | | | | | | | | | | | | | |
Other |
||||||||||||||||||||||||||
Amounts related to investments transferred to or from other 1940 Act classification during the period |
(187 | ) | 260 | (133 | ) | 5,809 | — | — | — | |||||||||||||||||
| | | | | | | | | | | | | | | | | | | | | | | | | | | |
Total Control investments |
$ | 4,797 | $ | (980 | ) | $ | 92,414 | $ | 1,004,993 | $ | 219,523 | $ | 185,986 | $ | 1,032,721 | |||||||||||
| | | | | | | | | | | | | | | | | | | | | | | | | | | |
| | | | | | | | | | | | | | | | | | | | | | | | | | | |
| | | | | | | | | | | | | | | | | | | | | | | | | | | |
193
Company
|
Investment(1)(10)(11) | Geography | Amount of Realized Gain/(Loss) |
Amount of Unrealized Gain/(Loss) |
Amount of Interest, Fee or Dividends Credited to Income(2) |
December 31, 2018 Fair Value |
Gross Additions(3) |
Gross Reductions(4) |
December 31, 2019 Fair Value |
|||||||||||||||||
|---|---|---|---|---|---|---|---|---|---|---|---|---|---|---|---|---|---|---|---|---|---|---|---|---|---|---|
Affiliate Investments |
||||||||||||||||||||||||||
|
||||||||||||||||||||||||||
AFG Capital Group, LLC |
Warrants | (8) | $ | 781 | $ | (691 | ) | $ | — | $ | 950 | $ | — | $ | 950 | $ | — | |||||||||
|
10% Secured Debt | (8) | — | — | 66 | — | 1,040 | 202 | 838 | |||||||||||||||||
|
Preferred Member Units | (8) | — | 1,200 | (40 | ) | 3,980 | 1,200 | — | 5,180 | ||||||||||||||||
| | | | | | | | | | | | | | | | | | | | | | | | | | | |
American Trailer Rental Group LLC |
LIBOR Plus 7.25% (Floor 1.00%) | (5) | — | 182 | 2,655 | 20,312 | 8,729 | 1,954 | 27,087 | |||||||||||||||||
|
Member Units | (5) | — | 2,760 | — | 5,780 | 2,760 | — | 8,540 | |||||||||||||||||
| | | | | | | | | | | | | | | | | | | | | | | | | | | |
BBB Tank Services, LLC |
LIBOR Plus 11% (Floor 1.00%) | (8) | — | — | 680 | 3,833 | 865 | — | 4,698 | |||||||||||||||||
|
Preferred Member Units | (8) | — | — | 18 | 113 | 18 | — | 131 | |||||||||||||||||
|
Member Units | (8) | — | 60 | — | 230 | 60 | — | 290 | |||||||||||||||||
| | | | | | | | | | | | | | | | | | | | | | | | | | | |
Boccella Precast Products LLC |
LIBOR Plus 12% (Floor 1.00%) | (6) | — | (75 | ) | 2,187 | 15,724 | 475 | 2,955 | 13,244 | ||||||||||||||||
|
Member Units | (6) | — | 1,094 | 236 | 5,080 | 1,190 | — | 6,270 | |||||||||||||||||
| | | | | | | | | | | | | | | | | | | | | | | | | | | |
Boss Industries, LLC |
Preferred Member Units | (5) | 3,771 | (3,930 | ) | 611 | 6,176 | — | 6,176 | — | ||||||||||||||||
| | | | | | | | | | | | | | | | | | | | | | | | | | | |
Buca C, LLC |
LIBOR Plus 9.25% (Floor 1.00%) | (7) | — | (187 | ) | 2,260 | 19,038 | 43 | 287 | 18,794 | ||||||||||||||||
|
Preferred Member Units | (7) | — | — | 270 | 4,431 | 270 | — | 4,701 | |||||||||||||||||
| | | | | | | | | | | | | | | | | | | | | | | | | | | |
CAI Software LLC |
11% Secured Debt | (6) | — | (34 | ) | 1,239 | 10,880 | 34 | 1,754 | 9,160 | ||||||||||||||||
|
Member Units | (6) | — | 2,493 | 31 | 2,717 | 2,493 | — | 5,210 | |||||||||||||||||
| | | | | | | | | | | | | | | | | | | | | | | | | | | |
Chandler Signs Holdings, LLC |
12% Secured Debt | (8) | — | (24 | ) | 581 | 4,546 | 47 | 4,593 | — | ||||||||||||||||
|
Class A Units | (8) | — | 620 | 39 | 2,120 | 620 | — | 2,740 | |||||||||||||||||
| | | | | | | | | | | | | | | | | | | | | | | | | | | |
Charlotte Russe, Inc |
8.50% Secured Debt | (9) | (7,012 | ) | 4,003 | — | 3,930 | 4,003 | 7,933 | — | ||||||||||||||||
|
Common Stock | (9) | — | — | — | — | — | — | — | |||||||||||||||||
| | | | | | | | | | | | | | | | | | | | | | | | | | | |
Condit Exhibits, LLC |
Member Units | (9) | 1,850 | (1,850 | ) | 132 | 1,950 | — | 1,950 | — | ||||||||||||||||
| | | | | | | | | | | | | | | | | | | | | | | | | | | |
Congruent Credit |
LP Interests (Fund II) | (8) | — | — | — | 855 | — | — | 855 | |||||||||||||||||
Opportunities Funds |
LP Interests (Fund III) | (8) | — | (195 | ) | 1,447 | 17,468 | — | 3,553 | 13,915 | ||||||||||||||||
| | | | | | | | | | | | | | | | | | | | | | | | | | | |
Copper Trail Fund Investments |
LP Interests (Copper Trail Energy Fund I, LP) | (9) | 37 | (310 | ) | 583 | 4,170 | — | 1,808 | 2,362 | ||||||||||||||||
| | | | | | | | | | | | | | | | | | | | | | | | | | | |
Dos Rios Partners |
LP Interests (Dos Rios Partners, LP) | (8) | — | (122 | ) | — | 7,153 | — | 120 | 7,033 | ||||||||||||||||
|
LP Interests (Dos Rios Partners — A, LP) | (8) | — | (38 | ) | — | 2,271 | — | 38 | 2,233 | ||||||||||||||||
| | | | | | | | | | | | | | | | | | | | | | | | | | | |
East Teak Fine Hardwoods, Inc. |
Common Stock | (7) | — | (160 | ) | 16 | 560 | — | 160 | 400 | ||||||||||||||||
| | | | | | | | | | | | | | | | | | | | | | | | | | | |
EIG Fund Investments |
LP Interests (EIG Global Private Debt fund-A, L.P.) | (8) | 8 | — | 137 | 505 | 283 | 68 | 720 | |||||||||||||||||
| | | | | | | | | | | | | | | | | | | | | | | | | | | |
Freeport Financial Funds |
LP Interests (Freeport Financial SBIC Fund LP) | (5) | — | 379 | — | 5,399 | 379 | — | 5,778 | |||||||||||||||||
|
LP Interests (Freeport First Lien Loan Fund III LP) | (5) | — | (84 | ) | 1,059 | 10,980 | 799 | 2,083 | 9,696 | ||||||||||||||||
| | | | | | | | | | | | | | | | | | | | | | | | | | | |
Fuse, LLC |
12% Secured Debt | (9) | — | — | 119 | — | 1,939 | — | 1,939 | |||||||||||||||||
|
Common Stock | (9) | — | — | — | — | 256 | — | 256 | |||||||||||||||||
| | | | | | | | | | | | | | | | | | | | | | | | | | | |
Harris Preston Fund Investments |
LP Interests (HPEP 3, L.P.) | (8) | — | — | — | 1,733 | 741 | — | 2,474 | |||||||||||||||||
| | | | | | | | | | | | | | | | | | | | | | | | | | | |
Hawk Ridge Systems, LLC |
LIBOR Plus 6.00% (Floor 1.00%) | (9) | — | — | 26 | — | 600 | — | 600 | |||||||||||||||||
|
11.0% Secured Debt | (9) | — | (34 | ) | 1,460 | 14,300 | 34 | 934 | 13,400 | ||||||||||||||||
|
Preferred Member Units | (9) | — | 640 | 375 | 7,260 | 640 | — | 7,900 | |||||||||||||||||
|
Preferred Member Units | (9) | — | 40 | — | 380 | 40 | — | 420 | |||||||||||||||||
| | | | | | | | | | | | | | | | | | | | | | | | | | | |
Houston Plating and Coatings, LLC |
8% Unsecured Convertible Debt | (8) | — | 540 | 243 | 3,720 | 540 | — | 4,260 | |||||||||||||||||
|
Member Units | (8) | — | 1,884 | 544 | 8,330 | 2,000 | — | 10,330 | |||||||||||||||||
| | | | | | | | | | | | | | | | | | | | | | | | | | | |
I-45 SLF LLC |
Member Units | (8) | — | (2,020 | ) | 3,204 | 15,627 | 800 | 2,020 | 14,407 | ||||||||||||||||
| | | | | | | | | | | | | | | | | | | | | | | | | | | |
L.F. Manufacturing Holdings, LLC |
Preferred Member Units | (8) | — | — | 11 | — | 81 | — | 81 | |||||||||||||||||
|
Member Units | (8) | — | (10 | ) | — | 2,060 | — | 10 | 2,050 | ||||||||||||||||
| | | | | | | | | | | | | | | | | | | | | | | | | | | |
OnAsset Intelligence, Inc. |
12% PIK Secured Debt | (8) | — | — | 731 | 5,743 | 731 | — | 6,474 | |||||||||||||||||
|
10% PIK Secured Debt | (8) | — | — | 5 | 53 | 5 | — | 58 | |||||||||||||||||
|
Preferred Stock | (8) | — | — | — | — | — | — | — | |||||||||||||||||
|
Warrants | (8) | — | — | — | — | — | — | — | |||||||||||||||||
| | | | | | | | | | | | | | | | | | | | | | | | | | | |
PCI Holding Company, Inc. |
12% Current Secured Debt | (9) | — | — | 1,488 | 11,908 | 98 | 650 | 11,356 | |||||||||||||||||
|
Preferred Stock | (9) | — | 2,340 | — | 340 | 2,340 | — | 2,680 | |||||||||||||||||
|
Preferred Stock | (9) | — | 870 | — | 3,480 | 870 | — | 4,350 | |||||||||||||||||
| | | | | | | | | | | | | | | | | | | | | | | | | | | |
Rocaceia, LLC (Quality Lease |
12% Secured Debt | (8) | — | 165 | — | 250 | 165 | 415 | — | |||||||||||||||||
and Rental Holdings, LLC) |
Preferred Member Units | (8) | — | — | — | — | — | — | — | |||||||||||||||||
| | | | | | | | | | | | | | | | | | | | | | | | | | | |
Salado Stone Holdings, LLC |
Class A Preferred Units | (8) | — | (470 | ) | — | 1,040 | — | 470 | 570 | ||||||||||||||||
| | | | | | | | | | | | | | | | | | | | | | | | | | | |
SI East, LLC |
9.50% Current, Secured Debt | (7) | — | 275 | 3,648 | 34,885 | 365 | 2,287 | 32,963 | |||||||||||||||||
|
Preferred Member Units | (7) | — | 2,200 | 460 | 6,000 | 2,200 | — | 8,200 | |||||||||||||||||
| | | | | | | | | | | | | | | | | | | | | | | | | | | |
Slick Innovations, LLC |
14% Current, Secured Debt | (6) | — | — | 983 | 6,959 | 679 | 1,441 | 6,197 | |||||||||||||||||
|
Warrants | (6) | — | 109 | — | 181 | 109 | — | 290 | |||||||||||||||||
|
Common Stock | (6) | — | 380 | 1,048 | 700 | 380 | — | 1,080 | |||||||||||||||||
| | | | | | | | | | | | | | | | | | | | | | | | | | | |
UniTek Global Services, Inc. |
LIBOR Plus 6.50% (Floor 1.00%) | (6) | — | 22 | 260 | 2,969 | 23 | 30 | 2,962 | |||||||||||||||||
|
Preferred Stock | (6) | — | (5,240 | ) | 511 | 7,413 | 511 | 5,240 | 2,684 | ||||||||||||||||
|
Preferred Stock | (6) | — | 306 | 339 | 1,637 | 645 | — | 2,282 | |||||||||||||||||
|
Preferred Stock | (6) | — | 1,080 | 53 | — | 1,889 | — | 1,889 | |||||||||||||||||
|
Preferred Stock | (6) | — | — | 629 | 3,038 | 629 | — | 3,667 | |||||||||||||||||
|
Common Stock | (6) | — | (1,420 | ) | — | 1,420 | — | 1,420 | — | ||||||||||||||||
| | | | | | | | | | | | | | | | | | | | | | | | | | | |
Universal Wellhead Services |
Preferred Member Units | (8) | — | (345 | ) | 195 | 950 | 195 | 345 | 800 | ||||||||||||||||
Holdings, LLC |
Member Units | (8) | — | (2,330 | ) | — | 2,330 | — | 2,330 | — | ||||||||||||||||
| | | | | | | | | | | | | | | | | | | | | | | | | | | |
194
Company
|
Investment(1)(10)(11) | Geography | Amount of Realized Gain/(Loss) |
Amount of Unrealized Gain/(Loss) |
Amount of Interest, Fee or Dividends Credited to Income(2) |
December 31, 2018 Fair Value |
Gross Additions(3) |
Gross Reductions(4) |
December 31, 2019 Fair Value |
|||||||||||||||||
|---|---|---|---|---|---|---|---|---|---|---|---|---|---|---|---|---|---|---|---|---|---|---|---|---|---|---|
Volusion, LLC |
11.50% Secured Debt | (8) | — | (810 | ) | 3,132 | 18,407 | 1,755 | 810 | 19,352 | ||||||||||||||||
|
8% Unsecured Convertible Debt | (8) | — | (118 | ) | 31 | 297 | 112 | 118 | 291 | ||||||||||||||||
|
Preferred Member Units | (8) | — | — | — | 14,000 | — | — | 14,000 | |||||||||||||||||
|
Warrants | (8) | — | (1,740 | ) | — | 1,890 | — | 1,740 | 150 | ||||||||||||||||
| | | | | | | | | | | | | | | | | | | | | | | | | | | |
Other |
||||||||||||||||||||||||||
Amounts related to investments transferred to or from other 1940 Act classification during the period |
— | (415 | ) | 1,030 | 19,439 | — | — | — | ||||||||||||||||||
| | | | | | | | | | | | | | | | | | | | | | | | | | | |
Total Affiliate investments |
$ | (565 | ) | $ | 990 | $ | 34,732 | $ | 359,890 | $ | 46,680 | $ | 56,844 | $ | 330,287 | |||||||||||
| | | | | | | | | | | | | | | | | | | | | | | | | | | |
| | | | | | | | | | | | | | | | | | | | | | | | | | | |
| | | | | | | | | | | | | | | | | | | | | | | | | | | |
195
Schedule 12-14
MAIN STREET CAPITAL CORPORATION
Consolidated Schedule of Investments in and Advances to Affiliates
December 31, 2018
(dollars in thousands)
Company
|
Investment(1)(10)(11)
|
Geography | Amount of Realized Gain/(Loss) |
Amount of Unrealized Gain/(Loss) |
Amount of Interest, Fees or Dividends Credited to Income(2) |
December 31, 2017 Fair Value |
Gross Additions(3) |
Gross Reductions(4) |
December 31, 2018 Fair Value |
|||||||||||||||||
|---|---|---|---|---|---|---|---|---|---|---|---|---|---|---|---|---|---|---|---|---|---|---|---|---|---|---|
Majority-owned investments |
||||||||||||||||||||||||||
|
||||||||||||||||||||||||||
Café Brazil, LLC |
Member Units | (8) | $ | — | $ | (120 | ) | $ | 291 | $ | 4,900 | $ | — | $ | 120 | $ | 4,780 | |||||||||
| | | | | | | | | | | | | | | | | | | | | | | | | | | |
California Splendor Holdings LLC |
LIBOR Plus 8.00% (Floor 1.00%) | (9) | — | — | 1,025 | — | 21,128 | 10,200 | 10,928 | |||||||||||||||||
|
LIBOR Plus 10.00% (Floor 1.00%) | (9) | — | — | 2,990 | — | 27,755 | — | 27,755 | |||||||||||||||||
|
Preferred Member Units | (9) | — | (1,030 | ) | 178 | — | 12,500 | 2,755 | 9,745 | ||||||||||||||||
| | | | | | | | | | | | | | | | | | | | | | | | | | | |
Clad-Rex Steel, LLC |
LIBOR Plus 9.50% (Floor 1.00%) | (5) | — | (33 | ) | 1,517 | 13,280 | 33 | 1,233 | 12,080 | ||||||||||||||||
|
Member Units | (5) | — | 1,110 | 500 | 9,500 | 1,110 | — | 10,610 | |||||||||||||||||
|
10% Secured Debt | (5) | — | — | 117 | 1,183 | — | 22 | 1,161 | |||||||||||||||||
|
Member Units | (5) | — | 70 | — | 280 | 70 | — | 350 | |||||||||||||||||
| | | | | | | | | | | | | | | | | | | | | | | | | | | |
CMS Minerals Investments |
Member Units | (9) | — | 921 | 117 | 2,392 | 921 | 733 | 2,580 | |||||||||||||||||
| | | | | | | | | | | | | | | | | | | | | | | | | | | |
Direct Marketing Solutions, Inc. |
LIBOR Plus 11.00% (Floor 1.00%) | (9) | — | — | 2,502 | — | 18,631 | 783 | 17,848 | |||||||||||||||||
|
Preferred Stock | (9) | — | 6,500 | — | — | 14,900 | — | 14,900 | |||||||||||||||||
| | | | | | | | | | | | | | | | | | | | | | | | | | | |
Gamber-Johnson Holdings, LLC |
LIBOR Plus 7.50% (Floor 2.00%) | (5) | — | (57 | ) | 2,579 | 23,400 | 57 | 1,971 | 21,486 | ||||||||||||||||
|
Member Units | (5) | — | 22,090 | 1,797 | 23,370 | 22,090 | — | 45,460 | |||||||||||||||||
| | | | | | | | | | | | | | | | | | | | | | | | | | | |
GRT Rubber Technologies LLC |
LIBOR Plus 7.00% | (8) | — | (30 | ) | 1,199 | 11,603 | 30 | 1,893 | 9,740 | ||||||||||||||||
|
Member Units | (8) | — | 17,090 | 2,876 | 21,970 | 17,090 | — | 39,060 | |||||||||||||||||
| | | | | | | | | | | | | | | | | | | | | | | | | | | |
Harborside Holdings, LLC |
Member Units | (8) | — | — | — | 9,400 | 100 | — | 9,500 | |||||||||||||||||
| | | | | | | | | | | | | | | | | | | | | | | | | | | |
Harris Preston Fund Investments |
LP Interests (2717 MH, L.P.) | (8) | — | 93 | — | 536 | 597 | — | 1,133 | |||||||||||||||||
| | | | | | | | | | | | | | | | | | | | | | | | | | | |
Hydratec, Inc. |
Common Stock | (9) | 7,922 | (7,905 | ) | 332 | 15,000 | — | 15,000 | — | ||||||||||||||||
| | | | | | | | | | | | | | | | | | | | | | | | | | | |
IDX Broker, LLC |
11.5% Secured Debt | (9) | — | (47 | ) | 1,765 | 15,250 | 47 | 947 | 14,350 | ||||||||||||||||
|
Preferred Member Units | (9) | — | 1,860 | 276 | 11,660 | 1,860 | — | 13,520 | |||||||||||||||||
| | | | | | | | | | | | | | | | | | | | | | | | | | | |
Jensen Jewelers of Idaho, LLC |
Prime Plus 6.75% (Floor 2.00%) | (9) | — | (20 | ) | 450 | 3,955 | 20 | 620 | 3,355 | ||||||||||||||||
|
Member Units | (9) | — | (10 | ) | 250 | 5,100 | — | 10 | 5,090 | ||||||||||||||||
| | | | | | | | | | | | | | | | | | | | | | | | | | | |
Lamb Ventures, LLC |
11% Secured Debt | (8) | — | (18 | ) | 976 | 9,942 | 218 | 1,821 | 8,339 | ||||||||||||||||
|
Preferred Equity | (8) | — | — | — | 400 | — | — | 400 | |||||||||||||||||
|
Member Units | (8) | — | 650 | — | 6,790 | 650 | — | 7,440 | |||||||||||||||||
|
9.5% Secured Debt | (8) | — | — | 42 | 432 | — | — | 432 | |||||||||||||||||
|
Member Units | (8) | — | 110 | 53 | 520 | 110 | — | 630 | |||||||||||||||||
| | | | | | | | | | | | | | | | | | | | | | | | | | | |
Mid-Columbia Lumber Products, LLC |
10% Secured Debt | (9) | — | — | 182 | 1,390 | 356 | — | 1,746 | |||||||||||||||||
|
12% Secured Debt | (9) | — | — | 491 | 3,863 | 17 | — | 3,880 | |||||||||||||||||
|
Member Units | (9) | — | 1,689 | 6 | 1,575 | 2,285 | — | 3,860 | |||||||||||||||||
|
9.5% Secured Debt | (9) | — | — | 74 | 791 | — | 45 | 746 | |||||||||||||||||
|
Member Units | (9) | — | 180 | 57 | 1,290 | 180 | — | 1,470 | |||||||||||||||||
| | | | | | | | | | | | | | | | | | | | | | | | | | | |
MSC Adviser I, LLC |
Member Units | (8) | — | 23,980 | 3,822 | 41,768 | 23,980 | — | 65,748 | |||||||||||||||||
| | | | | | | | | | | | | | | | | | | | | | | | | | | |
Mystic Logistics Holdings, LLC |
12% Secured Debt | (6) | — | — | 969 | 7,696 | 42 | 232 | 7,506 | |||||||||||||||||
|
Common Stock | (6) | — | (6,610 | ) | — | 6,820 | — | 6,610 | 210 | ||||||||||||||||
| | | | | | | | | | | | | | | | | | | | | | | | | | | |
NexRev LLC |
11% Secured Debt | (8) | — | — | 1,829 | — | 17,288 | — | 17,288 | |||||||||||||||||
|
Preferred Member Units | (8) | — | 1,010 | 60 | — | 7,890 | — | 7,890 | |||||||||||||||||
| | | | | | | | | | | | | | | | | | | | | | | | | | | |
NRP Jones, LLC |
12% Secured Debt | (5) | — | — | 776 | 6,376 | — | — | 6,376 | |||||||||||||||||
|
Member Units | (5) | — | 2,710 | — | 3,250 | 2,710 | — | 5,960 | |||||||||||||||||
| | | | | | | | | | | | | | | | | | | | | | | | | | | |
PPL RVs, Inc. |
LIBOR Plus 7.00% (Floor 0.50%) | (8) | — | (35 | ) | 1,487 | 16,100 | 35 | 1,035 | 15,100 | ||||||||||||||||
|
Common Stock | (8) | — | (2,060 | ) | 3 | 12,440 | — | 2,060 | 10,380 | ||||||||||||||||
| | | | | | | | | | | | | | | | | | | | | | | | | | | |
Principle Environmental, LLC (d/b.a TruHorizon Environmental Solutions) |
13% Secured Debt | (8) | — | (51 | ) | 1,037 | 7,477 | 51 | 51 | 7,477 | ||||||||||||||||
|
Preferred Member Units | (8) | — | 1,600 | 1,482 | 11,490 | 1,600 | — | 13,090 | |||||||||||||||||
|
Warrants | (8) | — | 130 | — | 650 | 130 | — | 780 | |||||||||||||||||
| | | | | | | | | | | | | | | | | | | | | | | | | | | |
Quality Lease Service, LLC |
Zero Coupon Secured Debt | (7) | — | (500 | ) | — | 6,950 | — | 500 | 6,450 | ||||||||||||||||
|
Member Units | (7) | — | (2,303 | ) | — | 4,938 | 1,174 | 2,303 | 3,809 | ||||||||||||||||
| | | | | | | | | | | | | | | | | | | | | | | | | | | |
Tedder Industries, LLC |
12%, Secured Debt | (9) | — | — | 20 | — | 480 | — | 480 | |||||||||||||||||
|
12%, Secured Debt | (9) | — | — | 1,010 | — | 16,246 | — | 16,246 | |||||||||||||||||
|
Member Units | (9) | — | — | — | — | 7,476 | — | 7,476 | |||||||||||||||||
| | | | | | | | | | | | | | | | | | | | | | | | | | | |
The MPI Group, LLC |
9% Secured Debt | (7) | — | 171 | 268 | 2,410 | 172 | — | 2,582 | |||||||||||||||||
|
Series A Preferred Units | (7) | — | 440 | — | — | 440 | — | 440 | |||||||||||||||||
|
Warrants | (7) | — | — | — | — | — | — | — | |||||||||||||||||
|
Member Units | (7) | — | 90 | 190 | 2,389 | 90 | — | 2,479 | |||||||||||||||||
| | | | | | | | | | | | | | | | | | | | | | | | | | | |
Uvalco Supply, LLC |
9% Secured Debt | (8) | — | — | 7 | 348 | — | 348 | — | |||||||||||||||||
|
Member Units | (8) | 301 | (301 | ) | 898 | 3,880 | — | 3,880 | — | ||||||||||||||||
| | | | | | | | | | | | | | | | | | | | | | | | | | | |
Vision Interests, Inc. |
13% Secured Debt | (9) | — | — | 364 | 2,797 | 17 | 661 | 2,153 | |||||||||||||||||
|
Series A Preferred Stock | (9) | — | 740 | — | 3,000 | 740 | — | 3,740 | |||||||||||||||||
|
Common Stock | (9) | — | 280 | — | — | 280 | — | 280 | |||||||||||||||||
| | | | | | | | | | | | | | | | | | | | | | | | | | | |
Ziegler's NYPD, LLC |
6.5% Secured Debt | (8) | — | 2 | 68 | 996 | 4 | — | 1,000 | |||||||||||||||||
|
12% Secured Debt | (8) | — | — | 47 | 300 | 125 | — | 425 | |||||||||||||||||
|
14% Secured Debt | (8) | — | — | 390 | 2,750 | — | — | 2,750 | |||||||||||||||||
|
Warrants | (8) | — | — | — | — | — | — | — | |||||||||||||||||
|
Preferred Member Units | (8) | — | (1,970 | ) | — | 3,220 | — | 1,971 | 1,249 | ||||||||||||||||
| | | | | | | | | | | | | | | | | | | | | | | | | | | |
|
||||||||||||||||||||||||||
196
Company
|
Investment(1)(10)(11)
|
Geography | Amount of Realized Gain/(Loss) |
Amount of Unrealized Gain/(Loss) |
Amount of Interest, Fees or Dividends Credited to Income(2) |
December 31, 2017 Fair Value |
Gross Additions(3) |
Gross Reductions(4) |
December 31, 2018 Fair Value |
|||||||||||||||||
|---|---|---|---|---|---|---|---|---|---|---|---|---|---|---|---|---|---|---|---|---|---|---|---|---|---|---|
Other controlled investments |
||||||||||||||||||||||||||
|
||||||||||||||||||||||||||
Access Media Holdings, LLC |
10% PIK Secured Debt | (5) | — | (8,592 | ) | 25 | 17,150 | — | 8,592 | 8,558 | ||||||||||||||||
|
Preferred Member Units (12) | (5) | — | (1,517 | ) | — | — | 1,233 | 1,517 | (284 | ) | |||||||||||||||
|
Member Units | (5) | — | — | — | — | — | — | — | |||||||||||||||||
| | | | | | | | | | | | | | | | | | | | | | | | | | | |
ASC Interests, LLC |
11% Secured Debt | (8) | — | — | 199 | 1,795 | — | 173 | 1,622 | |||||||||||||||||
|
Member Units | (8) | — | (160 | ) | — | 1,530 | — | 160 | 1,370 | ||||||||||||||||
| | | | | | | | | | | | | | | | | | | | | | | | | | | |
ATS Workholding, LLC |
5% Secured Debt | (9) | — | (117 | ) | 334 | 3,249 | 1,258 | 117 | 4,390 | ||||||||||||||||
|
Preferred Member Units | (9) | — | — | — | 3,726 | — | — | 3,726 | |||||||||||||||||
| | | | | | | | | | | | | | | | | | | | | | | | | | | |
Bond-Coat, Inc. |
12% Secured Debt | (8) | — | 229 | 1,482 | 11,596 | — | — | 11,596 | |||||||||||||||||
|
Common Stock | (8) | — | — | — | 9,370 | — | — | 9,370 | |||||||||||||||||
| | | | | | | | | | | | | | | | | | | | | | | | | | | |
Brewer Crane Holdings, LLC |
LIBOR Plus 10.00% (Floor 1.00%) | (9) | — | — | 1,274 | — | 9,839 | 372 | 9,467 | |||||||||||||||||
|
Preferred Member Units | (9) | — | — | 117 | — | 4,280 | — | 4,280 | |||||||||||||||||
| | | | | | | | | | | | | | | | | | | | | | | | | | | |
CBT Nuggets, LLC |
Member Units | (9) | — | (27,950 | ) | 11,395 | 89,560 | — | 27,950 | 61,610 | ||||||||||||||||
| | | | | | | | | | | | | | | | | | | | | | | | | | | |
Chamberlin Holding LLC |
LIBOR Plus 10.00% (Floor 1.00%) | (8) | — | — | 2,645 | — | 21,425 | 1,397 | 20,028 | |||||||||||||||||
|
Member Units | (8) | — | 7,500 | 2,349 | — | 18,940 | — | 18,940 | |||||||||||||||||
|
Member Units | (8) | — | — | — | — | 732 | — | 732 | |||||||||||||||||
| | | | | | | | | | | | | | | | | | | | | | | | | | | |
Charps, LLC |
LIBOR Plus 7.00% (Floor 1.00%) | (5) | — | — | 45 | — | 1,600 | 1,600 | — | |||||||||||||||||
|
12% Secured Debt | (5) | — | 83 | 2,034 | 18,225 | 163 | 6,500 | 11,888 | |||||||||||||||||
|
Preferred Member Units | (5) | — | 1,620 | 250 | 650 | 1,620 | — | 2,270 | |||||||||||||||||
| | | | | | | | | | | | | | | | | | | | | | | | | | | |
Copper Trail Fund Investments |
LP Interests (CTMH, LP) | (9) | — | — | 22 | — | 872 | — | 872 | |||||||||||||||||
|
LP Interests (Copper Trail Energy Fund I, LP) | (9) | — | 675 | 57 | 2,500 | 1,944 | 274 | 4,170 | |||||||||||||||||
| | | | | | | | | | | | | | | | | | | | | | | | | | | |
Datacom, LLC |
8% Secured Debt | (8) | — | (110 | ) | 33 | 1,575 | 225 | 110 | 1,690 | ||||||||||||||||
|
10.50% PIK Secured Debt | (8) | — | (1,493 | ) | 330 | 11,110 | 169 | 1,493 | 9,786 | ||||||||||||||||
|
Class A Preferred Member Units | (8) | — | (843 | ) | — | 730 | 113 | 843 | — | ||||||||||||||||
|
Class B Preferred Member Units | (8) | — | — | — | — | — | — | — | |||||||||||||||||
| | | | | | | | | | | | | | | | | | | | | | | | | | | |
Digital Products Holdings LLC |
LIBOR Plus 10.00% (Floor 1.00%) | (5) | — | — | 2,713 | — | 26,171 | 660 | 25,511 | |||||||||||||||||
|
Preferred Member Units | (5) | — | — | 150 | — | 8,800 | 334 | 8,466 | |||||||||||||||||
| | | | | | | | | | | | | | | | | | | | | | | | | | | |
Garreco, LLC |
LIBOR Plus 8.00% (Floor 1.00%, Ceiling 1.50%) | (8) | — | — | 642 | 5,443 | 18 | 362 | 5,099 | |||||||||||||||||
|
Member Units | (8) | — | 650 | — | 1,940 | 650 | — | 2,590 | |||||||||||||||||
| | | | | | | | | | | | | | | | | | | | | | | | | | | |
Guerdon Modular Holdings, Inc. |
13% Secured Debt | (9) | — | (570 | ) | 1,312 | 10,632 | 2,340 | 970 | 12,002 | ||||||||||||||||
|
Preferred Stock | (9) | — | — | — | — | — | — | — | |||||||||||||||||
|
Common Stock | (9) | — | — | — | — | — | — | — | |||||||||||||||||
|
Warrants | (9) | — | — | — | — | — | — | — | |||||||||||||||||
| | | | | | | | | | | | | | | | | | | | | | | | | | | |
Gulf Manufacturing, LLC |
Member Units | (8) | — | 1,630 | 1,227 | 10,060 | 1,630 | — | 11,690 | |||||||||||||||||
| | | | | | | | | | | | | | | | | | | | | | | | | | | |
Gulf Publishing Holdings, LLC |
LIBOR Plus 9.50% (Floor 1.00%) | (8) | — | — | 11 | 80 | 160 | 240 | — | |||||||||||||||||
|
12.5% Secured Debt | (8) | — | — | 1,634 | 12,703 | 25 | 134 | 12,594 | |||||||||||||||||
|
Member Units | (8) | — | (720 | ) | — | 4,840 | — | 720 | 4,120 | ||||||||||||||||
| | | | | | | | | | | | | | | | | | | | | | | | | | | |
Harrison Hydra-Gen, Ltd. |
Common Stock | (8) | — | 4,490 | 180 | 3,580 | 4,490 | — | 8,070 | |||||||||||||||||
| | | | | | | | | | | | | | | | | | | | | | | | | | | |
HW Temps LLC |
LIBOR Plus 13.00% (Floor 1.00%) | (6) | — | — | 1,431 | 9,918 | 20 | — | 9,938 | |||||||||||||||||
|
Preferred Member Units | (6) | — | 2 | 170 | 3,940 | 2 | — | 3,942 | |||||||||||||||||
| | | | | | | | | | | | | | | | | | | | | | | | | | | |
KBK Industries, LLC |
10% Secured Debt | (5) | — | (3 | ) | 9 | 375 | 3 | 378 | — | ||||||||||||||||
|
12.5% Secured Debt | (5) | — | (33 | ) | 546 | 5,900 | 33 | 5,933 | — | ||||||||||||||||
|
Member Units | (5) | — | 4,190 | 842 | 4,420 | 4,190 | — | 8,610 | |||||||||||||||||
| | | | | | | | | | | | | | | | | | | | | | | | | | | |
Kickhaefer Manufacturing Company, LLC |
11.5% Secured Debt | (5) | — | — | 33 | — | 1,045 | — | 1,045 | |||||||||||||||||
|
11.5% Secured Debt | (5) | — | — | 1,125 | — | 27,730 | — | 27,730 | |||||||||||||||||
|
Member Units | (5) | — | — | — | — | 12,240 | — | 12,240 | |||||||||||||||||
|
9.0% Secured Debt | (5) | — | — | 63 | — | 3,970 | — | 3,970 | |||||||||||||||||
|
Member Units | (5) | — | — | — | — | 992 | — | 992 | |||||||||||||||||
| | | | | | | | | | | | | | | | | | | | | | | | | | | |
Marine Shelters Holdings, LLC |
12% PIK Secured Debt | (8) | (3,361 | ) | 3,078 | — | — | 3,361 | 3,361 | — | ||||||||||||||||
|
Preferred Member Units | (8) | (5,352 | ) | 5,352 | — | — | 5,352 | 5,352 | — | ||||||||||||||||
| | | | | | | | | | | | | | | | | | | | | | | | | | | |
Market Force Information, LLC |
LIBOR Plus 7.00% (Floor 1.00%) | (9) | — | — | 26 | — | 680 | 480 | 200 | |||||||||||||||||
|
LIBOR Plus 11.00% (Floor 1.00%) | (9) | — | — | 3,121 | 23,143 | 41 | 560 | 22,624 | |||||||||||||||||
|
Member Units | (9) | — | (1,600 | ) | — | 14,700 | — | 1,600 | 13,100 | ||||||||||||||||
| | | | | | | | | | | | | | | | | | | | | | | | | | | |
MH Corbin Holding LLC |
10% Current/3% PIK Secured Debt | (5) | — | (387 | ) | 1,187 | 12,526 | 119 | 912 | 11,733 | ||||||||||||||||
|
Preferred Member Units | (5) | — | (5,000 | ) | 140 | 6,000 | — | 5,000 | 1,000 | ||||||||||||||||
| | | | | | | | | | | | | | | | | | | | | | | | | | | |
NAPCO Precast, LLC |
LIBOR Plus 8.50% | (8) | — | (25 | ) | 1,277 | 11,475 | 25 | 25 | 11,475 | ||||||||||||||||
|
Member Units | (8) | — | 2,320 | 1,862 | 11,670 | 2,320 | — | 13,990 | |||||||||||||||||
| | | | | | | | | | | | | | | | | | | | | | | | | | | |
NRI Clinical Research, LLC |
14% Secured Debt | (9) | — | 140 | 982 | 4,265 | 3,035 | 615 | 6,685 | |||||||||||||||||
|
Warrants | (9) | — | 160 | — | 500 | 160 | — | 660 | |||||||||||||||||
|
Member Units | (9) | — | (22 | ) | — | 2,500 | 152 | 174 | 2,478 | ||||||||||||||||
| | | | | | | | | | | | | | | | | | | | | | | | | | | |
NuStep, LLC |
12% Secured Debt | (5) | — | — | 2,550 | 20,420 | 38 | — | 20,458 | |||||||||||||||||
|
Preferred Member Units | (5) | — | — | — | 10,200 | — | — | 10,200 | |||||||||||||||||
| | | | | | | | | | | | | | | | | | | | | | | | | | | |
OMi Holdings, Inc. |
Common Stock | (8) | — | 1,910 | 1,608 | 14,110 | 1,910 | — | 16,020 | |||||||||||||||||
| | | | | | | | | | | | | | | | | | | | | | | | | | | |
Pegasus Research Group, LLC |
Member Units | (8) | — | (2,630 | ) | — | 10,310 | — | 2,630 | 7,680 | ||||||||||||||||
| | | | | | | | | | | | | | | | | | | | | | | | | | | |
River Aggregates, LLC |
Zero Coupon Secured Debt | (8) | — | (28 | ) | 43 | 707 | 43 | 28 | 722 | ||||||||||||||||
|
Member Units | (8) | — | — | — | 4,610 | — | — | 4,610 | |||||||||||||||||
|
Member Units | (8) | — | 370 | — | 2,559 | 371 | — | 2,930 | |||||||||||||||||
| | | | | | | | | | | | | | | | | | | | | | | | | | | |
SoftTouch Medical Holdings LLC |
LIBOR Plus 9.00% (Floor 1.00%) | (7) | — | (30 | ) | 119 | 7,140 | 30 | 7,170 | — | ||||||||||||||||
|
Member Units | (7) | 5,171 | (5,159 | ) | 865 | 10,089 | — | 10,089 | — | ||||||||||||||||
| | | | | | | | | | | | | | | | | | | | | | | | | | | |
Other |
||||||||||||||||||||||||||
Amounts related to investments transferred to or from other 1940 Act classification during the period |
— | — | 25 | (10,632 | ) | — | — | — | ||||||||||||||||||
| | | | | | | | | | | | | | | | | | | | | | | | | | | |
Total Control investments |
$ | 4,681 | $ | 37,826 | $ | 85,853 | $ | 750,706 | $ | 400,284 | $ | 156,629 | $ | 1,004,993 | ||||||||||||
| | | | | | | | | | | | | | | | | | | | | | | | | | | |
| | | | | | | | | | | | | | | | | | | | | | | | | | | |
| | | | | | | | | | | | | | | | | | | | | | | | | | | |
197
Company
|
Investment(1)(10)(11)
|
Geography | Amount of Realized Gain/(Loss) |
Amount of Unrealized Gain/(Loss) |
Amount of Interest, Fee or Dividends Credited to Income(2) |
December 31, 2017 Fair Value |
Gross Additions(3) |
Gross Reductions(4) |
December 31, 2018 Fair Value |
|||||||||||||||||
|---|---|---|---|---|---|---|---|---|---|---|---|---|---|---|---|---|---|---|---|---|---|---|---|---|---|---|
Affiliate Investments |
||||||||||||||||||||||||||
|
||||||||||||||||||||||||||
AFG Capital Group, LLC |
Warrants | (8) | $ | — | $ | 90 | $ | — | $ | 860 | $ | 90 | $ | — | $ | 950 | ||||||||||
|
Preferred Member Units | (8) | — | 390 | 40 | 3,590 | 390 | — | 3,980 | |||||||||||||||||
| | | | | | | | | | | | | | | | | | | | | | | | | | | |
Barfly Ventures, LLC |
12% Secured Debt | (5) | — | (164 | ) | 1,177 | 8,715 | 1,467 | 164 | 10,018 | ||||||||||||||||
|
Options | (5) | — | (190 | ) | 210 | 920 | 210 | 190 | 940 | ||||||||||||||||
|
Warrants | (5) | — | (110 | ) | — | 520 | — | 110 | 410 | ||||||||||||||||
| | | | | | | | | | | | | | | | | | | | | | | | | | | |
BBB Tank Services, LLC |
LIBOR Plus 10% (Floor 1.00%) | (8) | — | — | 83 | 778 | 434 | 1,212 | — | |||||||||||||||||
|
LIBOR Plus 11% (Floor 1.00%) | (8) | — | — | 693 | 3,876 | — | 43 | 3,833 | |||||||||||||||||
|
Preferred Member Units | (8) | — | — | — | — | 113 | — | 113 | |||||||||||||||||
|
Member Units | (8) | — | (270 | ) | — | 500 | — | 270 | 230 | ||||||||||||||||
| | | | | | | | | | | | | | | | | | | | | | | | | | | |
Boccella Precast Products LLC |
LIBOR Plus 10% (Floor 1.00%) | (6) | — | 43 | 1,964 | 16,400 | 2,164 | 2,840 | 15,724 | |||||||||||||||||
|
Member Units | (6) | — | 1,640 | 635 | 3,440 | 1,640 | — | 5,080 | |||||||||||||||||
| | | | | | | | | | | | | | | | | | | | | | | | | | | |
Boss Industries, LLC |
Preferred Member Units | (5) | — | 2,080 | 849 | 3,930 | 2,246 | — | 6,176 | |||||||||||||||||
| | | | | | | | | | | | | | | | | | | | | | | | | | | |
Bridge Capital Solutions Corporation |
13% Secured Debt | (6) | — | — | 1,351 | 5,884 | 337 | — | 6,221 | |||||||||||||||||
|
Warrants | (6) | — | 500 | — | 3,520 | 500 | — | 4,020 | |||||||||||||||||
|
13% Secured Debt | (6) | — | (2 | ) | 134 | 1,000 | 2 | 2 | 1,000 | ||||||||||||||||
|
Preferred Member Units | (6) | — | — | 108 | 1,000 | — | — | 1,000 | |||||||||||||||||
| | | | | | | | | | | | | | | | | | | | | | | | | | | |
Buca C, LLC |
LIBOR Plus 9.25% (Floor 1.00%) | (7) | — | — | 2,286 | 20,193 | 45 | 1,200 | 19,038 | |||||||||||||||||
|
Preferred Member Units | (7) | — | 5 | 254 | 4,172 | 259 | — | 4,431 | |||||||||||||||||
| | | | | | | | | | | | | | | | | | | | | | | | | | | |
CAI Software LLC |
12% Secured Debt | (6) | — | 94 | 726 | 4,083 | 7,797 | 1,000 | 10,880 | |||||||||||||||||
|
Member Units | (6) | — | (610 | ) | 20 | 3,230 | 97 | 610 | 2,717 | ||||||||||||||||
| | | | | | | | | | | | | | | | | | | | | | | | | | | |
Chandler Signs Holdings, LLC |
12% Secured Debt/1.00% PIK | (8) | — | (8 | ) | 604 | 4,500 | 54 | 8 | 4,546 | ||||||||||||||||
|
Class A Units | (8) | — | (530 | ) | 60 | 2,650 | — | 530 | 2,120 | ||||||||||||||||
| | | | | | | | | | | | | | | | | | | | | | | | | | | |
Charlotte Russe, Inc |
8.50% Secured Debt | (9) | — | 4,663 | 630 | 7,807 | 16,659 | 20,536 | 3,930 | |||||||||||||||||
|
Common Stock | (9) | — | (3,141 | ) | — | — | 3,141 | 3,141 | — | ||||||||||||||||
| | | | | | | | | | | | | | | | | | | | | | | | | | | |
Condit Exhibits, LLC |
Member Units | (9) | — | — | 123 | 1,950 | — | — | 1,950 | |||||||||||||||||
| | | | | | | | | | | | | | | | | | | | | | | | | | | |
Congruent Credit Opportunities Funds |
LP Interests (Fund II) | (8) | — | (140 | ) | — | 1,515 | — | 660 | 855 | ||||||||||||||||
|
LP Interests (Fund III) | (8) | — | (254 | ) | 2,017 | 18,632 | 4,014 | 5,178 | 17,468 | ||||||||||||||||
| | | | | | | | | | | | | | | | | | | | | | | | | | | |
Dos Rios Partners |
LP Interests (Dos Rios Partners, LP) | (8) | — | 138 | — | 7,165 | 138 | 150 | 7,153 | |||||||||||||||||
|
LP Interests (Dos Rios Partners — A, LP) | (8) | — | 430 | — | 1,889 | 430 | 48 | 2,271 | |||||||||||||||||
| | | | | | | | | | | | | | | | | | | | | | | | | | | |
East Teak Fine Hardwoods, Inc. |
Common Stock | (7) | — | (70 | ) | 35 | 630 | — | 70 | 560 | ||||||||||||||||
| | | | | | | | | | | | | | | | | | | | | | | | | | | |
EIG Fund Investments |
LP Interests (EIG Global Private Debt fund-A, L.P.) | (8) | — | — | 64 | 1,055 | 479 | 1,029 | 505 | |||||||||||||||||
| | | | | | | | | | | | | | | | | | | | | | | | | | | |
Freeport Financial Funds |
LP Interests (Freeport Financial SBIC Fund LP) | (5) | — | (215 | ) | 102 | 5,614 | — | 215 | 5,399 | ||||||||||||||||
|
LP Interests (Freeport First Lien Loan Fund III LP) | (5) | — | (123 | ) | 902 | 8,506 | 2,597 | 123 | 10,980 | ||||||||||||||||
| | | | | | | | | | | | | | | | | | | | | | | | | | | |
Gault Financial, LLC (RMB Capital, LLC) |
8% Secured Debt | (7) | (33 | ) | 950 | 815 | 11,532 | 950 | 12,482 | — | ||||||||||||||||
|
Warrants | (7) | (400 | ) | 400 | — | — | 400 | 400 | — | ||||||||||||||||
| | | | | | | | | | | | | | | | | | | | | | | | | | | |
Harris Preston Fund Investments |
LP Interests (HPEP 3, L.P.) | (8) | — | — | — | 943 | 790 | — | 1,733 | |||||||||||||||||
| | | | | | | | | | | | | | | | | | | | | | | | | | | |
Hawk Ridge Systems, LLC |
10.5% Secured Debt | (9) | — | (26 | ) | 1,561 | 14,300 | 26 | 26 | 14,300 | ||||||||||||||||
|
Preferred Member Units | (9) | — | 3,460 | 352 | 3,800 | 3,460 | — | 7,260 | |||||||||||||||||
|
Preferred Member Units | (9) | — | 180 | — | 200 | 180 | — | 380 | |||||||||||||||||
| | | | | | | | | | | | | | | | | | | | | | | | | | | |
Houston Plating and Coatings, LLC |
8% Unsecured Convertible Debt | (8) | — | 520 | 243 | 3,200 | 520 | — | 3,720 | |||||||||||||||||
|
Member Units | (8) | — | 2,133 | 289 | 6,140 | 2,190 | — | 8,330 | |||||||||||||||||
| | | | | | | | | | | | | | | | | | | | | | | | | | | |
I-45 SLF LLC |
Member Units | (8) | — | (1,214 | ) | 2,945 | 16,841 | — | 1,214 | 15,627 | ||||||||||||||||
| | | | | | | | | | | | | | | | | | | | | | | | | | | |
L.F. Manufacturing Holdings, LLC |
Member Units | (8) | — | 60 | — | 2,000 | 60 | — | 2,060 | |||||||||||||||||
| | | | | | | | | | | | | | | | | | | | | | | | | | | |
Meisler Operating LLC |
LIBOR Plus 8.50% (Floor 1.00%) | (5) | — | — | 2,228 | 16,633 | 3,999 | 320 | 20,312 | |||||||||||||||||
|
Member Units | (5) | — | 735 | — | 3,390 | 2,390 | — | 5,780 | |||||||||||||||||
| | | | | | | | | | | | | | | | | | | | | | | | | | | |
OnAsset Intelligence, Inc. |
12% PIK Secured Debt | (8) | — | — | 649 | 5,094 | 649 | — | 5,743 | |||||||||||||||||
|
10% PIK Secured Debt | (8) | — | — | 5 | 48 | 5 | — | 53 | |||||||||||||||||
|
Preferred Stock | (8) | — | — | — | — | — | — | — | |||||||||||||||||
|
Warrants | (8) | — | — | — | — | — | — | — | |||||||||||||||||
| | | | | | | | | | | | | | | | | | | | | | | | | | | |
OPI International Ltd. |
Common Stock | (8) | (1,371 | ) | 1,371 | — | — | 1,371 | 1,371 | — | ||||||||||||||||
| | | | | | | | | | | | | | | | | | | | | | | | | | | |
PCI Holding Company, Inc. |
12% Current/3% PIK Secured Debt | (9) | — | — | 2,105 | 12,593 | 615 | 1,300 | 11,908 | |||||||||||||||||
|
Preferred Stock | (9) | — | (550 | ) | — | 890 | — | 550 | 340 | ||||||||||||||||
|
Preferred Stock | (9) | — | 870 | — | 2,610 | 870 | — | 3,480 | |||||||||||||||||
| | | | | | | | | | | | | | | | | | | | | | | | | | | |
Rocaceia, LLC (Quality Lease and Rental Holdings, LLC) |
12% Secured Debt | (8) | — | — | — | 250 | — | — | 250 | |||||||||||||||||
|
Preferred Member Units | (8) | — | — | — | — | — | — | — | |||||||||||||||||
| | | | | | | | | | | | | | | | | | | | | | | | | | | |
Salado Stone Holdings, LLC |
Class A Preferred Units | (8) | — | (750 | ) | 23 | 1,790 | — | 750 | 1,040 | ||||||||||||||||
| | | | | | | | | | | | | | | | | | | | | | | | | | | |
SI East, LLC |
10.25% Current, Secured Debt | (7) | — | — | 1,471 | — | 36,501 | 1,616 | 34,885 | |||||||||||||||||
|
Preferred Member Units | (7) | — | — | — | — | 6,000 | — | 6,000 | |||||||||||||||||
| | | | | | | | | | | | | | | | | | | | | | | | | | | |
Slick Innovations, LLC |
14.00% Current, Secured Debt | (6) | — | — | 463 | — | 6,959 | — | 6,959 | |||||||||||||||||
|
Warrants | (6) | — | — | — | — | 181 | — | 181 | |||||||||||||||||
|
Member Units | (6) | — | — | — | — | 700 | — | 700 | |||||||||||||||||
| | | | | | | | | | | | | | | | | | | | | | | | | | | |
Tin Roof Acquisition Company |
12% Secured Debt | (7) | — | — | 841 | 12,722 | 561 | 13,283 | — | |||||||||||||||||
|
Class C Preferred Stock | (7) | — | — | 152 | 3,027 | 152 | 3,179 | — | |||||||||||||||||
| | | | | | | | | | | | | | | | | | | | | | | | | | | |
198
Company
|
Investment(1)(10)(11)
|
Geography | Amount of Realized Gain/(Loss) |
Amount of Unrealized Gain/(Loss) |
Amount of Interest, Fee or Dividends Credited to Income(2) |
December 31, 2017 Fair Value |
Gross Additions(3) |
Gross Reductions(4) |
December 31, 2018 Fair Value |
|||||||||||||||||
|---|---|---|---|---|---|---|---|---|---|---|---|---|---|---|---|---|---|---|---|---|---|---|---|---|---|---|
UniTek Global Services, Inc. |
LIBOR Plus 5.50% (Floor 1.00%) | (6) | — | (6 | ) | 127 | — | 2,975 | 6 | 2,969 | ||||||||||||||||
|
LIBOR Plus 8.50% (Floor 1.00%) | (6) | — | — | 819 | 8,535 | 6 | 8,541 | — | |||||||||||||||||
|
LIBOR Plus 7.50% (Floor 1.00%)/1.00% PIK | (6) | — | — | 7 | 137 | — | 137 | — | |||||||||||||||||
|
15% PIK Unsecured Debt | (6) | — | — | 122 | 865 | 87 | 952 | — | |||||||||||||||||
|
Preferred Stock | (6) | — | 41 | 1,038 | 7,320 | 1,080 | 987 | 7,413 | |||||||||||||||||
|
Preferred Stock | (6) | — | — | 121 | — | 1,852 | 215 | 1,637 | |||||||||||||||||
|
Preferred Stock | (6) | — | 8 | 580 | 2,850 | 587 | 399 | 3,038 | |||||||||||||||||
|
Common Stock | (6) | 399 | (1,069 | ) | — | 2,490 | — | 1,070 | 1,420 | ||||||||||||||||
| | | | | | | | | | | | | | | | | | | | | | | | | | | |
Universal Wellhead Services Holdings, LLC |
Preferred Member Units | (8) | — | — | 120 | 830 | 120 | — | 950 | |||||||||||||||||
|
Member Units | (8) | — | 420 | — | 1,910 | 420 | — | 2,330 | |||||||||||||||||
| | | | | | | | | | | | | | | | | | | | | | | | | | | |
Valley Healthcare Group, LLC |
LIBOR Plus 10.50% (Floor 0.50%) | (8) | — | — | 1,400 | 11,685 | 81 | 11,766 | — | |||||||||||||||||
|
Preferred Member Units | (8) | 1,898 | — | 58 | 1,600 | — | 1,600 | — | |||||||||||||||||
| | | | | | | | | | | | | | | | | | | | | | | | | | | |
Volusion, LLC |
11.5% Secured Debt | (8) | — | — | 2,818 | 15,200 | 3,207 | — | 18,407 | |||||||||||||||||
|
8% Unsecured Convertible Debt | (8) | — | — | 15 | — | 297 | — | 297 | |||||||||||||||||
|
Preferred Member Units | (8) | — | — | 1 | 14,000 | — | — | 14,000 | |||||||||||||||||
|
Warrants | (8) | — | (190 | ) | — | 2,080 | — | 190 | 1,890 | ||||||||||||||||
| | | | | | | | | | | | | | | | | | | | | | | | | | | |
Other |
||||||||||||||||||||||||||
Amounts related to investments transferred to or from other 1940 Act classification during the period |
(473 | ) | 473 | 365 | 2,825 | — | — | — | ||||||||||||||||||
| | | | | | | | | | | | | | | | | | | | | | | | | | | |
Total Affiliate investments |
$ | 20 | $ | 12,062 | $ | 36,800 | $ | 338,854 | $ | 125,544 | $ | 101,683 | $ | 359,890 | ||||||||||||
| | | | | | | | | | | | | | | | | | | | | | | | | | | |
| | | | | | | | | | | | | | | | | | | | | | | | | | | |
| | | | | | | | | | | | | | | | | | | | | | | | | | | |
199
Item 9. Changes in and Disagreements with Accountants on Accounting and Financial Disclosure
Not applicable.
Item 9A. Controls and Procedures
(a) Evaluation of Disclosure Controls and Procedures. As of the end of the period covered by this annual report on Form 10-K, we carried out an evaluation, under the supervision and with the participation of our management, including our Chief Executive Officer, President, Chief Financial Officer, Chief Compliance Officer and Chief Accounting Officer, of our disclosure controls and procedures (as defined in Rule 13a-15 of the Exchange Act). Based on that evaluation, our Chief Executive Officer, President, Chief Financial Officer, Chief Compliance Officer and Chief Accounting Officer have concluded that our current disclosure controls and procedures are effective in timely alerting them of material information relating to us that is required to be disclosed in the reports we file or submit under the Exchange Act.
(b) Management's Report on Internal Control Over Financial Reporting. The management of Main Street Capital Corporation and its subsidiaries (the Company) is responsible for establishing and maintaining adequate internal control over financial reporting, as such term is defined in Exchange Act Rule 13a-15(f). Under the supervision and with the participation of management, including the Chief Executive Officer and Chief Financial Officer, the Company conducted an evaluation of the effectiveness of the Company's internal control over financial reporting based on the criteria established in Internal Control — Integrated Framework issued by the Committee of Sponsoring Organizations of the Treadway Commission (COSO). Based on the Company's evaluation under the framework in Internal Control — Integrated Framework, management concluded that the Company's internal control over financial reporting was effective as of December 31, 2019. Grant Thornton LLP, the Company's independent registered public accounting firm, has issued an attestation report on the effectiveness of the Company's internal control over financial reporting as of December 31, 2019, as stated in its report which is included herein.
(c) Attestation Report of the Registered Public Accounting Firm. Our independent registered public accounting firm, Grant Thornton LLP, has issued an attestation report on the effectiveness of our internal control over financial reporting, which is set forth above under the heading "Reports of Independent Registered Public Accounting Firm" in Item 8.
(d) Changes in Internal Control over Financial Reporting. There have been no changes in our internal control over financial reporting that occurred during the fiscal quarter ended December 31, 2019 that have materially affected, or are reasonably likely to materially affect, our internal control over financial reporting.
Director Departures and Reduction in Size of Board
On February 24, 2020, each of Messrs. Michael Appling, Jr. and Joseph E. Canon informed our Board of Directors that he will be resigning from the Board at the end of his current term and, therefore, will not stand for re-election at our 2020 annual meeting of stockholders. Messrs. Appling and Canon have each provided over twelve years of exceptional service to the Board, dating back to the Company's initial public offering in 2007. Neither director's resignation was the result of any disagreement with management or the Board. The Board has accepted the resignations and passed a resolution reducing the number of directors that constitutes the full Board from eleven to nine directors, effective as of the date of our 2020 annual meeting of stockholders.
Officer Appointment
On February 25, 2020, our Board appointed Lance A. Parker to serve as our Vice President, Chief Accounting Officer and Assistant Treasurer effective as of March 1, 2020.
200
Mr. Parker, age 49, a certified public accountant, previously served as our Vice President and Corporate Controller since June 2019. Prior to joining us, Mr. Parker worked at Group 1 Automotive, Inc. (NYSE: GPI), an automotive retailer, as the Vice President and Corporate Controller from November 2006 to May 2019, and also held the position of Director of Corporate Compliance from August 2004 to November 2006. From 1993 to 2003, Mr. Parker served as an auditor, with increasing degrees of responsibility, for both Arthur Andersen LLP and KPMG LLP before leaving his career in public accounting to pursue a position as the Controller for a private advertising and printing company.
There is no arrangement or understanding between Mr. Parker and any other persons pursuant to which he is being appointed as our Vice President, Chief Accounting Officer and Assistant Treasurer. There are no current or proposed transactions between us and Mr. Parker or his immediate family members that would require disclosure under Item 404(a) of Regulation S-K promulgated by the SEC.
In connection with the promotion of Mr. Parker, our Board has reassigned Mr. Shannon D. Martin from his current role as our Vice President, Chief Accounting Officer and Assistant Treasurer to a position as our Vice President — Valuations, effective as of March 1, 2020.
Fees and Expenses
The following table is being provided to update, as of December 31, 2019, certain information in the Company's registration statement on Form N-2 (File No. 231146) filed with the SEC on April 30, 2019. The information is intended to assist you in understanding the costs and expenses that an investor in the Company will bear directly or indirectly. We caution you that some of the percentages indicated in the table below are estimates and may vary. Except where the context suggests otherwise, whenever this Annual Report on Form 10-K contains a reference to fees or expenses paid by "you," "us" or "Main Street," or that "we" will pay fees or expenses, stockholders will indirectly bear such fees or expenses as investors in us.
| |
|
|||
|---|---|---|---|---|
Stockholder Transaction Expenses: |
||||
Sales load (as a percentage of offering price) |
—% | (1) | ||
Offering expenses (as a percentage of offering price) |
—% | (2) | ||
Dividend reinvestment and direct stock purchase plan expenses |
—% | (3) | ||
| | | | | |
Total stockholder transaction expenses (as a percentage of offering price) |
—% | (4) | ||
Annual Expenses of the Company (as a percentage of net assets attributable to common stock): |
||||
Operating expenses |
2.76% | (5) | ||
Interest payments on borrowed funds |
3.40% | (6) | ||
Income tax expense |
0.08% | (7) | ||
Acquired fund fees and expenses |
0.45% | (8) | ||
| | | | | |
Total annual expenses |
6.69% | |||
201
Example
The following example demonstrates the projected dollar amount of total cumulative expenses that would be incurred over various periods with respect to a hypothetical investment in our common stock. In calculating the following expense amounts, we have assumed we would have no additional leverage and that our annual operating expenses would remain at the levels set forth in the table above.
| |
1 Year | 3 Years | 5 Years | 10 Years | |||||||||
|---|---|---|---|---|---|---|---|---|---|---|---|---|---|
You would pay the following expenses on a $1,000 investment, assuming a 5.0% annual return |
$ | 66 | $ | 196 | $ | 321 | $ | 615 | |||||
The example and the expenses in the table above should not be considered a representation of our future expenses, and actual expenses may be greater or less than those shown. While the example assumes, as required by the SEC, a 5.0% annual return, our performance will vary and may result in a return greater or less than 5.0%. In addition, while the example assumes reinvestment of all dividends at net asset value, participants in our dividend reinvestment plan will receive a number of shares of our common stock, determined by dividing the total dollar amount of the dividend payable to a participant by (i) the market price per share of our common stock at the close of trading on a valuation date determined by our Board of Directors for each dividend in the event that we use newly issued shares to satisfy the share requirements of the dividend reinvestment plan or (ii) the average purchase price of all shares of common stock purchased by the plan administrator in the event that shares are purchased in the open market to satisfy the share requirements of the dividend reinvestment plan, which may be at, above or below net asset value. See the description in "Item 5. Market for Registrant's Common Equity, Related Stockholder Matters and Issuer Purchases of Equity Securities — Common Stock, Holders and Distributions" for additional information regarding our dividend reinvestment plan.
202
Item 10. Directors, Executive Officers and Corporate Governance
The information required by this Item will be contained in the definitive proxy statement relating to our 2020 annual meeting of stockholders (the "Proxy Statement") under the headings "Election of Directors," "Corporate Governance" and "Executive Officers" to be filed with the Securities and Exchange Commission on or prior to April 30, 2020, and is incorporated herein by reference.
We have adopted a code of business conduct and ethics that applies to directors, officers and employees of Main Street. This code of ethics is published on our Web site at www.mainstcapital.com. We intend to disclose any substantive amendments to, or waivers from, this code of conduct within four business days of the waiver or amendment through a Web site posting.
Item 11. Executive Compensation
The information required by this Item will be contained in the Proxy Statement under the headings "Compensation of Executive Officers," "Compensation of Directors," "Compensation Discussion and Analysis," "Compensation Committee Interlocks and Insider Participation" and "Compensation Committee Report," to be filed with the Securities and Exchange Commission on or prior to April 30, 2020, and is incorporated herein by reference.
Item 12. Security Ownership of Certain Beneficial Owners and Management and Related Stockholder Matters
The following table provides information regarding our equity compensation plans as of December 31, 2019:
Plan Category
|
Number of Securities to be Issued Upon Exercise of Outstanding Options, Warrants and Rights |
Weighted-Average Exercise Price of Outstanding Options, Warrants and Rights |
Number of Securities Remaining Available for Future Issuance Under Equity Compensation Plans (Excluding Securities Reflected in Column) |
|||||||
|---|---|---|---|---|---|---|---|---|---|---|
Equity compensation plans approved by security holders(1) |
$ | — | $ | — | $ | 2,155,060 | ||||
Equity compensation plans not approved by security holders(2) |
150,955 | — | — | |||||||
| | | | | | | | | | | |
Total |
$ | 150,955 | $ | — | $ | 2,155,060 | ||||
| | | | | | | | | | | |
| | | | | | | | | | | |
| | | | | | | | | | | |
203
The other information required by this Item will be contained in the Proxy Statement under the heading "Security Ownership of Certain Beneficial Owners and Management," to be filed with the Securities and Exchange Commission on or prior to April 30, 2020, and is incorporated herein by reference.
Item 13. Certain Relationships and Related Transactions, and Director Independence
The information required by this Item will be contained in the Proxy Statement under the headings "Certain Relationships and Related Party Transactions" and "Corporate Governance," to be filed with the Securities and Exchange Commission on or prior to April 30, 2020, and is incorporated herein by reference.
Item 14. Principal Accountant Fees and Services
The information required by this Item will be contained in the Proxy Statement under the heading "Ratification of Appointment of Independent Registered Public Accounting Firm for Year Ending December 31, 2019," to be filed with the Securities and Exchange Commission on or prior to April 30, 2020, and is incorporated herein by reference.
204
Item 15. Exhibits and Consolidated Financial Statement Schedules
The following documents are filed or incorporated by reference as part of this Annual Report:
1. Consolidated Financial Statements
2. Consolidated Financial Statement Schedule
3. Exhibits
Listed below are the exhibits which are filed as part of this report (according to the number assigned to them in Item 601 of Regulation S-K):
205
206
207
Pursuant to the requirements of Section 13 or 15(d) of the Securities Exchange Act of 1934, the registrant has duly caused this report to be signed on its behalf by the undersigned, thereunto duly authorized.
| MAIN STREET CAPITAL CORPORATION | ||||
By: |
/s/ DWAYNE L. HYZAK Dwayne L. Hyzak Chief Executive Officer and Director |
|||
Date: February 28, 2020
Pursuant to the requirements of the Securities Exchange Act of 1934, this report has been signed below by the following persons on behalf of the registrant and in the capacities and on the dates indicated.
Signature
|
Title
|
Date
|
||
|---|---|---|---|---|
| /s/ DWAYNE L. HYZAK Dwayne L. Hyzak |
Chief Executive Officer and Director (principal executive officer) |
February 28, 2020 | ||
/s/ VINCENT D. FOSTER Vincent D. Foster |
Executive Chairman of the Board of Directors |
February 28, 2020 |
||
/s/ BRENT D. SMITH Brent D. Smith |
Chief Financial Officer and Treasurer (principal financial officer) |
February 28, 2020 |
||
/s/ SHANNON D. MARTIN Shannon D. Martin |
Vice President, Chief Accounting Officer (principal accounting officer) |
February 28, 2020 |
||
/s/ JOSEPH E. CANON Joseph E. Canon |
Director |
February 28, 2020 |
||
/s/ MICHAEL APPLING JR. Michael Appling Jr. |
Director |
February 28, 2020 |
||
/s/ ARTHUR L. FRENCH Arthur L. French |
Director |
February 28, 2020 |
||
/s/ J. KEVIN GRIFFIN J. Kevin Griffin |
Director |
February 28, 2020 |
||
/s/ JOHN E. JACKSON John E. Jackson |
Director |
February 28, 2020 |
||
/s/ BRIAN E. LANE Brian E. Lane |
Director |
February 28, 2020 |
||
/s/ STEVEN B. SOLCHER Steven B. Solcher |
Director |
February 28, 2020 |
208
Signature
|
Title
|
Date
|
||
|---|---|---|---|---|
| /s/ VALERIE L. BANNER Valerie L. Banner |
Director | February 28, 2020 | ||
/s/ KAY MATTHEWS Kay Matthews |
Director |
February 28, 2020 |
209