Exhibit 99.1

Graphic

NEWS RELEASE

Contacts:

Main Street Capital Corporation

Dwayne L. Hyzak, CEO, dhyzak@mainstcapital.com

Jesse E. Morris, CFO and COO, jmorris@mainstcapital.com

713-350-6000

Dennard Lascar Investor Relations

Ken Dennard / ken@dennardlascar.com

Zach Vaughan / zvaughan@dennardlascar.com

713-529-6600

MAIN STREET ANNOUNCES

SECOND QUARTER 2022 RESULTS

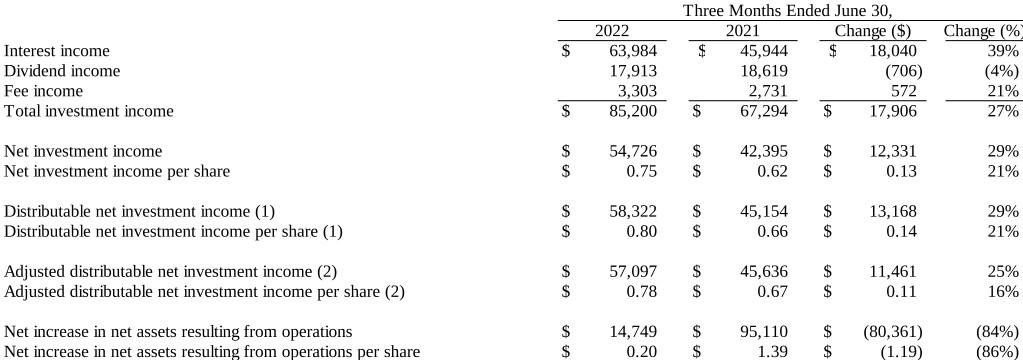
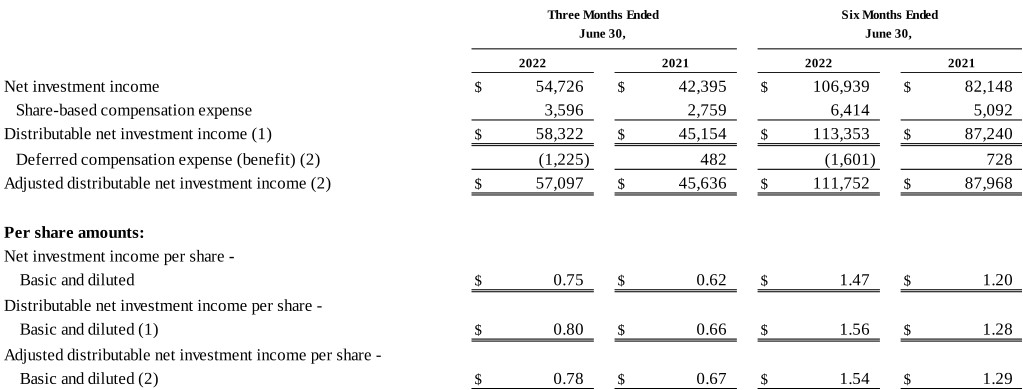
Second Quarter 2022 Net Investment Income of $0.75 Per Share

Second Quarter 2022 Distributable Net Investment Income(1) of $0.80 Per Share

Second Quarter 2022 Adjusted Distributable Net Investment Income(2) of $0.78 Per Share

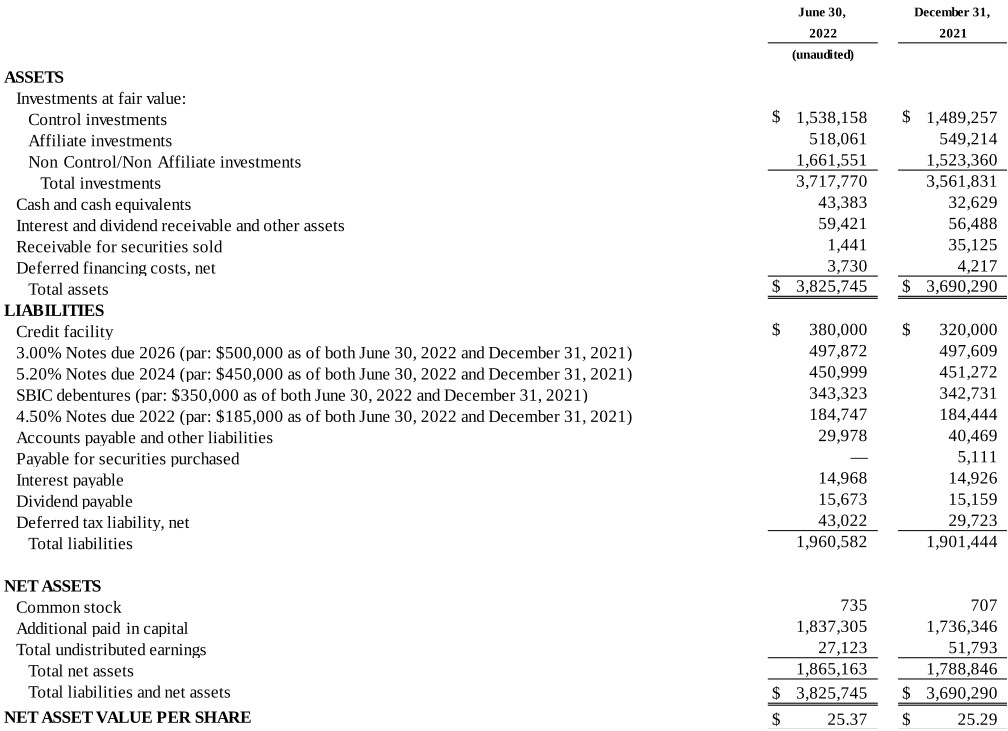
Net Asset Value of $25.37 Per Share

HOUSTON, August 4, 2022 – Main Street Capital Corporation (NYSE: MAIN) (“Main Street”) is pleased to announce its financial results for the second quarter of 2022.

Second Quarter 2022 Highlights
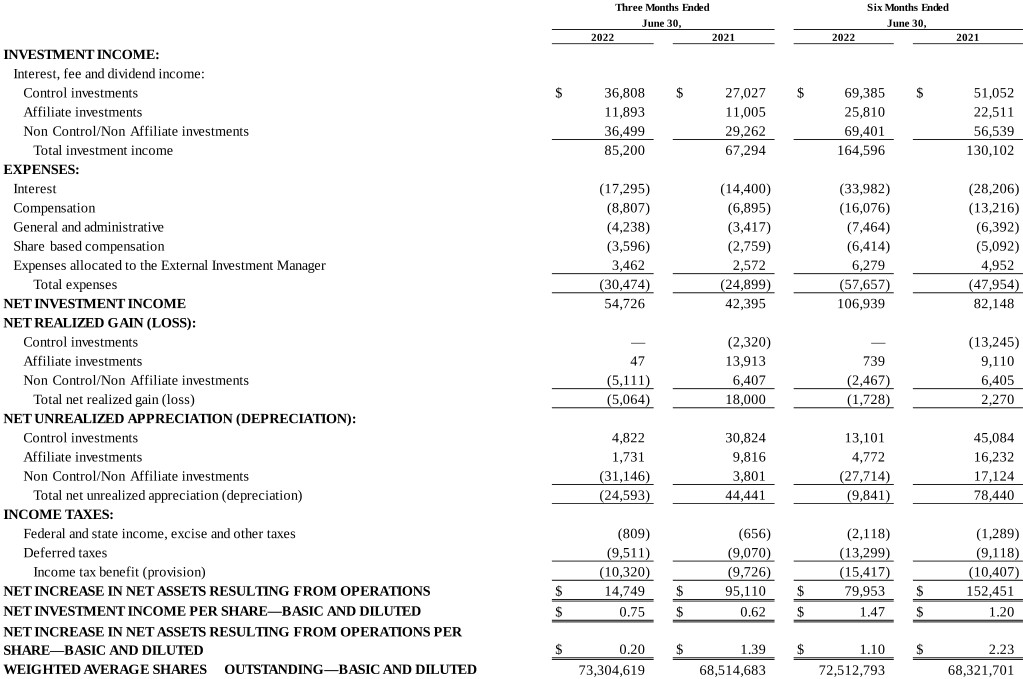
Net investment income of $54.7 million (or $0.75 per share)
Distributable net investment income(1) of $58.3 million (or $0.80 per share)
Adjusted distributable net investment income(2) of $57.1 million (or $0.78 per share)
Total investment income of $85.2 million
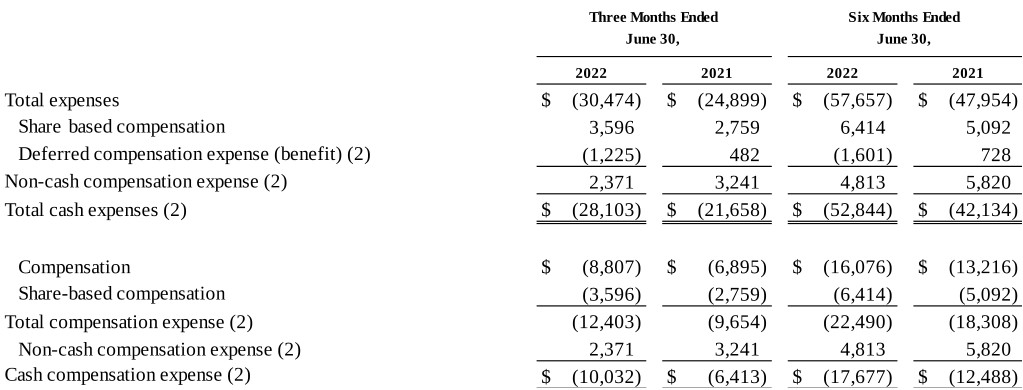
An industry leading position in cost efficiency, with a ratio of total non-interest operating expenses as a percentage of average total assets (“Operating Expenses to Assets Ratio”) of 1.4% on an annualized basis for the quarter and 1.5% for the trailing twelve month (“TTM”) period ended June 30, 2022
Net asset value of $25.37 per share at June 30, 2022
Declared regular monthly dividends totaling $0.645 per share for the third quarter of 2022, or $0.215 per share for each of July, August and September 2022, representing a 4.9% increase from the regular monthly dividends paid for the third quarter of 2021
Declared and paid a supplemental dividend of $0.075 per share, resulting in total dividends paid in the second quarter of 2022 of $0.72 per share
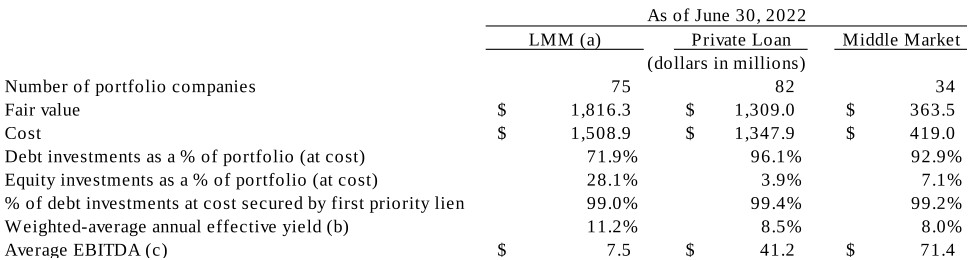
Completed $32.1 million in total lower middle market (“LMM”) portfolio investments, which after aggregate repayments of debt principal and return of invested equity capital from several LMM portfolio investments resulted in a net decrease of $4.9 million in total LMM portfolio investments
Completed $182.1 million in total private loan portfolio investments, which after aggregate repayments of debt principal and return of invested equity capital from several private loan portfolio investments resulted in a net increase of $72.3 million in total private loan portfolio investments


“We are pleased with Main Street’s strong second quarter results, which include a new quarterly record for net investment income per share and match our prior quarterly record for adjusted distributable net investment income per share,” stated Dwayne L. Hyzak, Main Street’s Chief Executive Officer. “These positive results included contributions from each of our core strategies, and as a result of our strong performance, adjusted distributable net investment income per share exceeded our regular monthly dividends by over 21%. This strong performance resulted in our recommendation that our board of directors approve both an increase to our regular monthly dividends to $0.22 per share, or $0.66 per share for the fourth quarter, representing our second such monthly dividend increase in 2022, and a supplemental dividend of $0.10 per share, representing our fourth consecutive quarterly supplemental dividend. While our net asset value per share declined in the quarter primarily as a result of the impact of increases in market interest rate spreads on our private loan and middle market debt investments, we are very pleased with the continued strong performance of our lower middle market portfolio companies which resulted in another quarter of significant fair value appreciation in this portfolio and partially offset the overall decline in valuations of our debt investments.”

“We are also very pleased with the recent investment grade rating assigned to us by Fitch and the support of our existing lender group that allowed us to complete the expansion and extension of our credit facility, two developments which we view as significant positives to our current and future capital structure. We remain very confident that our highly unique lower middle market strategy, combined with the strength of our private loan platform and our asset management business will allow us to continue to deliver superior results for our shareholders.”

Second Quarter 2022 Operating Results

The following table provides a summary of our operating results for the second quarter of 2022:

Graphic

The $17.9 million increase in total investment income in the second quarter of 2022 from the comparable period of the prior year was principally attributable to (i) an $18.0 million increase in interest income, primarily due to higher average levels of investment portfolio debt investments and (ii) a $0.6 million increase in fee income, primarily attributable to the increased investment activity. These increases were partially offset by a $0.7 million decrease in dividend income from investment portfolio equity investments. The $17.9 million increase in total investment income in the second quarter of 2022 includes the impact of a decrease in certain income considered less consistent or non-recurring of $1.5 million, resulting from a $3.7 million decrease from such dividend income, partially offset by a $2.3 million increase in income from accelerated prepayment, repricing and other activity related to certain investment portfolio debt investments, in both cases when compared to the same period in 2021.

Total cash expenses(2) increased to $28.1 million in the second quarter of 2022 from $21.7 million for the same period in 2021. This increase in total cash expenses was principally attributable to (i) a $3.6 million increase in cash compensation expense(2), (ii) a $2.9 million increase in interest expense and (iii) a $0.8 million increase in general and administrative expense, partially offset by a $0.9 million increase in expenses allocated to the External Investment Manager (as defined below). The increase in cash compensation expense(2) is primarily related to increased headcount, base compensation rates and incentive compensation accruals. The increase in interest expense is


primarily related to increased borrowings from our unsecured notes offering in October 2021 and under our Credit Facility (as defined below) to fund our investment activity.

Non-cash compensation expense(2) decreased $0.9 million in the second quarter of 2022 from the comparable period of the prior year, principally attributable to a $1.7 million decrease in deferred compensation expense, resulting from a comparable period decrease in the change in the fair value of deferred compensation plan assets and corresponding liabilities, partially offset by a $0.8 million increase in share-based compensation, resulting from an increase in incentive based grants.

Taking into consideration both total cash expenses(2) and non-cash compensation expense (2), our Operating Expenses to Assets Ratio was 1.4% for the second quarter of 2022, on an annualized basis, consistent with the ratio for the same period in 2021.

The $12.3 million increase in net investment income, the $13.2 million increase in distributable net investment income(1) and the $11.5 million increase in adjusted distributable net investment income(2) in the second quarter of 2022 from the comparable period of the prior year were principally attributable to the increase in total investment income, partially offset by higher expenses, each as discussed above.

Net investment income, distributable net investment income (1) and adjusted distributable net investment income(2) on a per share basis for the second quarter of 2022 increased by $0.13 per share, $0.14 per share and $0.11 per share, respectively, compared to the second quarter of 2021, to $0.75 per share, $0.80 per share and $0.78 per share, respectively. These increases include the impact of an increase in the average shares outstanding compared to the second quarter of 2021 primarily due to shares issued pursuant to (i) our at-the-market (“ATM”) program, (ii) our equity incentive plans and (iii) our dividend reinvestment plan. Net investment income and distributable net investment income on a per share basis(1) in the second quarter of 2022 each include a $0.02 per share decrease in investment income considered less consistent or non-recurring, offset by a $0.02 per share decrease in compensation expense resulting from reductions in deferred compensation expense(2), in each case compared to the second quarter of 2021 and as discussed above. Adjusted distributable net investment income(2) on a per share basis in the second quarter of 2022 includes a $0.02 per share decrease in investment income considered less consistent or non-recurring compared to the second quarter of 2021.

The $14.7 million net increase in net assets resulting from operations in the second quarter of 2022 represents a $80.4 million decrease from the second quarter of 2021. This decrease was primarily the result of (i) a $69.0 million decrease in net unrealized appreciation (depreciation) from portfolio investments (including the impact of accounting reversals relating to realized gains/income (losses)), (ii) a $23.1 million decrease in net realized gain (loss) from investments resulting from a net realized gain of $18.0 million in the second quarter of 2021 compared to a net realized loss of $5.1 million in the second quarter of 2022 and (iii) a $0.6 million increase in income tax provision, partially offset by a $12.3 million increase in net investment income as discussed above. The $5.1 million net realized loss from investments for the second quarter of 2022 was primarily the result of a $6.1 million realized loss from the full exit of a middle market investment, partially offset by $1.0 million of realized gain distributions from an other portfolio investment.


The following table provides a summary of the total net unrealized depreciation of $24.6 million for the second quarter of 2022:

Graphic

(a)LMM includes unrealized appreciation on 25 LMM portfolio investments and unrealized depreciation on 25 LMM portfolio investments.
(b)Other includes (i) $14.6 million of unrealized depreciation relating to the External Investment Manager (as defined below) and (ii) $1.3 million of unrealized depreciation relating to Main Street’s deferred compensation plan assets, partially offset by $1.4 million of net unrealized appreciation relating to the other portfolio.

Liquidity and Capital Resources

As of June 30, 2022, we had aggregate liquidity of $518.4 million, including (i) $43.4 million in cash and cash equivalents and (ii) $475.0 million of unused capacity under our revolving credit facility (“Credit Facility”), which we maintain to support our investment and operating activities.

Subsequent to June 30, 2022, we achieved several improvements to our liquidity position and capital structure. These improvements include the receipt in July 2022 of an investment grade credit and corporate rating of BBB- with a stable outlook from Fitch Ratings, which is in addition to the rating of BBB- with a stable outlook that we maintain from S&P Global Ratings. We also completed the amendment of our Credit Facility in August 2022 to expand the total commitments to $920.0 million, with the accordion feature expanded to $1.4 billion and extend the maturity date to August 2027.

Several details regarding our capital structure as of June 30, 2022 are as follows:

Our Credit Facility included $855.0 million in total commitments from a diversified group of 18 participating lenders, plus an accordion feature that allows us to increase the total commitments under the facility to up to $1.2 billion.
$380.0 million in outstanding borrowings under our Credit Facility, with an interest rate of 3.6% based on LIBOR effective for the contractual reset date of July 1, 2022.
$350.0 million of outstanding Small Business Investment Company (“SBIC”) debentures through our wholly owned SBIC subsidiaries. These debentures, which are guaranteed by the U.S. Small Business Administration, had a weighted-average annual fixed interest rate of approximately 2.9% and mature ten years from original issuance. The first maturity related to our existing SBIC debentures occurs in the first quarter of 2023, and the weighted-average remaining duration was approximately 5.6 years.
$500.0 million of notes outstanding that bear interest at a rate of 3.00% per year (the “3.00% Notes”). The 3.00% Notes mature on July 14, 2026 and may be redeemed in whole or in part at any time at our option subject to certain make-whole provisions.
$450.0 million of notes outstanding that bear interest at a rate of 5.20% per year (the “5.20% Notes”). The 5.20% Notes mature on May 1, 2024 and may be redeemed in whole or in part at any time at our option subject to certain make-whole provisions.
$185.0 million of notes outstanding that bear interest at a rate of 4.50% per year (the “4.50% Notes”). The 4.50% Notes mature on December 1, 2022 and may be redeemed in whole or in part at any time at our option subject to certain make-whole provisions.
Our net asset value totaled $1.9 billion, or $25.37 per share.


Investment Portfolio Information as of June 30, 2022(3)

The following table provides a summary of the investments in our LMM portfolio, private loan portfolio and middle market portfolio as of June 30, 2022:

Graphic

(a)We had equity ownership in all of our LMM portfolio companies, and the average fully diluted equity ownership in those portfolio companies was approximately 41%.
(b)The weighted-average annual effective yields were computed using the effective interest rates for all debt investments at cost, including amortization of deferred debt origination fees and accretion of original issue discount but excluding fees payable upon repayment of the debt instruments and any debt investments on non-accrual status.
(c)The average EBITDA is calculated using a simple average for the LMM portfolio and a weighted-average for the private loan and middle market portfolios. These calculations exclude certain portfolio companies, including three LMM portfolio companies and three private loan portfolio companies, as EBITDA is not a meaningful valuation metric for our investments in these portfolio companies and those portfolio companies whose primary purpose is to own real estate.

The fair value of our LMM portfolio company equity investments was approximately 189% of the cost of such equity investments, and our LMM portfolio companies had a median net senior debt (senior interest-bearing debt through our debt position less cash and cash equivalents) to EBITDA (Earnings Before Interest, Taxes, Depreciation and Amortization) ratio of 2.6 to 1.0 and a median total EBITDA to senior interest expense ratio of 2.9 to 1.0. Including all debt that is junior in priority to our debt position, these median ratios were 2.6 to 1.0 and 3.4 to 1.0, respectively.(3) (4)

As of June 30, 2022, our investment portfolio also included:

Other portfolio investments in 14 companies, collectively totaling $108.8 million in fair value and $116.1 million in cost basis, which comprised 2.9% and 3.4% of our investment portfolio at fair value and cost, respectively; and
Our investment in the External Investment Manager (as defined below), with a fair value of $118.3 million and a cost basis of $29.5 million, which comprised 3.2% and 0.9% of our investment portfolio at fair value and cost, respectively.

As of June 30, 2022, we had nine investments on non-accrual status, which comprised 0.7% of the total investment portfolio at fair value and 3.2% at cost, and our total portfolio investments at fair value were 109% of the related cost basis.

External Investment Manager

MSC Adviser I, LLC is a wholly owned portfolio company and registered investment adviser that provides investment management services to external parties (the “External Investment Manager”). We share employees with the External Investment Manager and allocate costs related to such shared employees and other operating expenses to the External Investment Manager. The total contribution of the External Investment Manager to our net investment income consists of the combination of the expenses we allocate to the External Investment Manager and the dividend income we earn from the External Investment Manager. During the second quarter of 2022, the External Investment Manager earned $5.7 million of management fee income, an increase of $1.5 million from the second quarter of 2021, and we allocated $3.5 million of total expenses to the External Investment Manager. The increase in management fee income


and expenses allocated were primarily related to an increase in assets under management. The combination of the dividend income we earned from the External Investment Manager and expenses we allocated to it resulted in a total contribution to our net investment income of $5.2 million, representing an increase of $1.3 million from the second quarter of 2021. The External Investment Manager ended the second quarter of 2022 with total assets under management of approximately $1.4 billion.

Second Quarter 2022 Financial Results Conference Call / Webcast

Main Street has scheduled a conference call for Friday, August 5, 2022 at 10:00 a.m. Eastern Time to discuss the second quarter 2022 financial results.

You may access the conference call by dialing 412-902-0030 at least 10 minutes prior to the start time. The conference call can also be accessed via a simultaneous webcast by logging into the investor relations section of the Main Street web site at http://www.mainstcapital.com.

A telephonic replay of the conference call will be available through Friday, August 12, 2022 and may be accessed by dialing 201-612-7415 and using the passcode 13731056#. An audio archive of the conference call will also be available on the investor relations section of the company’s website at http://www.mainstcapital.com shortly after the call and will be accessible for approximately 90 days.

For a more detailed discussion of the financial and other information included in this press release, please refer to the Main Street Quarterly Report on Form 10-Q for the quarterly period ended June 30, 2022 to be filed with the Securities and Exchange Commission (www.sec.gov) and Main Street’s Second Quarter 2022 Investor Presentation to be posted on the investor relations section of the Main Street website at http://www.mainstcapital.com.

ABOUT MAIN STREET CAPITAL CORPORATION

Main Street (www.mainstcapital.com) is a principal investment firm that primarily provides long-term debt and equity capital to lower middle market companies and debt capital to middle market companies. Main Street’s portfolio investments are typically made to support management buyouts, recapitalizations, growth financings, refinancings and acquisitions of companies that operate in diverse industry sectors. Main Street seeks to partner with entrepreneurs, business owners and management teams and generally provides “one stop” financing alternatives within its lower middle market investment strategy. Main Street’s lower middle market companies generally have annual revenues between $10 million and $150 million. Main Street’s private loan and middle market debt investments are made in businesses that are generally larger in size than its lower middle market portfolio companies.

Main Street, through its wholly owned portfolio company MSC Adviser I, LLC (“MSC Adviser”), also maintains an asset management business through which it manages investments for external parties. MSC Adviser is registered as an investment adviser under the Investment Advisers Act of 1940.

FORWARD-LOOKING STATEMENTS

Main Street cautions that statements in this press release which are forward-looking and provide other than historical information, including but not limited to our ability to successfully source and execute on new portfolio investments and delivery of future financial performance and results, are based on current conditions and information available to Main Street as of the date hereof and include statements regarding Main Street’s goals, beliefs, strategies and future operating results and cash flows. Although its management believes that the expectations reflected in those forward-looking statements are reasonable, Main Street can give no assurance that those expectations will prove to be correct. Those forward-looking statements are made based on various underlying assumptions and are subject to numerous uncertainties and risks, including, without limitation: Main Street’s continued effectiveness in raising, investing and managing capital; adverse changes in the economy generally or in the industries in which Main Street’s portfolio companies operate; the impacts of macroeconomic factors on Main Street and its portfolio companies’


business and operations, liquidity and access to capital, and on the U.S. and global economies, including impacts related to the COVID-19 pandemic and other public health crises, risk of recession, inflation, supply chain constraints or disruptions and rising interest rates; changes in laws and regulations or business, political and/or regulatory conditions that may adversely impact Main Street’s operations or the operations of its portfolio companies; the operating and financial performance of Main Street’s portfolio companies and their access to capital; retention of key investment personnel; competitive factors; and such other factors described under the captions “Cautionary Statement Concerning Forward-Looking Statements” and “Risk Factors” included in Main Street’s filings with the Securities and Exchange Commission (www.sec.gov). Main Street undertakes no obligation to update the information contained herein to reflect subsequently occurring events or circumstances, except as required by applicable securities laws and regulations.


MAIN STREET CAPITAL CORPORATION

Consolidated Statements of Operations

(in thousands, except shares and per share amounts)

(Unaudited)

Graphic


MAIN STREET CAPITAL CORPORATION

Consolidated Balance Sheets

(in thousands, except per share amounts)

Graphic


MAIN STREET CAPITAL CORPORATION

Reconciliation of Distributable Net Investment Income,

Adjusted Distributable Net Investment Income,

Total Cash Expenses, Non-Cash Compensation Expense

and Cash Compensation Expense

(in thousands, except per share amounts)

(Unaudited)

Graphic

Graphic


MAIN STREET CAPITAL CORPORATION

Endnotes

(1)Distributable net investment income is net investment income as determined in accordance with U.S. Generally Accepted Accounting Principles, or U.S. GAAP, excluding the impact of share-based compensation expense which is non-cash in nature. Main Street believes presenting distributable net investment income and the related per share amount is useful and appropriate supplemental disclosure for analyzing its financial performance since share-based compensation does not require settlement in cash. However, distributable net investment income is a non-U.S. GAAP measure and should not be considered as a replacement for net investment income and other earnings measures presented in accordance with U.S. GAAP. Instead, distributable net investment income should be reviewed only in connection with such U.S. GAAP measures in analyzing Main Street’s financial performance. A reconciliation of net investment income in accordance with U.S. GAAP to distributable net investment income is detailed in the financial tables included with this press release.

(2) Beginning with the second quarter of 2022, Main Street is adjusting its definition of distributable net investment income (“adjusted distributable net investment income”) to also exclude the impact of deferred compensation expense or benefit (as defined below), which is non-cash in nature. The unrealized appreciation in the fair value of deferred compensation plan assets results in a corresponding increase in deferred compensation obligations and results in an increase in compensation expense (“deferred compensation expense”). The unrealized depreciation of such assets results in a corresponding decrease in deferred compensation obligations and results in a decrease in compensation expense (“deferred compensation benefit”). Total cash expenses are total expenses as determined in accordance with U.S. GAAP excluding non-cash, share-based compensation expense and deferred compensation expense or benefit (together “non-cash compensation expense”). Cash compensation expense is total compensation expense as determined in accordance with U.S. GAAP excluding non-cash compensation expense. Main Street believes presenting adjusted distributable net investment income and the related per share amount and total cash expenses is useful and appropriate supplemental disclosure for analyzing its financial performance since share-based compensation does not require settlement in cash and deferred compensation expense or benefit does not result in a net cash impact to Main Street upon settlement. However, adjusted distributable net investment income and total cash expenses are non-U.S. GAAP measures and should not be considered as replacements for net investment income or total expenses and other earnings measures presented in accordance with U.S. GAAP. Instead, adjusted distributable net investment income and total cash expense should be reviewed only in connection with such U.S. GAAP measures in analyzing Main Street’s financial performance. A reconciliation of net investment income in accordance with U.S. GAAP to adjusted distributable net investment income and total expenses in accordance with U.S. GAAP to total cash expenses are each detailed in the financial tables included with this press release. As it is the first period that Main Street is presenting adjusted distributable net investment income, the Company is presenting both distributable net investment income and adjusted distributable net investment income in order to clearly present the impact of this change. In future periods, Main Street intends to report distributable net investment income as net investment income, in accordance with U.S. GAAP, excluding the impact of share-based compensation expense and deferred compensation expense or benefit.

(3)Portfolio company financial information has not been independently verified by Main Street.

(4)These credit statistics exclude certain portfolio companies for which EBITDA is not a meaningful metric for the statistic.