| mainstcapital.com NYSE: MAIN Main Street Capital Corporation Page 1 Investor Presentation Second Quarter – 2022 Main Street Capital Corporation NYSE: MAIN mainstcapital.com Filed pursuant to Rule 433 Issuer Free Writing Prospectus dated August 5, 2022 Relating to Registration Statement No. 333 - 263258 |
| mainstcapital.com NYSE: MAIN Main Street Capital Corporation Page 2 Disclaimers Main Street Capital Corporation (MAIN) cautions that statements in this presentation that are forward - looking, and provide other than historical information, involve risks and uncertainties that may impact our future results of operations .. The forward - looking statements in this presentation are based on current conditions as of August 4 , 2022 , and include, but are not limited to, statements regarding our goals, beliefs, strategies, future operating results and cash flows, operating expenses, investment originations and performance, available capital, payment and the tax attributes of future dividends and shareholder returns .. Although our management believes that the expectations reflected in any forward - looking statements are reasonable, we can give no assurance that those expectations will prove to have been correct .. Those statements are made based on various underlying assumptions and are subject to numerous uncertainties and risks, including, without limitation : our continued effectiveness in raising, investing and managing capital ; adverse changes in the economy generally or in the industries in which our portfolio companies operate ; the impacts of macroeconomic factors on MAIN and its portfolio companies’ business and operations, liquidity and access to capital, and on the U .. S .. and global economies, including impacts related to the COVID - 19 pandemic and other public health crises, risk of recession, inflation, supply chain constraints or disruptions and rising interest rates ; changes in laws and regulations or business, political and/or regulatory conditions that may adversely impact our operations or the operations of our portfolio companies ; the operating and financial performance of our portfolio companies and their access to capital ; retention of key investment personnel ; competitive factors ; and such other factors described under the captions “Cautionary Statement Concerning Forward - Looking Statements,” “Management’s Discussion and Analysis of Financial Condition and Results of Operations” and “Risk Factors” included in our filings with the Securities and Exchange Commission (www .. sec .. gov), including our most recent annual report on Form 10 - K and subsequently filed quarterly reports on Form 10 - Q .. We undertake no obligation to update the information contained herein to reflect subsequently occurring events or circumstances, except as required by applicable securities laws and regulations .. MAIN has filed a registration statement (which includes a prospectus) with the SEC for any offering to which this communication may relate and may file one or more supplements to the prospectus in the future .. Before you invest in any of MAIN’s securities, you should read the registration statement, the prospectus and the applicable prospectus supplement(s) in order to fully understand all of the implications and risks of an offering of MAIN’s securities .. You should also read other documents MAIN has filed with the SEC for more complete information about MAIN and its securities offerings .. You may access these documents for free by visiting EDGAR on the SEC website at www .. sec .. gov .. Alternatively, MAIN will arrange to send you any applicable prospectus and prospectus supplement if you request such materials by calling us at ( 713 ) 350 - 6000 .. These materials are also made available, free of charge, on our website at www .. mainstcapital .. com .. Information contained on our website is not incorporated by reference into this communication .. The summary descriptions and other information included herein are intended only for informational purposes and convenient reference .. The information contained herein is not intended to provide, and should not be relied upon for, accounting, legal or tax advice or investment recommendations .. Before making an investment decision with respect to MAIN, investors are advised consult with their tax, financial, investment and legal advisors .. |
| mainstcapital.com NYSE: MAIN Main Street Capital Corporation Page 3 Main Street Capital Corporation Corporate Overview and Investment Strategy 2 nd Quarter – 2022 |
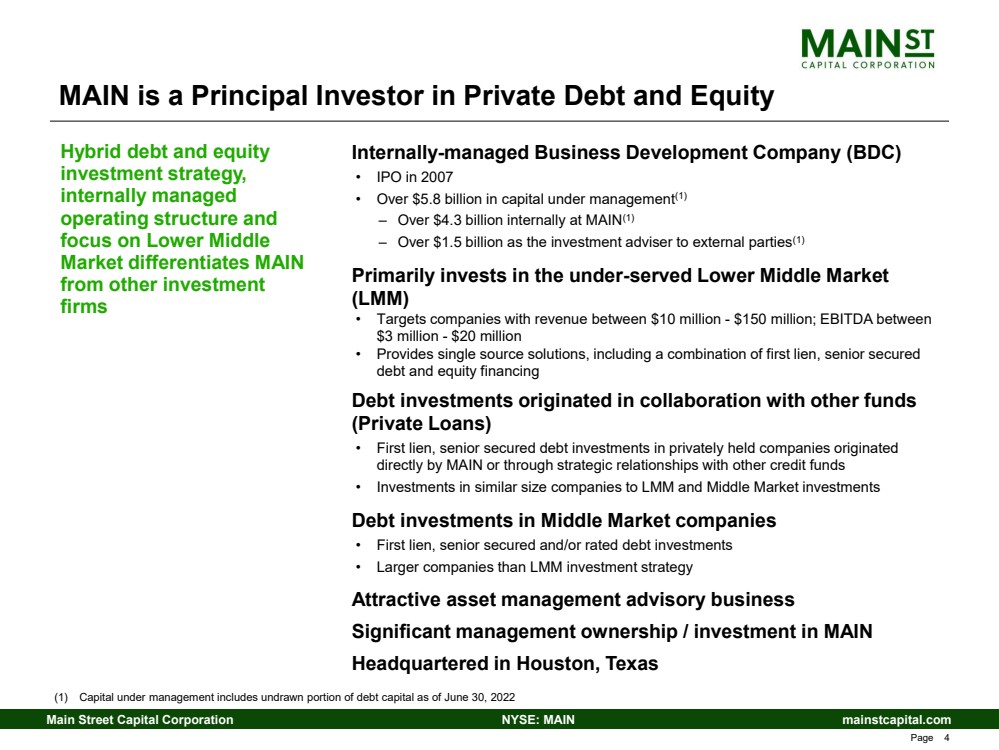
| mainstcapital.com NYSE: MAIN Main Street Capital Corporation Page 4 MAIN is a Principal Investor in Private Debt and Equity Hybrid debt and equity investment strategy, internally managed operating structure and focus on Lower Middle Market differentiates MAIN from other investment firms (1) Capital under management includes undrawn portion of debt capital as of June 30, 2022 Internally - managed Business Development Company (BDC) • IPO in 2007 • Over $5.8 billion in capital under management (1) – Over $4.3 billion internally at MAIN (1) – Over $1.5 billion as the investment adviser to external parties (1) Primarily invests in the under - served Lower Middle Market (LMM) • Targets companies with revenue between $10 million - $150 million; EBITDA between $3 million - $20 million • Provides single source solutions, including a combination of first lien, senior secured debt and equity financing Debt investments originated in collaboration with other funds (Private Loans) • First lien, senior secured debt investments in privately held companies originated directly by MAIN or through strategic relationships with other credit funds • Investments in similar size companies to LMM and Middle Market investments Debt investments in Middle Market companies • First lien, senior secured and/or rated debt investments • Larger companies than LMM investment strategy Attractive asset management advisory business Significant management ownership / investment in MAIN Headquartered in Houston, Texas |
| mainstcapital.com NYSE: MAIN Main Street Capital Corporation Page 5 MAIN is a Principal Investor in Private Debt and Equity Long - term focus on delivering our shareholders sustainable growth in net asset value and recurring dividends per share Consistent cash dividend yield – dividends paid monthly • MAIN has never decreased its monthly dividend rate • 100% increase in monthly dividends from $0.33 per share paid in Q4 2007 to declared dividends of $0.66 per share for Q4 2022 • Supplemental dividends from undistributed income Owns two Small Business Investment Company (SBIC) Funds • Main Street Mezzanine Fund (2002 vintage) and Main Street Capital III (2016 vintage) • Provides access to 10 - year, low cost, fixed rate U.S. government - backed leverage Strong capitalization and liquidity position – stable, long - term debt and significant available liquidity to take advantage of opportunities • Favorable opportunities in capital markets through investment grade rating of BBB - /Stable from Standard & Poor’s Global Ratings and BBB - /Stable from Fitch Ratings • Total SBIC debenture regulatory financing capacity of $350.0 million, the maximum amount permitted under current SBA regulations MAIN’s unique investment strategy, efficient operating structure and conservative capitalization are designed to provide sustainable, long - term growth in recurring monthly dividends and long - term capital appreciation to our shareholders |
| mainstcapital.com NYSE: MAIN Main Street Capital Corporation Page 6 MAIN is a Principal Investor in Private Debt and Equity Equity investments in LMM portfolio provide the opportunity to both grow net asset value (NAV) per share and generate recurring dividend income and periodic realized gains to support MAIN’s dividend growth • NAV growth of $12.52 per share (or 97%) since 2007 • Cumulative net realized gains from LMM portfolio investments of $157.7 million since MAIN’s initial public offering • Approximately $4.18 per share in cumulative, pre - tax net unrealized appreciation on LMM portfolio at June 30, 2022 • Realized gains provide unique returns in excess of net investment income Internally managed operating structure provides significant operating leverage • Favorable ratio of total expenses, excluding interest expense, to average total assets of approximately 1.5% (1) • Greater portion of gross portfolio returns are delivered to our shareholders • Attractive and growing Asset Management Business benefits MAIN’s shareholders • Significant positive impact to Net Investment Income • Alignment of interests between MAIN management and our shareholders Focus on LMM equity investments and efficient operating structure differentiates MAIN and provides opportunity for significant total returns for our shareholders (1) Based upon the trailing twelve months ended June 30, 2022 |
| mainstcapital.com NYSE: MAIN Main Street Capital Corporation Page 7 MAIN Strategy Produces Differentiated Returns Enhanced Value Proposition - Three Ways to Win are Better Than One 1. Sustain and Grow Dividends • Efficient operating structure provides operating leverage to grow Distributable Net Investment Income (DNII) (1) , and dividends paid, as investment portfolio and total investment income grow • 100% increase in monthly dividends from $0.33 per share paid in Q4 2007 to declared dividends of $0.66 per share for Q4 2022 • Never decreased regular monthly dividends (including through 2008/2009 recession and 2020/2021 COVID - 19 pandemic) • Paid or declared $35.02 per share in total dividends since October 2007 IPO at $15.00 per share ($30.63 per share in regular dividends and $4.39 per share in supplemental dividends) • Multi - faceted investment strategy supports growth of dividends over various cycles and markets 2. Meaningfully Grow Net Asset Value (NAV) Per Share • $12.85 at December 31, 2007 to $25.37 at June 30, 2022 – 97% growth; CAGR of 4.8% • Represents incremental economic return to investors beyond dividends • MAIN’s debt - focused peers (which comprises most BDCs) cannot generate NAV per share growth through the cycles • Unrealized appreciation is a good proxy for future dividend growth without the need for additional capital through growing portfolio dividend income and periodic harvested realized gains from equity investments • Ability to grow NAV per share provides opportunity for MAIN stock share price appreciation and additional shareholder returns 3. Supplement Growth in DNII (1) with Periodic Realized Gains • LMM equity component of investment strategy provides opportunity for meaningful realized gains (analogous to PIK income on debt investments from cash flow perspective, but more tax efficient and without cap on upside) • Realized gains validate the quality of MAIN’s unrealized appreciation • Realized gains can be paid to shareholders as dividends or retained for future reinvestment due to MAIN’s unique tax structure (1) See reconciliation of DNII per share to Net Investment Income per share on page 38 and Non - GAAP Information disclosures on page 48 of this presentation |
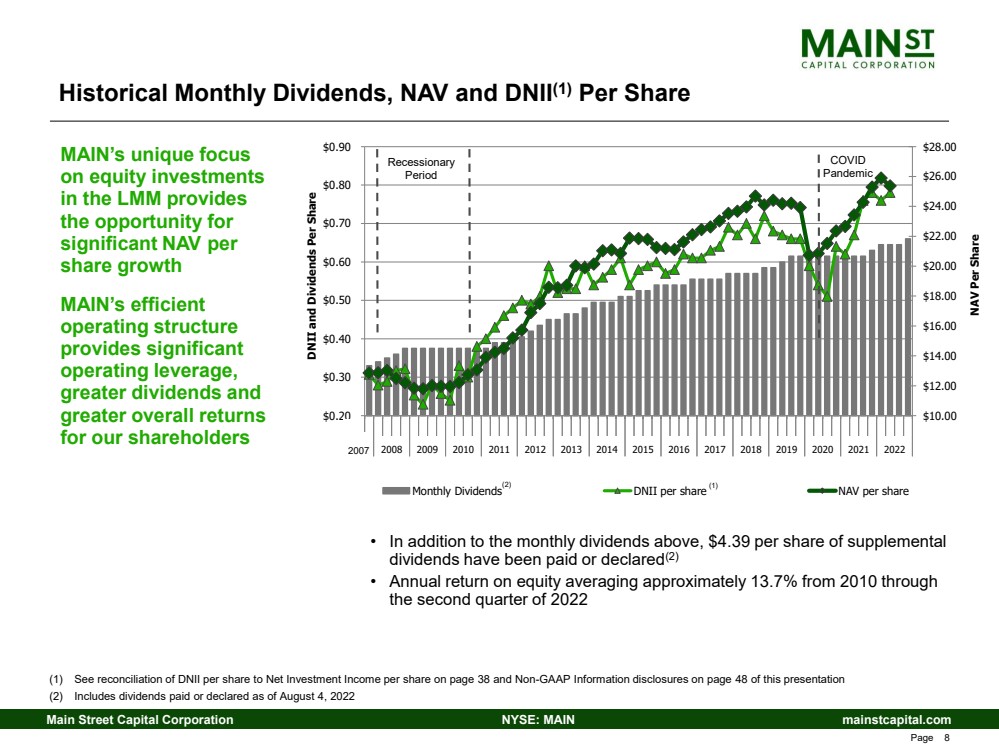
| mainstcapital.com NYSE: MAIN Main Street Capital Corporation Page 8 $10.00 $12.00 $14.00 $16.00 $18.00 $20.00 $22.00 $24.00 $26.00 $28.00 $0.20 $0.30 $0.40 $0.50 $0.60 $0.70 $0.80 $0.90 2008 2009 2010 2011 2012 2013 2014 2015 2016 2017 2018 2019 2020 2021 2022 NAV Per Share DNII and Dividends Per Share Monthly Dividends DNII per share NAV per share Recessionary Period (1) COVID Pandemic Historical Monthly Dividends, NAV and DNII (1) Per Share MAIN’s unique focus on equity investments in the LMM provides the opportunity for significant NAV per share growth MAIN’s efficient operating structure provides significant operating leverage, greater dividends and greater overall returns for our shareholders • In addition to the monthly dividends above, $4.39 per share of supplemental dividends have been paid or declared (2) • Annual return on equity averaging approximately 13.7% from 2010 through the second quarter of 2022 2007 207 (1) See reconciliation of DNII per share to Net Investment Income per share on page 38 and Non - GAAP Information disclosures on page 48 of this presentation (2) Includes dividends paid or declared as of August 4, 2022 (2) |
| mainstcapital.com NYSE: MAIN Main Street Capital Corporation Page 9 LMM Investment Strategy Investment Objectives • High cash yield from secured debt investments (10.9% weighted - average cash coupon as of June 30, 2022); plus • Dividend income and periodic capital gains from equity investments Investments are structured for ( i ) protection of capital, (ii) high recurring income and (iii) meaningful capital gain opportunity Focus on self - sponsored, “one stop” financing opportunities • Partner with business owners, management teams and entrepreneurs • Provide highly customized financing solutions • Recapitalization, buyout, growth and acquisition capital • Extensive network of grass roots referral sources • Strong and growing “Main Street” brand recognition / reputation Investments have low correlation to the broader debt and equity markets and attractive risk - adjusted returns LMM investment strategy differentiates MAIN from its competitors and provides attractive risk - adjusted returns |
| mainstcapital.com NYSE: MAIN Main Street Capital Corporation Page 10 LMM Investment Opportunity Large and critical portion of U.S. economy • 195,000+ domestic LMM businesses (1) LMM is under - served from a capital perspective and less competitive Inefficient asset class generates pricing inefficiencies • Typical entry enterprise values between 4.5X – 6.5X EBITDA • Typical entry leverage multiples between 2.0X – 4.0X EBITDA to MAIN debt investment Partner relationship with the management teams of our portfolio companies vs. a “commoditized vendor of capital” MAIN targets LMM investments in established, profitable companies Characteristics of LMM provide beneficial risk - reward investment opportunities (1) Source: U.S. Census 2017 – U.S. Data Table by Enterprise Receipt Size; 2017 County Business Patterns and 2017 Economic Census; i ncludes Number of Firms with Enterprise Receipt Size between $10,000,000 and $99,999,999 |
| mainstcapital.com NYSE: MAIN Main Street Capital Corporation Page 11 Private Loan Investment Strategy Investment Objectives • Access proprietary investments with attractive risk - adjusted return characteristics • Generate cash yield to support MAIN monthly dividend Investment Characteristics • Investments in companies that are consistent with the size of companies in our LMM and Middle Market portfolios • Proprietary investments originated directly by MAIN or through strategic relationships with other investment funds on a collaborative basis • Current Private Loan portfolio companies have weighted - average EBITDA of approximately $41.2 million (1) Investments in secured debt investments • First lien, senior secured debt investments • Floating rate debt investments 8% – 12% targeted gross yields • Weighted - average effective yield of 8.5% (2) • Net returns positively impacted by lower overhead requirements and modest use of leverage • Floating rate debt investments provide matching with MAIN’s floating rate Credit Facility Private Loan portfolio investments are primarily debt investments in privately held companies which have been originated directly by MAIN or through strategic relationships with other credit funds on a collaborative basis, and are often referred to in the debt markets as “club deals” (1) This calculation excludes three Private Loan portfolio companies as EBITDA is not a meaningful metric for these portfolio com pan ies (2) Weighted - average effective yield is calculated using the applicable interest rate as of June 30, 2022 and includes amortization of deferred debt origination fees and accretion of original issue discount, but excludes fees payable upon repayment of the debt instruments and any debt investments on non - accrua l status |
| mainstcapital.com NYSE: MAIN Main Street Capital Corporation Page 12 Middle Market Debt Investment Strategy Investment Objective • Generate cash yield to support MAIN monthly dividend Investments in secured and/or rated debt investments • First lien, senior secured debt investments • Floating rate debt investments Larger companies than the LMM investment strategy • Current Middle Market portfolio companies have weighted - average EBITDA of approximately $71.4 million Large and critical portion of U.S. economy • 220,000+ domestic Middle Market businesses (1) More relative liquidity than LMM and Private Loan investments 6% – 10% targeted gross yields • Weighted - average effective yield of 8 ..0% (2) • Net returns positively impacted by lower overhead requirements and modest use of leverage • Floating rate debt investments provide matching with MAIN’s floating rate Credit Facility MAIN maintains a portfolio of debt investments in Middle Market companies (1) Source: U.S. Census 2017 – U.S. Data Table by Enterprise Receipt Size; 2017 County Business Patterns and 2017 Economic Census; i ncludes Number of Firms with Enterprise Receipt Size between $10,000,000 and $99,999,999 (2) Weighted - average effective yield is calculated using the applicable interest rate as of June 30, 2022 and includes amortization of deferred debt origination fees and accretion of original issue discount, but excludes fees payable upon repayment of the debt instruments and any debt investments on non - accrua l status |
| mainstcapital.com NYSE: MAIN Main Street Capital Corporation Page 13 Asset Management Business MAIN (1) is the investment adviser to and administrator of MSC Income Fund, Inc. (MSIF), a non - listed BDC • MAIN (1) provides asset management services, including sourcing, diligence and post - investment monitoring • MAIN (1) receives management fees and incentive fees – Base management fee of 1.75% of total assets – Incentive fees – 20% of net investment income above a hurdle rate and 20% of net realized capital gains In December 2020, MAIN launched a private fund which is also managed by MAIN (1) with an investment strategy solely focused on MAIN’s Private Loan Investment strategy Benefits to MAIN • No significant increases to MAIN’s operating costs to provide services (utilize existing infrastructure and leverage fixed costs and existing investment capabilities) • Monetizing the value of MAIN franchise • Significant positive impact on MAIN’s financial results – $5.2 million contribution to net investment income in the second quarter of 2022 (2) – $10.2 million contribution to net investment income in the six months ended June 30, 2022 (2) – $16.5 million contribution to net investment income in the year ended December 31, 2021 (2) – $88.8 million of cumulative unrealized appreciation as of June 30, 2022 MAIN’s asset management business represents additional income diversification and the opportunity for greater shareholder returns MAIN’s internally managed operating structure provides MAIN’s shareholders the benefits of this asset management business Growth of asset management business is increasingly driven by MAIN’s Private Loan investment strategy (1) Through MSC Adviser I, LLC (the “External Investment Manager”), MAIN’s wholly owned unconsolidated subsidiary (2) Contribution to Net Investment Income includes (a) dividend income received by MAIN from the External Investment Manager and (b) operating expenses allocated from MAIN to the External Investment Manager |

| mainstcapital.com NYSE: MAIN Main Street Capital Corporation Page 14 MAIN Regulatory Framework Operates as a Business Development Company • Regulated by Securities and Exchange Commission - 1940 Act • Publicly - traded, private investment company Regulated Investment Company (RIC) tax structure • Eliminates corporate level income tax • Efficient tax structure providing high yield to investors • Passes through capital gains to investors Small Business Investment Company (SBIC) subsidiaries • Regulated by the U.S. Small Business Administration (SBA) • Access to low cost, fixed rate, long - term leverage guaranteed by the U.S. government • Total SBIC debenture regulatory financing capacity of $350.0 million • Total outstanding leverage of $350.0 million through two wholly owned SBIC Funds • MAIN is a previous SBIC of the Year Award recipient Highly regulated structure provides significant advantages and protections to our shareholders, including investment transparency, tax efficiency and beneficial leverage |
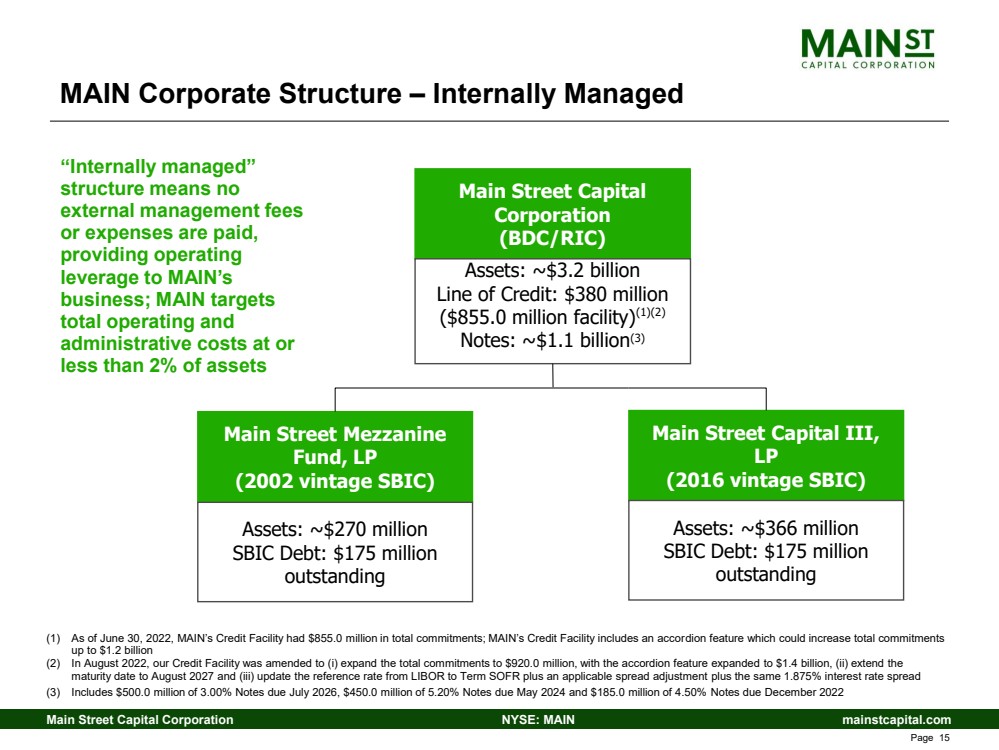
| mainstcapital.com NYSE: MAIN Main Street Capital Corporation Page 15 MAIN Corporate Structure – Internally Managed “Internally managed” structure means no external management fees or expenses are paid, providing operating leverage to MAIN’s business; MAIN targets total operating and administrative costs at or less than 2% of assets Main Street Capital Corporation (BDC/RIC) Assets: ~$3.2 billion Line of Credit: $380 million ($855.0 million facility) (1)(2) Notes: ~$1.1 billion (3) Main Street Mezzanine Fund, LP (2002 vintage SBIC) Assets: ~$270 million SBIC Debt: $175 million outstanding (1) As of June 30, 2022, MAIN’s Credit Facility had $855.0 million in total commitments; MAIN’s Credit Facility includes an accor dio n feature which could increase total commitments up to $1.2 billion (2) In August 2022, our Credit Facility was amended to ( i ) expand the total commitments to $920.0 million, with the accordion feature expanded to $1.4 billion, (ii) extend the maturity date to August 2027 and (iii) update the reference rate from LIBOR to Term SOFR plus an applicable spread adjustment pl us the same 1.875% interest rate spread (3) Includes $500.0 million of 3.00% Notes due July 2026, $450.0 million of 5.20% Notes due May 2024 and $185.0 million of 4.50% Not es due December 2022 Main Street Capital III, LP (2016 vintage SBIC) Assets: ~$366 million SBIC Debt: $175 million outstanding |
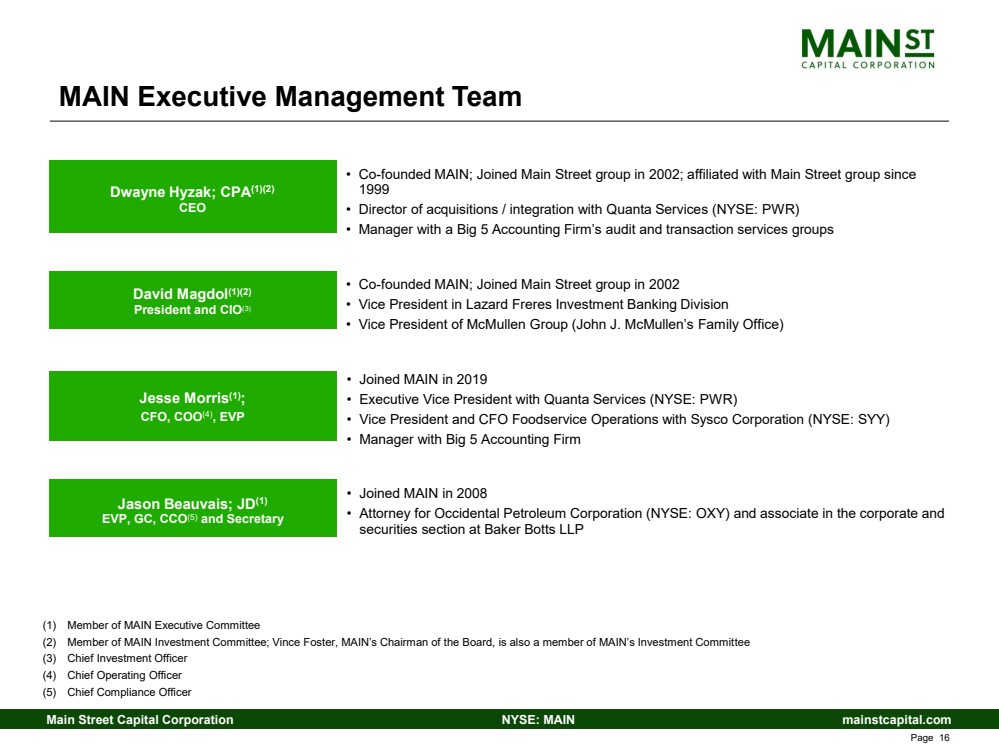
| mainstcapital.com NYSE: MAIN Main Street Capital Corporation Page 16 MAIN Executive Management Team (1) Member of MAIN Executive Committee (2) Member of MAIN Investment Committee; Vince Foster, MAIN’s Chairman of the Board, is also a member of MAIN’s Investment Commit tee (3) Chief Investment Officer (4) Chief Operating Officer (5) Chief Compliance Officer • Co - founded MAIN; Joined Main Street group in 2002; affiliated with Main Street group since 1999 • Director of acquisitions / integration with Quanta Services (NYSE: PWR) • Manager with a Big 5 Accounting Firm’s audit and transaction services groups Dwayne Hyzak; CPA (1)(2) CEO Jason Beauvais; JD (1) EVP, GC, CCO (5) and Secretary • Joined MAIN in 2008 • Attorney for Occidental Petroleum Corporation (NYSE: OXY) and associate in the corporate and securities section at Baker Botts LLP David Magdol (1)(2) President and CIO (3 ) • Co - founded MAIN; Joined Main Street group in 2002 • Vice President in Lazard Freres Investment Banking Division • Vice President of McMullen Group (John J. McMullen’s Family Office) Jesse Morris (1) ; CFO, COO (4) , EVP • Joined MAIN in 2019 • Executive Vice President with Quanta Services (NYSE: PWR) • Vice President and CFO Foodservice Operations with Sysco Corporation (NYSE: SYY) • Manager with Big 5 Accounting Firm |
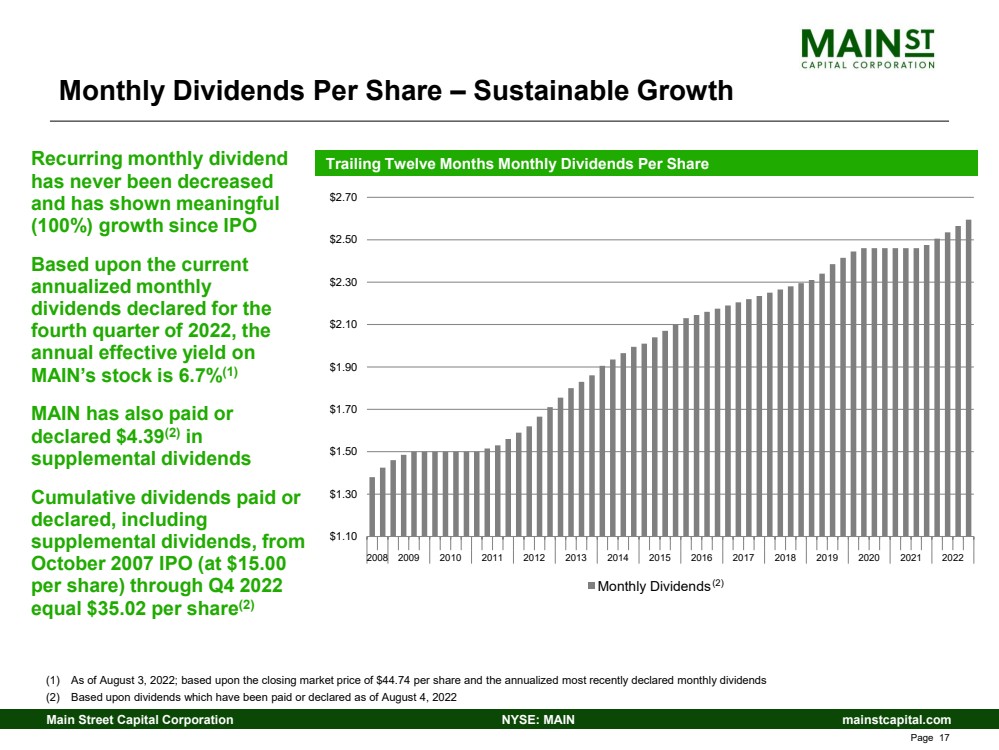
| mainstcapital.com NYSE: MAIN Main Street Capital Corporation Page 17 $1.10 $1.30 $1.50 $1.70 $1.90 $2.10 $2.30 $2.50 $2.70 2008 2009 2010 2011 2012 2013 2014 2015 2016 2017 2018 2019 2020 2021 2022 Monthly Dividends Monthly Dividends Per Share – Sustainable Growth Recurring monthly dividend has never been decreased and has shown meaningful (100%) growth since IPO Based upon the current annualized monthly dividends declared for the fourth quarter of 2022, the annual effective yield on MAIN’s stock is 6.7% (1) MAIN has also paid or declared $4.39 (2) in supplemental dividends Cumulative dividends paid or declared, including supplemental dividends, from October 2007 IPO (at $15.00 per share) through Q4 2022 equal $35.02 per share (2) (1) As of August 3, 2022; based upon the closing market price of $44.74 per share and the annualized most recently declared month ly dividends (2) Based upon dividends which have been paid or declared as of August 4, 2022 Trailing Twelve Months Monthly Dividends Per Share (2) |
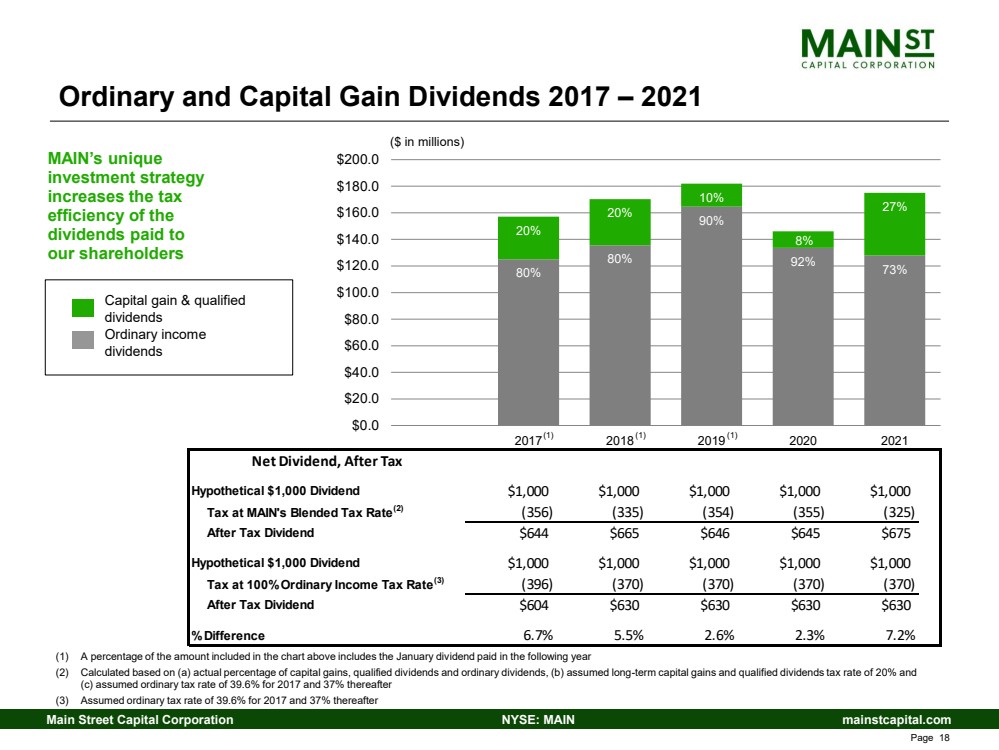
| mainstcapital.com NYSE: MAIN Main Street Capital Corporation Page 18 80% 80% 90% 92% 73% 20% 20% 10% 8% 27% $0.0 $20.0 $40.0 $60.0 $80.0 $100.0 $120.0 $140.0 $160.0 $180.0 $200.0 2017 2018 2019 2020 2021 Net Dividend, After Tax Hypothetical $1,000 Dividend $1,000 $1,000 $1,000 $1,000 $1,000 Tax at MAIN's Blended Tax Rate (2) (356) (335) (354) (355) (325) After Tax Dividend $644 $665 $646 $645 $675 Hypothetical $1,000 Dividend $1,000 $1,000 $1,000 $1,000 $1,000 Tax at 100% Ordinary Income Tax Rate (3) (396) (370) (370) (370) (370) After Tax Dividend $604 $630 $630 $630 $630 % Difference 6.7% 5.5% 2.6% 2.3% 7.2% Ordinary and Capital Gain Dividends 2017 – 2021 MAIN’s unique investment strategy increases the tax efficiency of the dividends paid to our shareholders (1) A percentage of the amount included in the chart above includes the January dividend paid in the following year (2) Calculated based on (a) actual percentage of capital gains, qualified dividends and ordinary dividends, (b) assumed long - term ca pital gains and qualified dividends tax rate of 20% and (c) assumed ordinary tax rate of 39.6% for 2017 and 37% thereafter (3) Assumed ordinary tax rate of 39.6% for 2017 and 37% thereafter Capital gain & qualified dividends Ordinary income dividends ($ in millions) (1) (1) (1) |
| mainstcapital.com NYSE: MAIN Main Street Capital Corporation Page 19 Main Street Capital Corporation Investment Portfolio 2 nd Quarter – 2022 |
| mainstcapital.com NYSE: MAIN Main Street Capital Corporation Page 20 Total Investment Portfolio Includes complementary LMM debt and equity investments, Private Loan debt investments and Middle Market debt investments Total investment portfolio at fair value consists of approximately 49% LMM / 35% Private Loan / 10% Middle Market / 6% Other Portfolio (1) investments 191 LMM, Private Loan and Middle Market portfolio companies • Average investment size of $ 17.2 million (2) • Largest individual portfolio company represents 2 ..8 % (3) of total investment income and 2.5% of total portfolio fair value (most investments are less than 1%) • Nine non - accrual investments, which represent 0.7% of the total investment portfolio at fair value and 3.2% at cost • Weighted - average effective yield of 9 ..4% (4) Significant diversification Diversity provides structural protection to investment portfolio, revenue sources, income, cash flows and shareholder dividends • Issuer • Industry • Transaction type (1) Other Portfolio also includes the External Investment Manager and short - term portfolio investments (2) As of June 30, 2022; based on cost (3) Based upon total investment income for the trailing twelve month period ended June 30, 2022 (4) Weighted - average effective yield is calculated using the applicable interest rate as of June 30, 2022 and includes amortization of deferred debt origination fees and accretion of original issue discount, but excludes fees payable upon repayment of the debt instruments and any debt investments on non - accrua l status • Geography • End markets • Vintage |
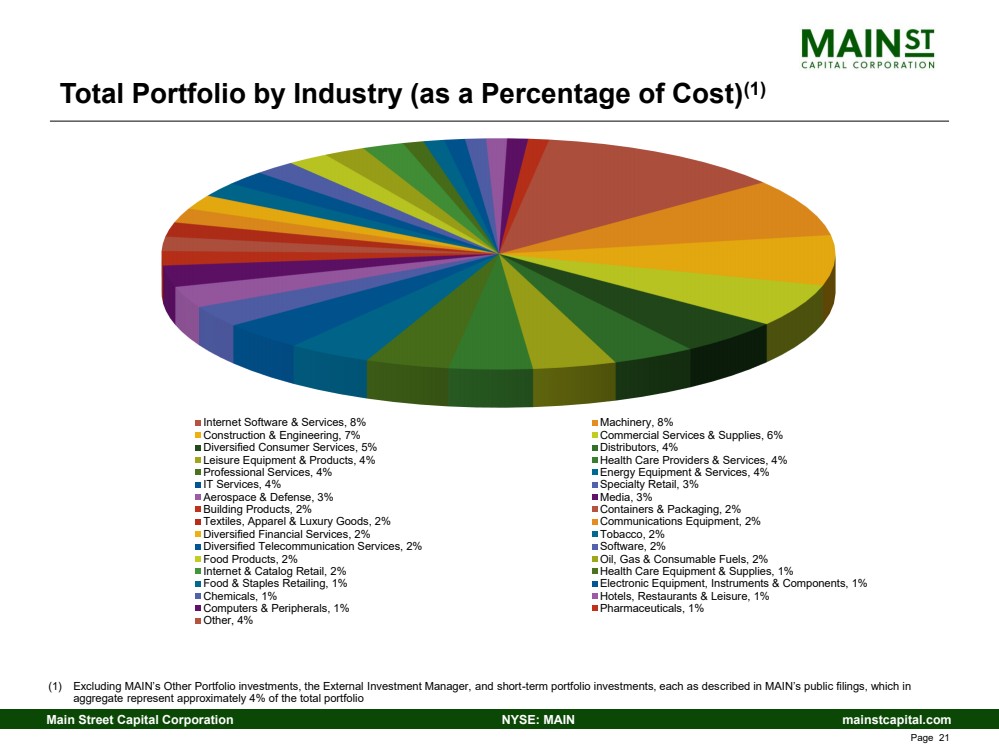
| mainstcapital.com NYSE: MAIN Main Street Capital Corporation Page 21 Total Portfolio by Industry (as a Percentage of Cost) (1) (1) Excluding MAIN’s Other Portfolio investments, the External Investment Manager, and short - term portfolio investments, each as des cribed in MAIN’s public filings, which in aggregate represent approximately 4% of the total portfolio Internet Software & Services, 8% Machinery, 8% Construction & Engineering, 7% Commercial Services & Supplies, 6% Diversified Consumer Services, 5% Distributors, 4% Leisure Equipment & Products, 4% Health Care Providers & Services, 4% Professional Services, 4% Energy Equipment & Services, 4% IT Services, 4% Specialty Retail, 3% Aerospace & Defense, 3% Media, 3% Building Products, 2% Containers & Packaging, 2% Textiles, Apparel & Luxury Goods, 2% Communications Equipment, 2% Diversified Financial Services, 2% Tobacco, 2% Diversified Telecommunication Services, 2% Software, 2% Food Products, 2% Oil, Gas & Consumable Fuels, 2% Internet & Catalog Retail, 2% Health Care Equipment & Supplies, 1% Food & Staples Retailing, 1% Electronic Equipment, Instruments & Components, 1% Chemicals, 1% Hotels, Restaurants & Leisure, 1% Computers & Peripherals, 1% Pharmaceuticals, 1% Other, 4% |
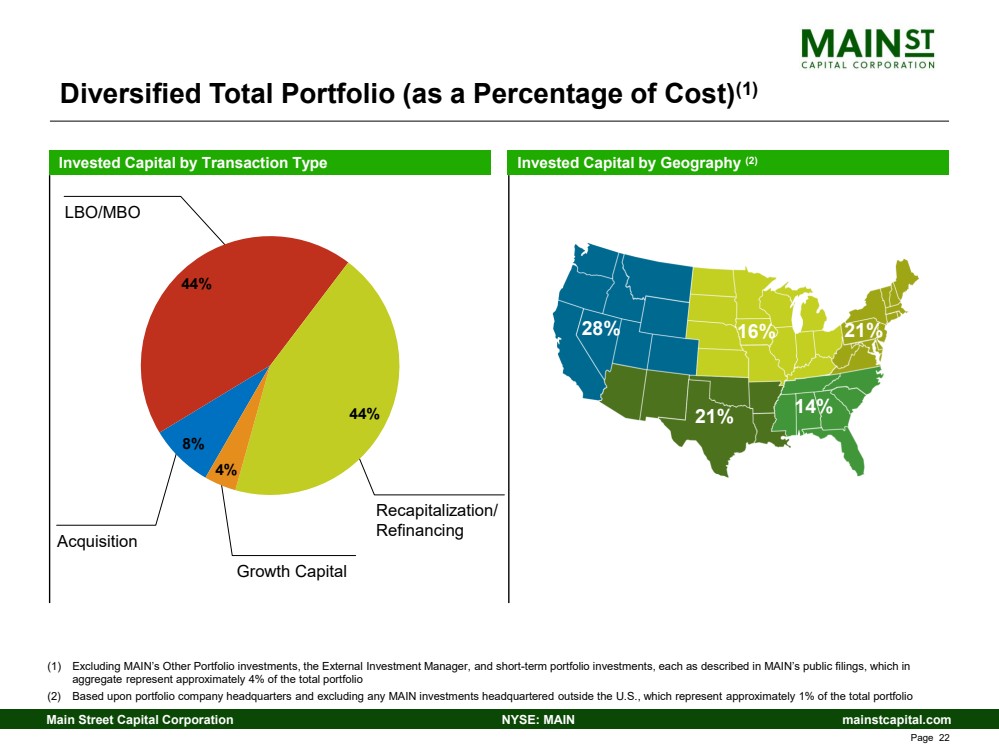
| mainstcapital.com NYSE: MAIN Main Street Capital Corporation Page 22 LBO/MBO Acquisition Recapitalization/ Refinancing Diversified Total Portfolio (as a Percentage of Cost) (1) Invested Capital by Transaction Type Invested Capital by Geography (2) 28% 16% 21% 14% 21% (1) Excluding MAIN’s Other Portfolio investments, the External Investment Manager, and short - term portfolio investments, each as des cribed in MAIN’s public filings, which in aggregate represent approximately 4% of the total portfolio (2) Based upon portfolio company headquarters and excluding any MAIN investments headquartered outside the U.S., which represent app roximately 1% of the total portfolio Growth Capital 8% 44% 44% 4% |
| mainstcapital.com NYSE: MAIN Main Street Capital Corporation Page 23 LMM Investment Portfolio 75 portfolio companies / $1.8 billion in fair value • 49% of total investment portfolio at fair value Debt yielding 11.2% (1) (72% of LMM portfolio at cost) • 99% of debt investments have first lien position • 59% of debt investments earn fixed - rate interest • Over 790 basis point net cash interest margin vs “matched” fixed interest rate on SBIC debentures Equity ownership in all LMM portfolio companies representing 41% average ownership position (28% of LMM portfolio at cost) • Opportunity for fair value appreciation, cash dividend income and capital gains • 68% of LMM companies (2) with direct equity investment are currently paying dividends • Fair value appreciation of equity investments supports Net Asset Value per share growth • Lower entry multiple valuations, lower cost basis • $307.3 million, or $4.18 per share, of cumulative pre - tax net unrealized appreciation at June 30, 2022 LMM Investment Portfolio consists of a diversified mix of secured debt and lower cost basis equity investments (1) Weighted - average effective yield is calculated using the applicable interest rate as of June 30, 2022 and includes amortization of deferred debt origination fees and accretion of original issue discount, but excludes fees payable upon repayment of the debt instruments and any debt investments on non - acc rual status (2) Includes the LMM companies that (a) MAIN has a direct equity investment and (b) are treated as flow - through entities for tax pur poses; based upon dividend income for the trailing twelve month period ended June 30, 2022 |
| mainstcapital.com NYSE: MAIN Main Street Capital Corporation Page 24 LMM Investment Portfolio Median LMM portfolio credit statistics: • Senior leverage of 2.6 x EBITDA through MAIN debt position • 2.9 x EBITDA to senior interest coverage • Total leverage of 2.6x EBITDA including debt junior in priority to MAIN • Free cash flow de - leveraging improves credit metrics and increases equity appreciation Average investment size of $24.2 million at fair value or $20.1 million on a cost basis (less than 1% of total investment portfolio) Opportunistic, selective posture toward new investment activity over the economic cycle High quality, seasoned LMM portfolio • Total LMM portfolio investments at fair value equals 120 % of cost • Equity component of LMM portfolio at fair value equals 189% of cost • Significant portion of LMM portfolio has de - leveraged and a majority of the LMM portfolio investments have experienced equity appreciation – 49 LMM portfolio companies with unrealized appreciation on equity investments – Net unrealized appreciation on LMM Equity investments of $375.4 million LMM Investment Portfolio is a pool of high quality, seasoned assets with attractive risk - adjusted return characteristics |
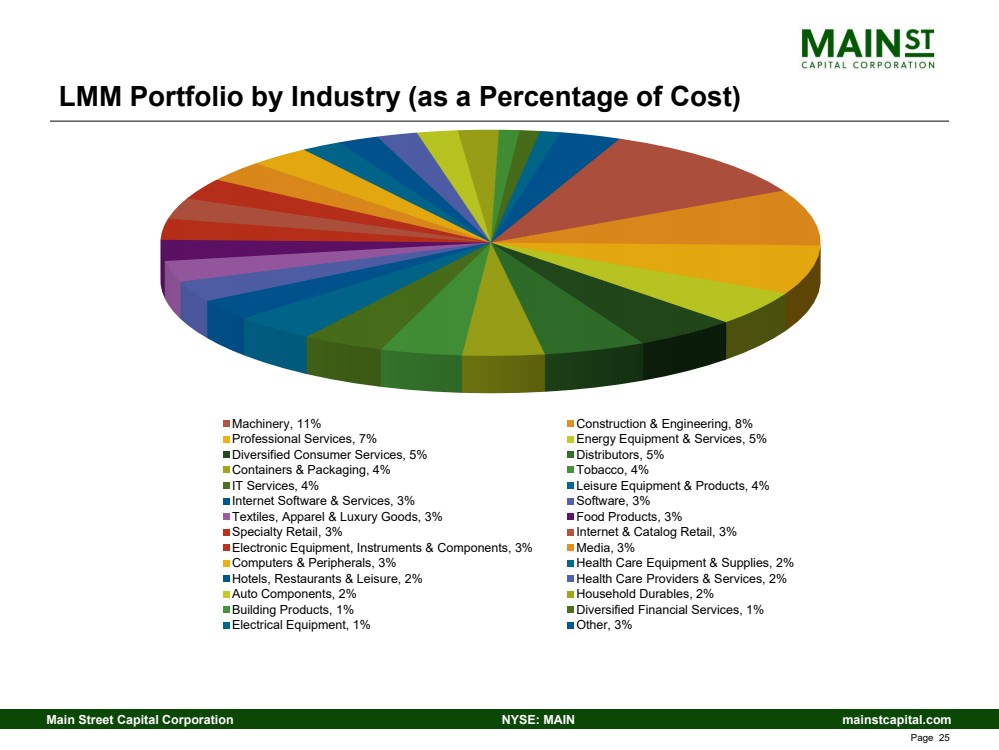
| mainstcapital.com NYSE: MAIN Main Street Capital Corporation Page 25 LMM Portfolio by Industry (as a Percentage of Cost) Machinery, 11% Construction & Engineering, 8% Professional Services, 7% Energy Equipment & Services, 5% Diversified Consumer Services, 5% Distributors, 5% Containers & Packaging, 4% Tobacco, 4% IT Services, 4% Leisure Equipment & Products, 4% Internet Software & Services, 3% Software, 3% Textiles, Apparel & Luxury Goods, 3% Food Products, 3% Specialty Retail, 3% Internet & Catalog Retail, 3% Electronic Equipment, Instruments & Components, 3% Media, 3% Computers & Peripherals, 3% Health Care Equipment & Supplies, 2% Hotels, Restaurants & Leisure, 2% Health Care Providers & Services, 2% Auto Components, 2% Household Durables, 2% Building Products, 1% Diversified Financial Services, 1% Electrical Equipment, 1% Other, 3% |
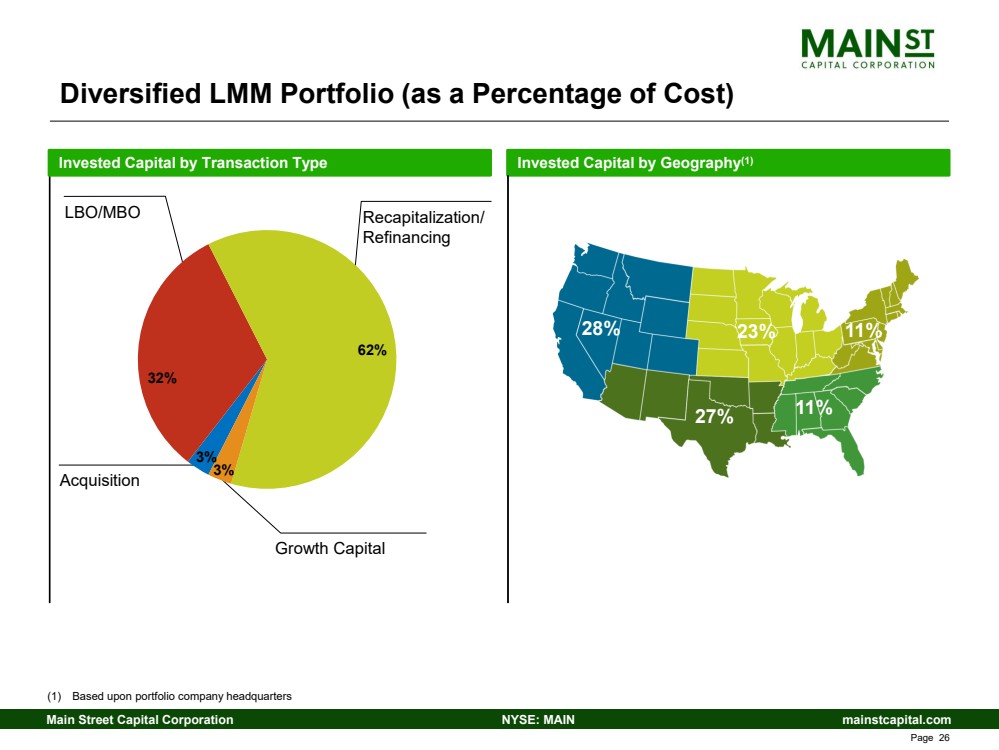
| mainstcapital.com NYSE: MAIN Main Street Capital Corporation Page 26 Acquisition LBO/MBO Growth Capital Recapitalization/ Refinancing Diversified LMM Portfolio (as a Percentage of Cost) Invested Capital by Geography (1) 28% 23% 27% 11% 11% Invested Capital by Transaction Type (1) Based upon portfolio company headquarters 3% 32% 62% 3% |
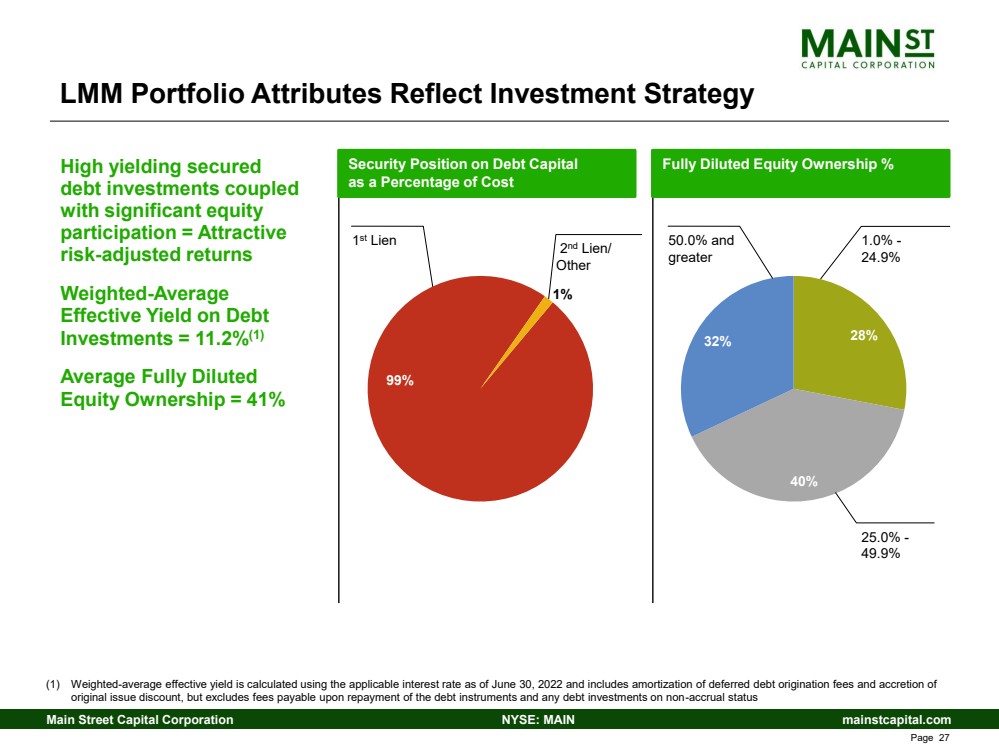
| mainstcapital.com NYSE: MAIN Main Street Capital Corporation Page 27 Security Position on Debt Capital as a Percentage of Cost LMM Portfolio Attributes Reflect Investment Strategy High yielding secured debt investments coupled with significant equity participation = Attractive risk - adjusted returns Weighted - Average Effective Yield on Debt Investments = 11.2% (1) Average Fully Diluted Equity Ownership = 41% Fully Diluted Equity Ownership % 28% 40% 32% 25.0% - 49.9% 1 st Lien 2 nd Lien/ Other 50.0% and greater 1.0% - 24.9% (1) Weighted - average effective yield is calculated using the applicable interest rate as of June 30, 2022 and includes amortization of deferred debt origination fees and accretion of original issue discount, but excludes fees payable upon repayment of the debt instruments and any debt investments on non - accrua l status 99% 1% |
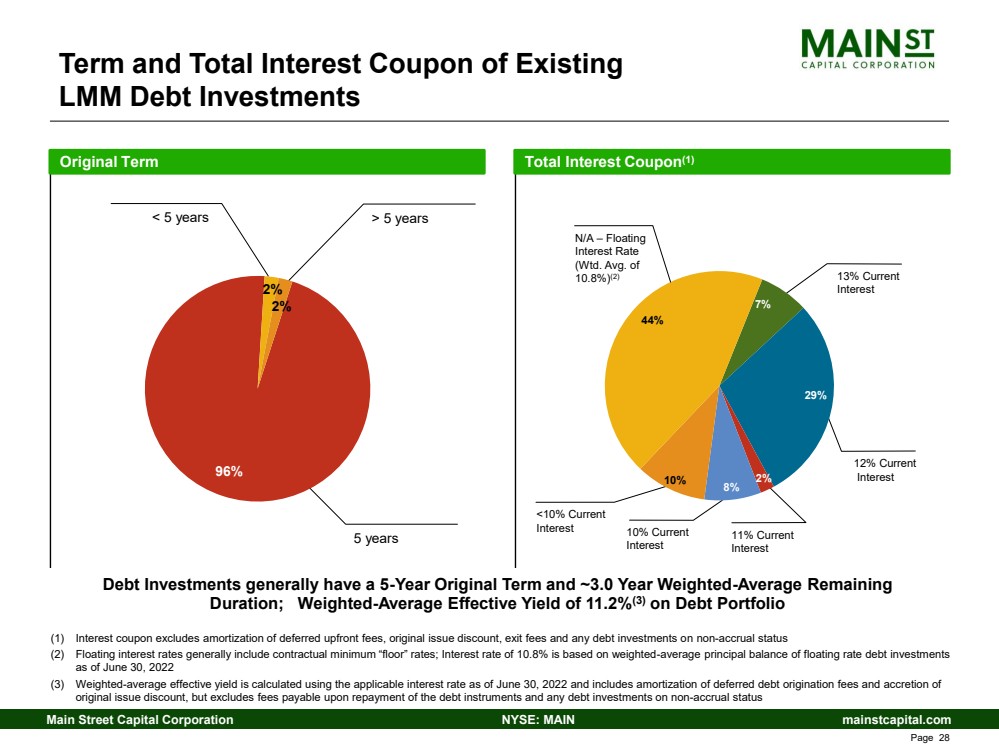
| mainstcapital.com NYSE: MAIN Main Street Capital Corporation Page 28 Total Interest Coupon (1) 10% Current Interest Term and Total Interest Coupon of Existing LMM Debt Investments Original Term 11% Current Interest 13% Current Interest <10% Current Interest 12% Current Interest (1) Interest coupon excludes amortization of deferred upfront fees, original issue discount, exit fees and any debt investments o n n on - accrual status (2) Floating interest rates generally include contractual minimum “floor” rates; Interest rate of 10.8% is based on weighted - average principal balance of floating rate debt investments as of June 30, 2022 (3) Weighted - average effective yield is calculated using the applicable interest rate as of June 30, 2022 and includes amortization of deferred debt origination fees and accretion of original issue discount, but excludes fees payable upon repayment of the debt instruments and any debt investments on non - accrua l status Debt Investments generally have a 5 - Year Original Term and ~3.0 Year Weighted - Average Remaining Duration; Weighted - Average Effective Yield of 11.2% (3) on Debt Portfolio 5 years 96% 2% 2% < 5 years > 5 years 7% 29% 2% 8% 10% 44% N/A – Floating Interest Rate (Wtd. Avg. of 10.8%) (2) |
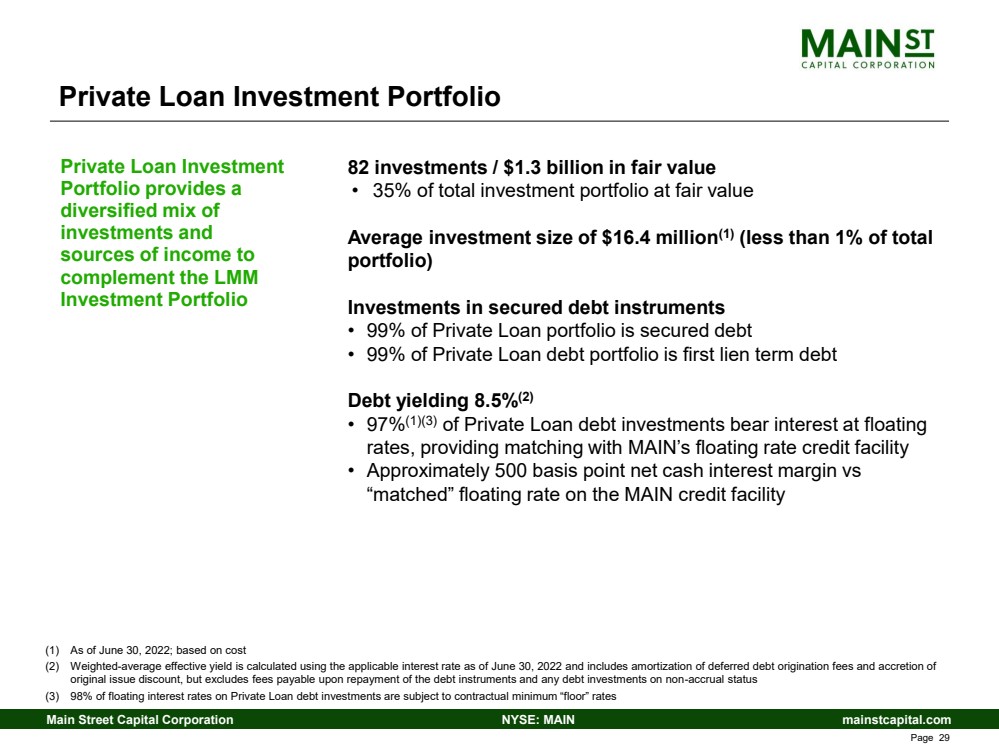
| mainstcapital.com NYSE: MAIN Main Street Capital Corporation Page 29 Private Loan Investment Portfolio 82 investments / $1.3 billion in fair value • 35% of total investment portfolio at fair value Average investment size of $16.4 million (1) (less than 1% of total portfolio) Investments in secured debt instruments • 99% of Private Loan portfolio is secured debt • 99% of Private Loan debt portfolio is first lien term debt Debt yielding 8.5% (2) • 97% (1)(3) of Private Loan debt investments bear interest at floating rates, providing matching with MAIN’s floating rate credit facility • Approximately 500 basis point net cash interest margin vs “matched” floating rate on the MAIN credit facility Private Loan Investment Portfolio provides a diversified mix of investments and sources of income to complement the LMM Investment Portfolio (1) As of June 30, 2022; based on cost (2) Weighted - average effective yield is calculated using the applicable interest rate as of June 30, 2022 and includes amortization of deferred debt origination fees and accretion of original issue discount, but excludes fees payable upon repayment of the debt instruments and any debt investments on non - accrua l status (3) 98% of floating interest rates on Private Loan debt investments are subject to contractual minimum “floor” rates |
| mainstcapital.com NYSE: MAIN Main Street Capital Corporation Page 30 Middle Market Investment Portfolio 34 investments / $363.5 million in fair value • 10% of total investment portfolio at fair value Average investment size of $12.3 million (1) (less than 1% of total portfolio) Investments in secured and/or rated debt investments • 99% of Middle Market portfolio is secured debt • 99% of Middle Market debt portfolio is first lien term debt Debt yielding 8.0% (2) • 96% (1)(3) of Middle Market debt investments bear interest at floating rates, providing matching with MAIN’s floating rate credit facility • Approximately 400 basis point net cash interest margin vs “matched” floating rate on the MAIN credit facility More investment liquidity compared to LMM and Private Loan Middle Market Investment Portfolio provides a diversified mix of investments and diverse sources of income to complement the LMM Investment Portfolio and a potential source of liquidity for MAIN’s future investment activities (1) As of June 30 , 2022; based on cost (2) Weighted - average effective yield is calculated using the applicable interest rate as of June 30, 2022 and includes amortization of deferred debt origination fees and accretion of original issue discount, but excludes fees payable upon repayment of the debt instruments and any debt investments on non - acc rual status (3) 83% of floating interest rates on Middle Market debt investments are subject to contractual minimum “floor” rates |
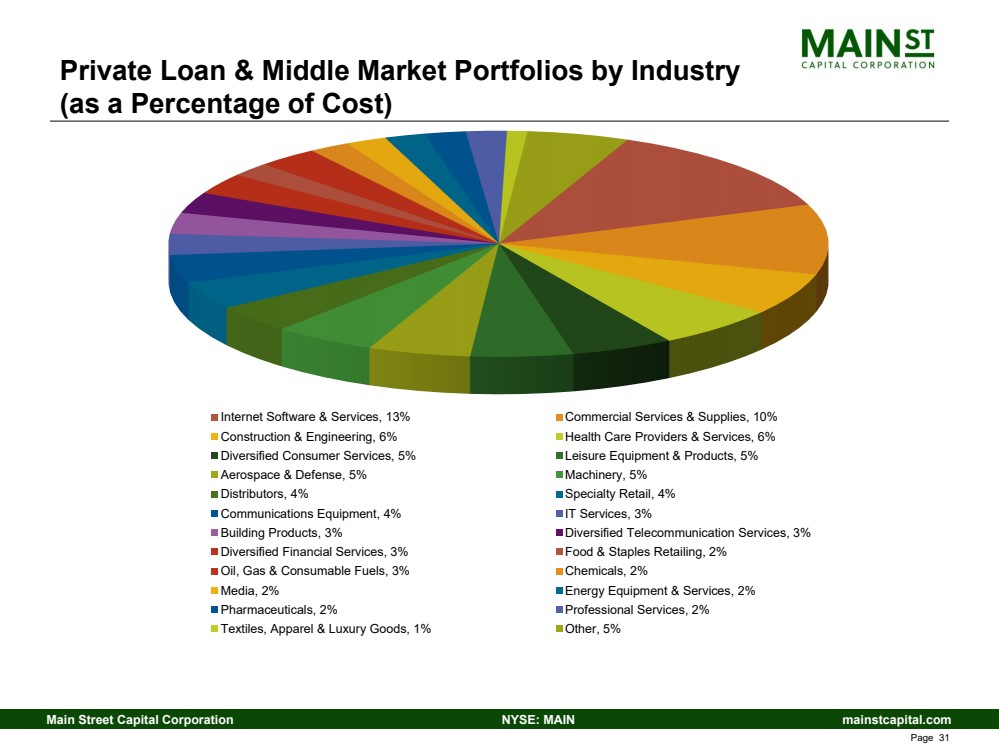
| mainstcapital.com NYSE: MAIN Main Street Capital Corporation Page 31 Internet Software & Services, 13% Commercial Services & Supplies, 10% Construction & Engineering, 6% Health Care Providers & Services, 6% Diversified Consumer Services, 5% Leisure Equipment & Products, 5% Aerospace & Defense, 5% Machinery, 5% Distributors, 4% Specialty Retail, 4% Communications Equipment, 4% IT Services, 3% Building Products, 3% Diversified Telecommunication Services, 3% Diversified Financial Services, 3% Food & Staples Retailing, 2% Oil, Gas & Consumable Fuels, 3% Chemicals, 2% Media, 2% Energy Equipment & Services, 2% Pharmaceuticals, 2% Professional Services, 2% Textiles, Apparel & Luxury Goods, 1% Other, 5% Private Loan & Middle Market Portfolios by Industry (as a Percentage of Cost) |
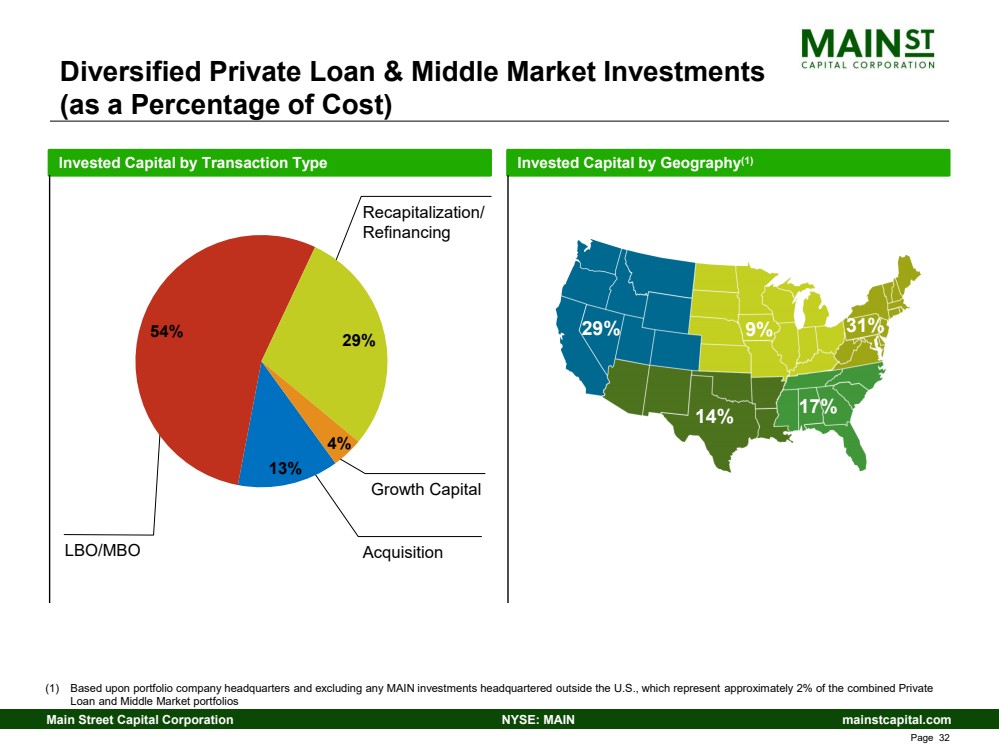
| mainstcapital.com NYSE: MAIN Main Street Capital Corporation Page 32 LBO/MBO Acquisition Recapitalization/ Refinancing Diversified Private Loan & Middle Market Investments (as a Percentage of Cost) Invested Capital by Transaction Type Invested Capital by Geography (1) 29% 9% 14% 17% 31% (1) Based upon portfolio company headquarters and excluding any MAIN investments headquartered outside the U.S., which represent app roximately 2% of the combined Private Loan and Middle Market portfolios 13% 54% 29% 4% Growth Capital |
| mainstcapital.com NYSE: MAIN Main Street Capital Corporation Page 33 Main Street Capital Corporation Financial Overview 2 nd Quarter – 2022 |

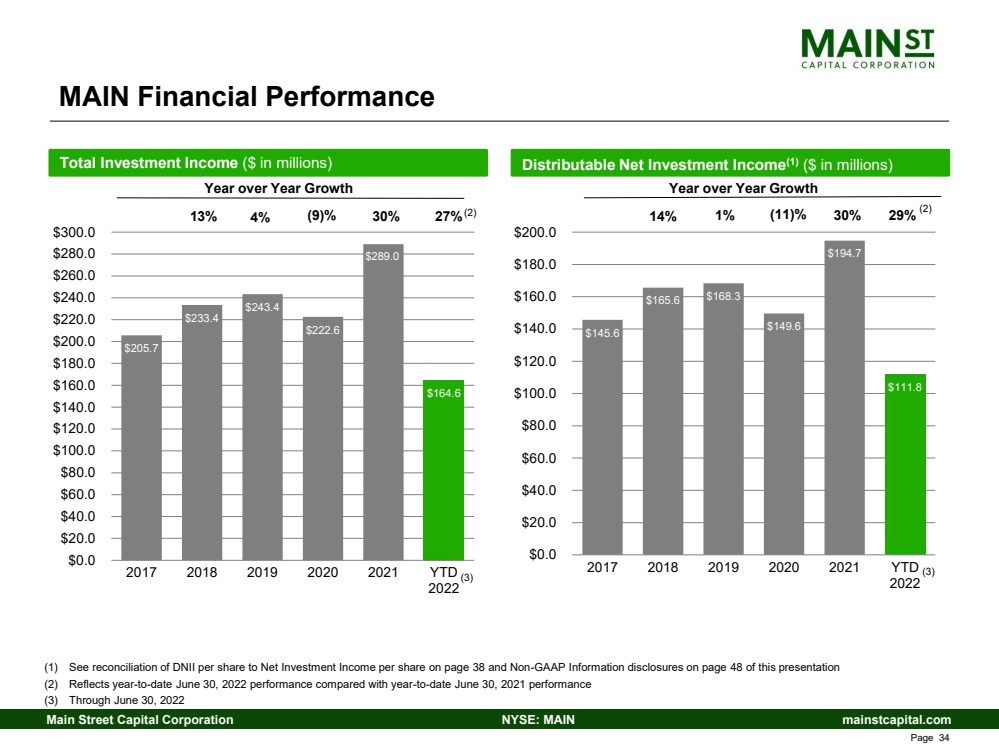
| mainstcapital.com NYSE: MAIN Main Street Capital Corporation Page 34 MAIN Financial Performance Total Investment Income ($ in millions) $205.7 $233.4 $243.4 $222.6 $289.0 $164.6 2017 2018 2019 2020 2021 YTD 2022 $0.0 $20.0 $40.0 $60.0 $80.0 $100.0 $120.0 $140.0 $160.0 $180.0 $200.0 $220.0 $240.0 $260.0 $280.0 $300.0 (9)% Distributable Net Investment Income (1) ($ in millions) $145.6 $165.6 $168.3 $149.6 $194.7 $111.8 2017 2018 2019 2020 2021 YTD 2022 $0.0 $20.0 $40.0 $60.0 $80.0 $100.0 $120.0 $140.0 $160.0 $180.0 $200.0 Year over Year Growth Year over Year Growth 14% 4% 1% 13% 30% 30% (11)% (1) See reconciliation of DNII per share to Net Investment Income per share on page 38 and Non - GAAP Information disclosures on page 48 of this presentation (2) Reflects year - to - date June 30, 2022 performance compared with year - to - date June 30, 2021 performance (3) Through June 30, 2022 (3) 27% (2) 29 % (2) (3) |
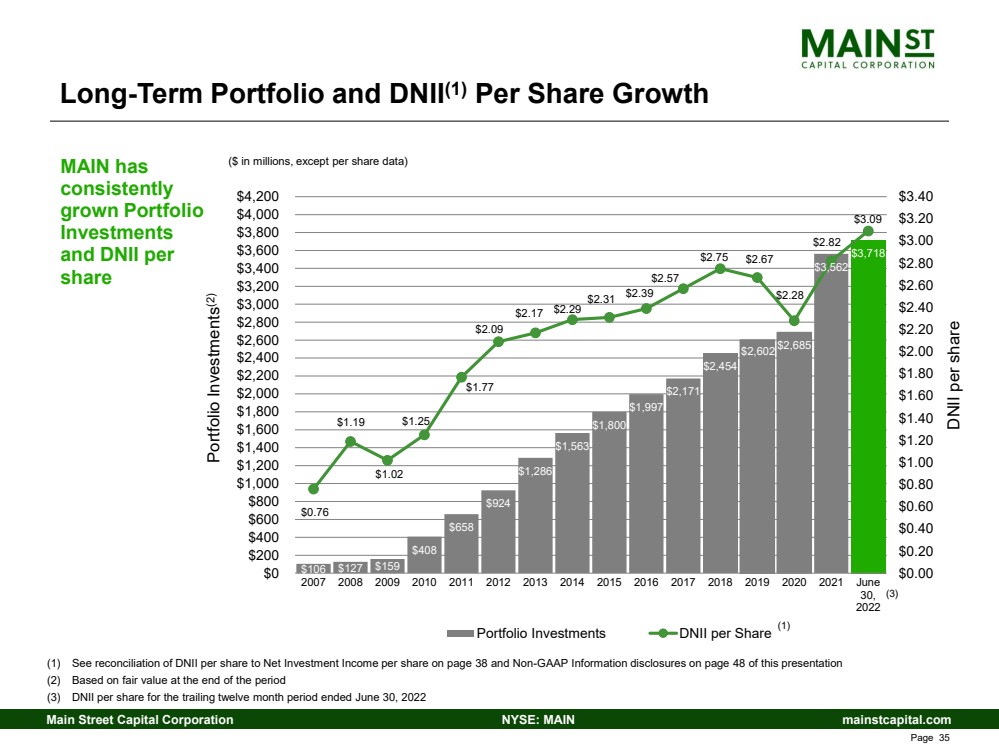
| mainstcapital.com NYSE: MAIN Main Street Capital Corporation Page 35 $106 $127 $159 $408 $658 $924 $1,286 $1,563 $1,800 $1,997 $2,171 $2,454 $2,685 $3,562 $3,718 $0.76 $1.19 $1.02 $1.25 $1.77 $2.09 $2.17 $2.29 $2.31 $2.39 $2.57 $2.75 $2.67 $2.28 $2.82 $3.09 $0.00 $0.20 $0.40 $0.60 $0.80 $1.00 $1.20 $1.40 $1.60 $1.80 $2.00 $2.20 $2.40 $2.60 $2.80 $3.00 $3.20 $3.40 2007 2008 2009 2010 2011 2012 2013 2014 2015 2016 2017 2018 2019 2020 2021 June 30, 2022 $0 $200 $400 $600 $800 $1,000 $1,200 $1,400 $1,600 $1,800 $2,000 $2,200 $2,400 $2,600 $2,800 $3,000 $3,200 $3,400 $3,600 $3,800 $4,000 $4,200 DNII per share Portfolio Investments (2) Portfolio Investments DNII per Share (1) Long - Term Portfolio and DNII (1) Per Share Growth MAIN has consistently grown Portfolio Investments and DNII per share ($ in millions, except per share data) (1) See reconciliation of DNII per share to Net Investment Income per share on page 38 and Non - GAAP Information disclosures on page 48 of this presentation (2) Based on fair value at the end of the period (3) DNII per share for the trailing twelve month period ended June 30, 2022 $2,602 (3) |
| mainstcapital.com NYSE: MAIN Main Street Capital Corporation Page 36 Efficient and Leverageable Operating Structure “Internally managed” structure means no external management fees or expenses are paid Alignment of interest between management and investors • Greater incentives to maximize increases to shareholder value and rationalize debt and equity capital raises • 100% of MAIN’s management efforts and activities are for the benefit of MAIN investors MAIN targets total operating expenses (1) as a percentage of average assets (Operating Expense to Assets Ratio) at or less than 2% • Long - term actual results have significantly outperformed target • An industry leading position in cost efficiency, with an Operating Expense to Assets Ratio of 1.5% (2) Significant portion of total operating expenses (1) are non - cash • Non - cash share - based compensation and deferred compensation expenses were 21.5% (2) of total operating expenses (1) • Operating Expense to Assets Ratio of 1.1% (2) excluding non - cash share - based compensation and deferred compensation expense MAIN’s internally managed operating structure provides significant operating leverage and greater returns for our shareholders (1) Total expenses excluding interest expense (2) Based upon the trailing twelve month period ended June 30, 2022 |
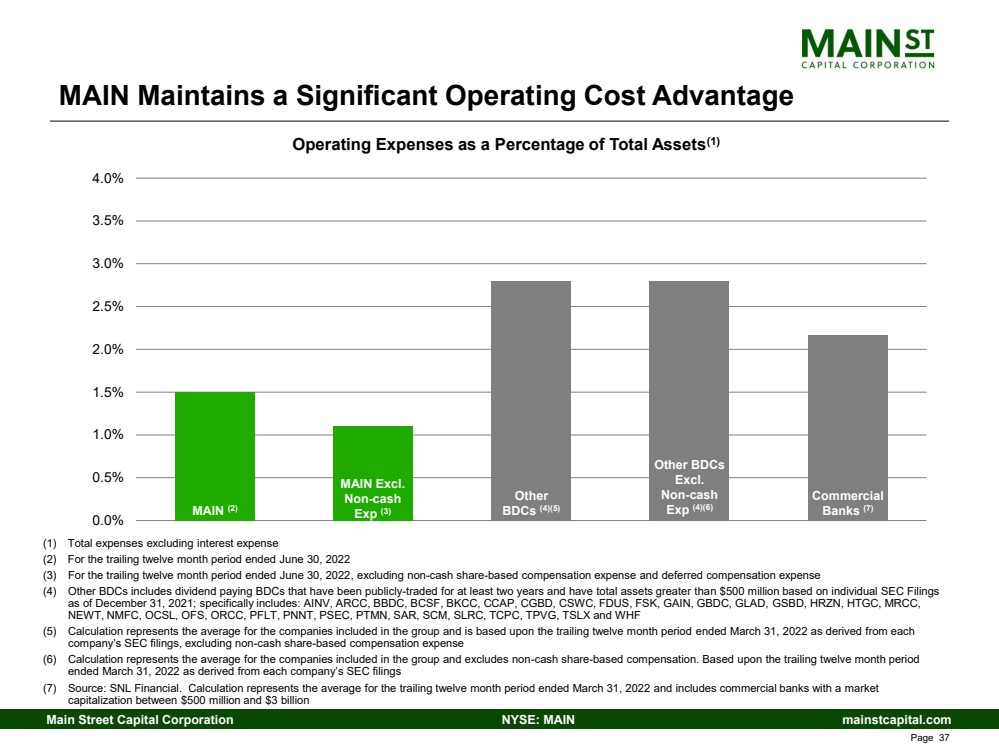
| mainstcapital.com NYSE: MAIN Main Street Capital Corporation Page 37 MAIN Maintains a Significant Operating Cost Advantage (1) Total expenses excluding interest expense (2) For the trailing twelve month period ended June 30, 2022 (3) For the trailing twelve month period ended June 30, 2022 , excluding non - cash share - based compensation expense and deferred compensation expense (4) Other BDCs includes dividend paying BDCs that have been publicly - traded for at least two years and have total assets greater tha n $500 million based on individual SEC Filings as of December 31, 2021; specifically includes: AINV, ARCC, BBDC, BCSF, BKCC, CCAP, CGBD, CSWC, FDUS, FSK, GAIN, GBDC, GLAD, GSB D, HRZN, HTGC, MRCC, NEWT, NMFC, OCSL, OFS, ORCC, PFLT, PNNT, PSEC, PTMN, SAR, SCM, SLRC, TCPC, TPVG, TSLX and WHF (5) Calculation represents the average for the companies included in the group and is based upon the trailing twelve month period en ded March 31, 2022 as derived from each company’s SEC filings, excluding non - cash share - based compensation expense (6) Calculation represents the average for the companies included in the group and excludes non - cash share - based compensation. Based upon the trailing twelve month period ended March 31, 2022 as derived from each company’s SEC filings (7) Source: SNL Financial. Calculation represents the average for the trailing twelve month period ended March 31, 2022 and includes commercial banks with a market capitalization between $500 million and $3 billion 0.0% 0.5% 1.0% 1.5% 2.0% 2.5% 3.0% 3.5% 4.0% MAIN (2) Other BDCs (4)(5) Commercial Banks (7) Operating Expenses as a Percentage of Total Assets (1) MAIN Excl. Non - cash Exp (3) Other BDCs Excl. Non - cash Exp (4)(6) |
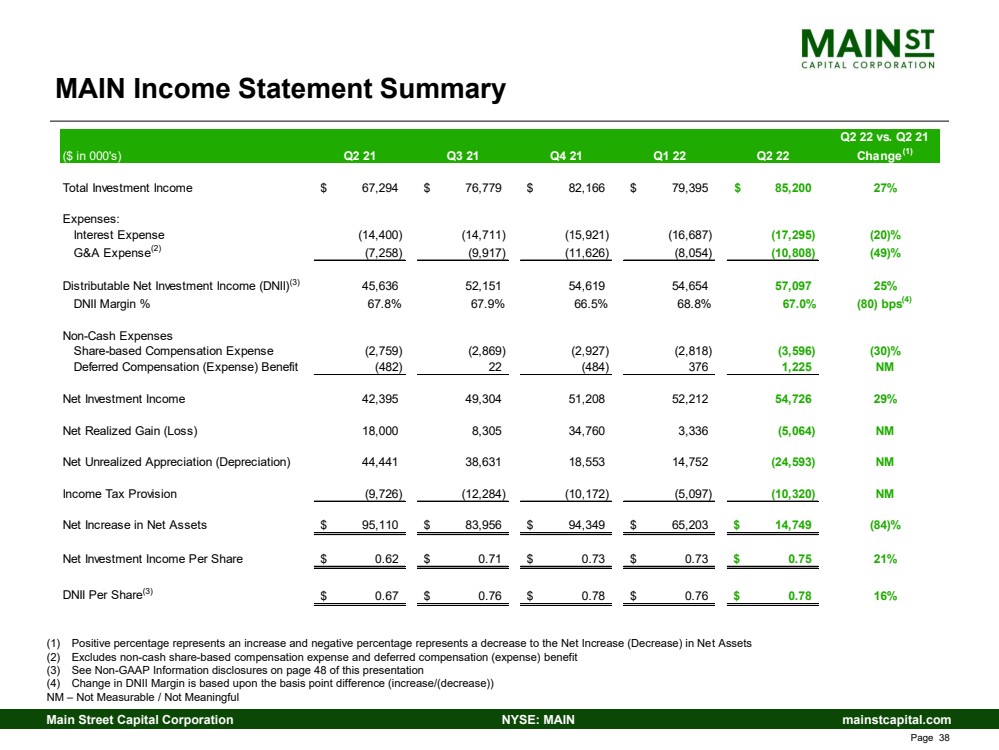
| mainstcapital.com NYSE: MAIN Main Street Capital Corporation Page 38 MAIN Income Statement Summary (1) Positive percentage represents an increase and negative percentage represents a decrease to the Net Increase (Decrease) in Ne t A ssets (2) Excludes non - cash share - based compensation expense and deferred compensation (expense) benefit (3) See Non - GAAP Information disclosures on page 48 of this presentation (4) Change in DNII Margin is based upon the basis point difference (increase/(decrease)) NM – Not Measurable / Not Meaningful Q2 22 vs. Q2 21 ($ in 000's) Q2 21 Q3 21 Q4 21 Q1 22 Q2 22 Change (1) Total Investment Income 67,294 $ 76,779 $ 82,166 $ 79,395 $ 85,200 $ 27% Expenses: Interest Expense (14,400) (14,711) (15,921) (16,687) (17,295) (20)% G&A Expense (2) (7,258) (9,917) (11,626) (8,054) (10,808) (49)% Distributable Net Investment Income (DNII) (3) 45,636 52,151 54,619 54,654 57,097 25% DNII Margin % 67.8% 67.9% 66.5% 68.8% 67.0% (80) bps (4) Non-Cash Expenses Share-based Compensation Expense (2,759) (2,869) (2,927) (2,818) (3,596) (30)% Deferred Compensation (Expense) Benefit (482) 22 (484) 376 1,225 NM Net Investment Income 42,395 49,304 51,208 52,212 54,726 29% Net Realized Gain (Loss) 18,000 8,305 34,760 3,336 (5,064) NM Net Unrealized Appreciation (Depreciation) 44,441 38,631 18,553 14,752 (24,593) NM Income Tax Provision (9,726) (12,284) (10,172) (5,097) (10,320) NM Net Increase in Net Assets 95,110 $ 83,956 $ 94,349 $ 65,203 $ 14,749 $ (84)% Net Investment Income Per Share 0.62 $ 0.71 $ 0.73 $ 0.73 $ 0.75 $ 21% DNII Per Share (3) 0.67 $ 0.76 $ 0.78 $ 0.76 $ 0.78 $ 16% |
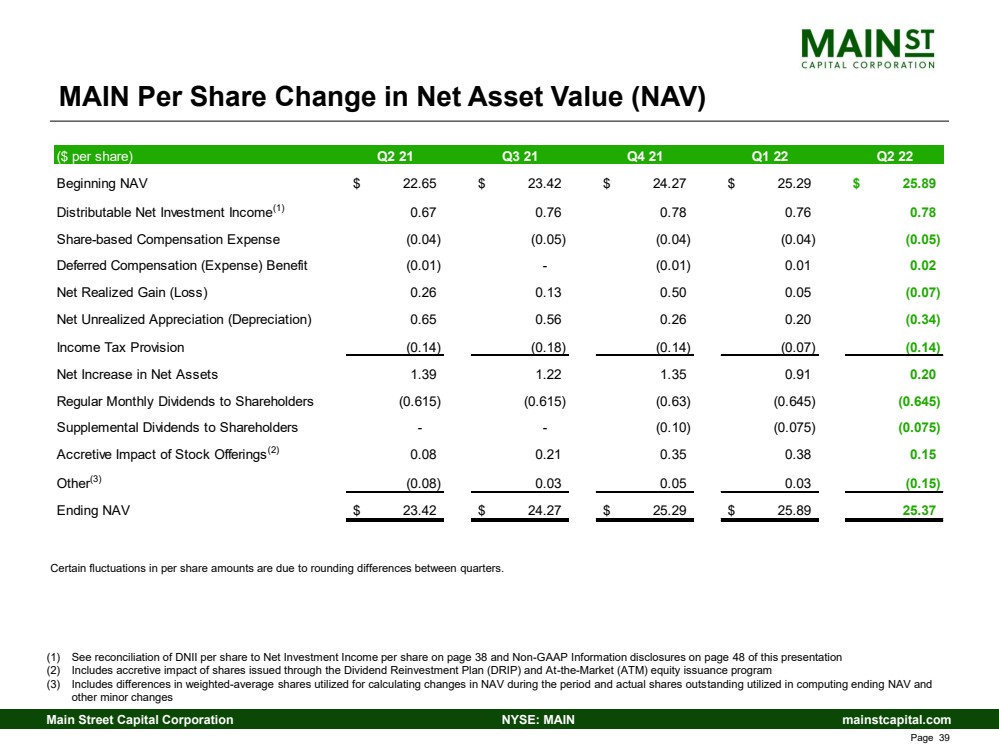
| mainstcapital.com NYSE: MAIN Main Street Capital Corporation Page 39 MAIN Per Share Change in Net Asset Value (NAV) (1) See reconciliation of DNII per share to Net Investment Income per share on page 38 and Non - GAAP Information disclosures on page 48 of this presentation (2) Includes accretive impact of shares issued through the Dividend Reinvestment Plan (DRIP) and At - the - Market (ATM) equity issuance program (3) Includes differences in weighted - average shares utilized for calculating changes in NAV during the period and actual shares outs tanding utilized in computing ending NAV and other minor changes Certain fluctuations in per share amounts are due to rounding differences between quarters. ($ per share) Q2 21 Q3 21 Q4 21 Q1 22 Q2 22 Beginning NAV 22.65 $ 23.42 $ 24.27 $ 25.29 $ 25.89 $ Distributable Net Investment Income (1) 0.67 0.76 0.78 0.76 0.78 Share-based Compensation Expense (0.04) (0.05) (0.04) (0.04) (0.05) Deferred Compensation (Expense) Benefit (0.01) - (0.01) 0.01 0.02 Net Realized Gain (Loss) 0.26 0.13 0.50 0.05 (0.07) Net Unrealized Appreciation (Depreciation) 0.65 0.56 0.26 0.20 (0.34) Income Tax Provision (0.14) (0.18) (0.14) (0.07) (0.14) Net Increase in Net Assets 1.39 1.22 1.35 0.91 0.20 Regular Monthly Dividends to Shareholders (0.615) (0.615) (0.63) (0.645) (0.645) Supplemental Dividends to Shareholders - - (0.10) (0.075) (0.075) Accretive Impact of Stock Offerings (2) 0.08 0.21 0.35 0.38 0.15 Other (3) (0.08) 0.03 0.05 0.03 (0.15) Ending NAV 23.42 $ 24.27 $ 25.29 $ 25.89 $ 25.37 |
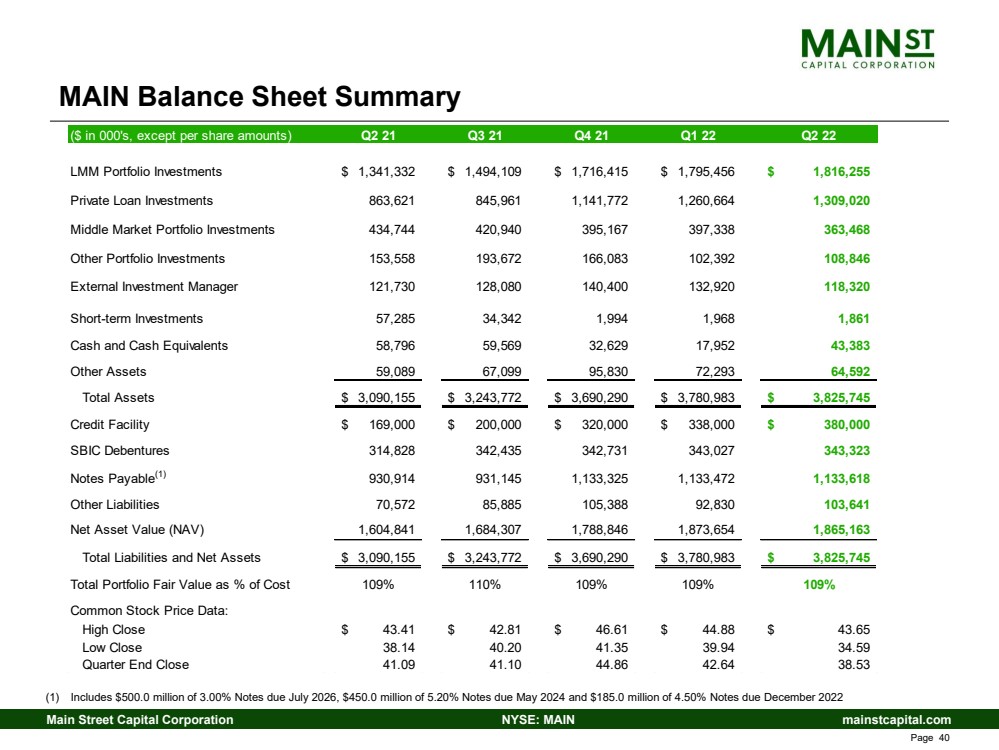
| mainstcapital.com NYSE: MAIN Main Street Capital Corporation Page 40 MAIN Balance Sheet Summary (1) Includes $500.0 million of 3.00% Notes due July 2026, $450.0 million of 5.20% Notes due May 2024 and $185.0 million of 4.50% Not es due December 2022 ($ in 000's, except per share amounts) Q2 21 Q3 21 Q4 21 Q1 22 Q2 22 LMM Portfolio Investments 1,341,332 $ 1,494,109 $ 1,716,415 $ 1,795,456 $ 1,816,255 $ Private Loan Investments 863,621 845,961 1,141,772 1,260,664 1,309,020 Middle Market Portfolio Investments 434,744 420,940 395,167 397,338 363,468 Other Portfolio Investments 153,558 193,672 166,083 102,392 108,846 External Investment Manager 121,730 128,080 140,400 132,920 118,320 Short-term Investments 57,285 34,342 1,994 1,968 1,861 Cash and Cash Equivalents 58,796 59,569 32,629 17,952 43,383 Other Assets 59,089 67,099 95,830 72,293 64,592 Total Assets 3,090,155 $ 3,243,772 $ 3,690,290 $ 3,780,983 $ 3,825,745 $ Credit Facility 169,000 $ 200,000 $ 320,000 $ 338,000 $ 380,000 $ SBIC Debentures 314,828 342,435 342,731 343,027 343,323 Notes Payable (1) 930,914 931,145 1,133,325 1,133,472 1,133,618 Other Liabilities 70,572 85,885 105,388 92,830 103,641 Net Asset Value (NAV) 1,604,841 1,684,307 1,788,846 1,873,654 1,865,163 Total Liabilities and Net Assets 3,090,155 $ 3,243,772 $ 3,690,290 $ 3,780,983 $ 3,825,745 $ Total Portfolio Fair Value as % of Cost 109% 110% 109% 109% 109% Common Stock Price Data: High Close 43.41 $ 42.81 $ 46.61 $ 44.88 $ 43.65 $ Low Close 38.14 40.20 41.35 39.94 34.59 Quarter End Close 41.09 41.10 44.86 42.64 38.53 |
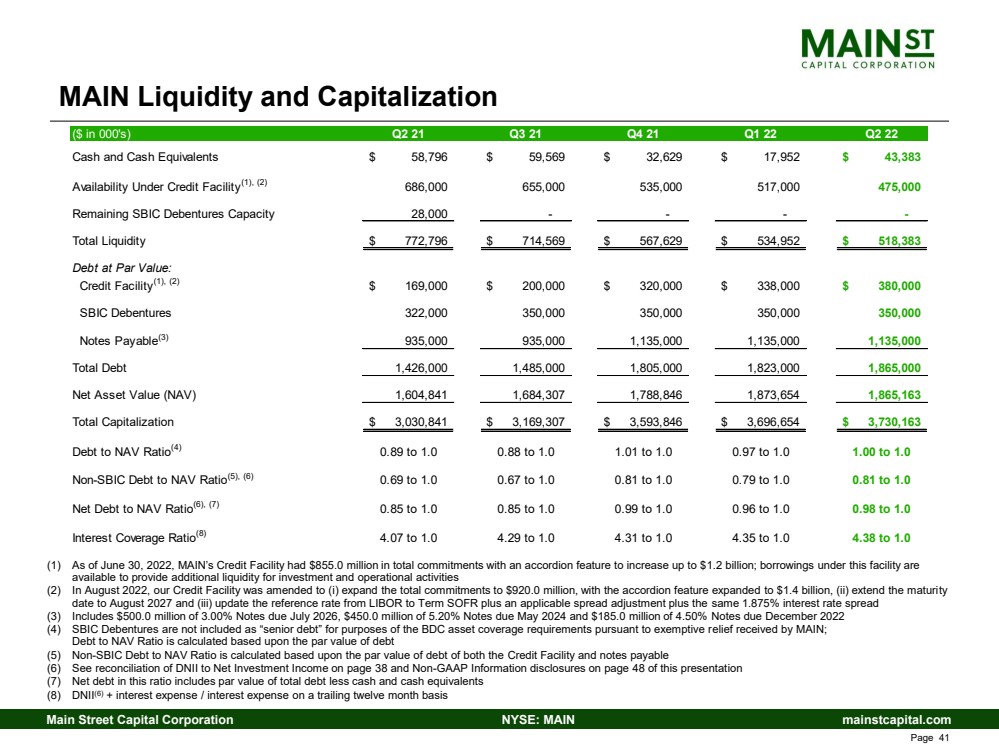
| mainstcapital.com NYSE: MAIN Main Street Capital Corporation Page 41 MAIN Liquidity and Capitalization (1) As of June 30, 2022, MAIN’s Credit F acility had $ 855 ..0 million in total commitments with an accordion feature to increase up to $ 1.2 billion; borrowings under this facility are available to provide additional liquidity for investment and operational activities (2) In August 2022, our Credit Facility was amended to ( i ) expand the total commitments to $920.0 million, with the accordion feature expanded to $1.4 billion, (ii) extend the maturi ty date to August 2027 and (iii) update the reference rate from LIBOR to Term SOFR plus an applicable spread adjustment plus the sa me 1.875% interest rate spread (3) Includes $500.0 million of 3.00% Notes due July 2026, $450.0 million of 5.20% Notes due May 2024 and $185.0 million of 4.50% Not es due December 2022 (4) SBIC Debentures are not included as “senior debt” for purposes of the BDC asset coverage requirements pursuant to exemptive r eli ef received by MAIN ; Debt to NAV Ratio is calculated based upon the par value of debt (5) Non - SBIC Debt to NAV Ratio is calculated based upon the par value of debt of both the Credit Facility and notes payable (6) See reconciliation of DNII to Net Investment Income on page 38 and Non - GAAP Information disclosures on page 48 of this presentat ion (7) Net debt in this ratio includes par value of total debt less cash and cash equivalents (8) DNII (6) + interest expense / interest expense on a trailing twelve month basis ($ in 000's) Q2 21 Q3 21 Q4 21 Q1 22 Q2 22 Cash and Cash Equivalents 58,796 $ 59,569 $ 32,629 $ 17,952 $ 43,383 $ Availability Under Credit Facility (1), (2) 686,000 655,000 535,000 517,000 475,000 Remaining SBIC Debentures Capacity 28,000 - - - - Total Liquidity 772,796 $ 714,569 $ 567,629 $ 534,952 $ 518,383 $ Debt at Par Value: Credit Facility (1), (2) 169,000 $ 200,000 $ 320,000 $ 338,000 $ 380,000 $ SBIC Debentures 322,000 350,000 350,000 350,000 350,000 Notes Payable (3) 935,000 935,000 1,135,000 1,135,000 1,135,000 Total Debt 1,426,000 1,485,000 1,805,000 1,823,000 1,865,000 Net Asset Value (NAV) 1,604,841 1,684,307 1,788,846 1,873,654 1,865,163 Total Capitalization 3,030,841 $ 3,169,307 $ 3,593,846 $ 3,696,654 $ 3,730,163 $ Debt to NAV Ratio (4) 0.89 to 1.0 0.88 to 1.0 1.01 to 1.0 0.97 to 1.0 1.00 to 1.0 Non-SBIC Debt to NAV Ratio (5), (6) 0.69 to 1.0 0.67 to 1.0 0.81 to 1.0 0.79 to 1.0 0.81 to 1.0 Net Debt to NAV Ratio (6), (7) 0.85 to 1.0 0.85 to 1.0 0.99 to 1.0 0.96 to 1.0 0.98 to 1.0 Interest Coverage Ratio (8) 4.07 to 1.0 4.29 to 1.0 4.31 to 1.0 4.35 to 1.0 4.38 to 1.0 |
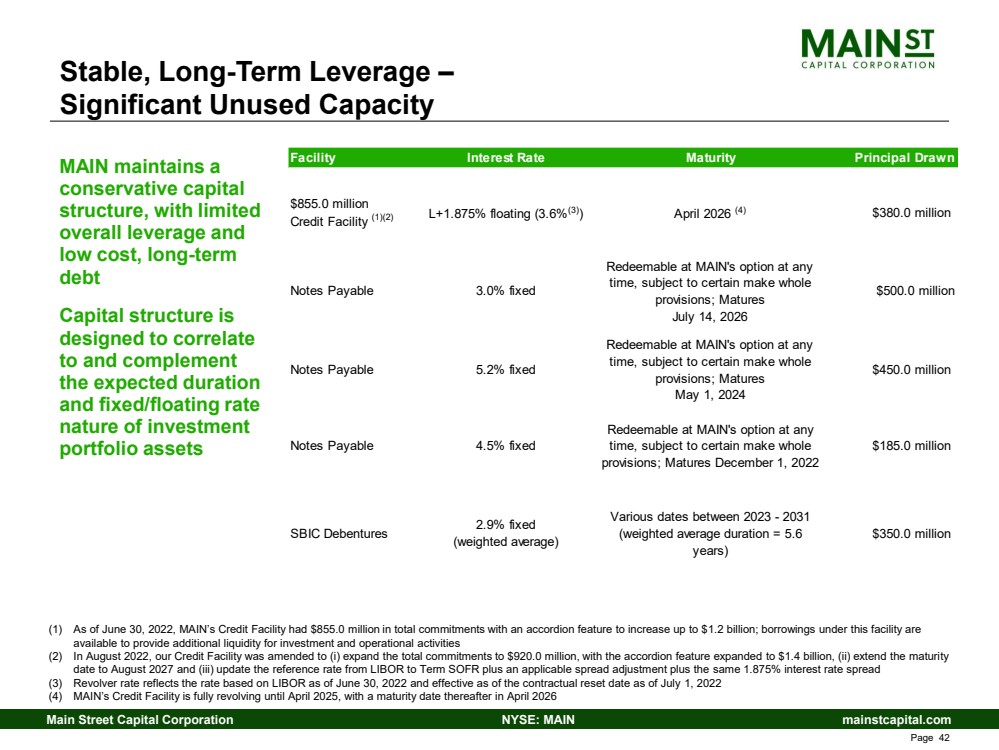
| mainstcapital.com NYSE: MAIN Main Street Capital Corporation Page 42 Stable, Long - Term Leverage – Significant Unused Capacity MAIN maintains a conservative capital structure, with limited overall leverage and low cost, long - term debt Capital structure is designed to correlate to and complement the expected duration and fixed/floating rate nature of investment portfolio assets (1) As of June 30, 2022, MAIN’s Credit F acility had $ 855 ..0 million in total commitments with an accordion feature to increase up to $ 1.2 billion; borrowings under this facility are available to provide additional liquidity for investment and operational activities (2) In August 2022, our Credit Facility was amended to ( i ) expand the total commitments to $920.0 million, with the accordion feature expanded to $1.4 billion, (ii) extend the maturi ty date to August 2027 and (iii) update the reference rate from LIBOR to Term SOFR plus an applicable spread adjustment plus the sa me 1.875% interest rate spread (3) Revolver rate reflects the rate based on LIBOR as of June 30, 2022 and effective as of the contractual reset date as of July 1, 2022 (4) MAIN’s Credit Facility is fully revolving until April 2025, with a maturity date thereafter in April 2026 Facility Interest Rate Maturity Principal Drawn $855.0 million Credit Facility (1)(2) L+1.875% floating (3.6% (3) ) April 2026 (4) $380.0 million Notes Payable 3.0% fixed Redeemable at MAIN's option at any time, subject to certain make whole provisions; Matures July 14, 2026 $500.0 million Notes Payable 5.2% fixed Redeemable at MAIN's option at any time, subject to certain make whole provisions; Matures May 1, 2024 $450.0 million Notes Payable 4.5% fixed Redeemable at MAIN's option at any time, subject to certain make whole provisions; Matures December 1, 2022 $185.0 million SBIC Debentures 2.9% fixed (weighted average) Various dates between 2023 - 2031 (weighted average duration = 5.6 years) $350.0 million |
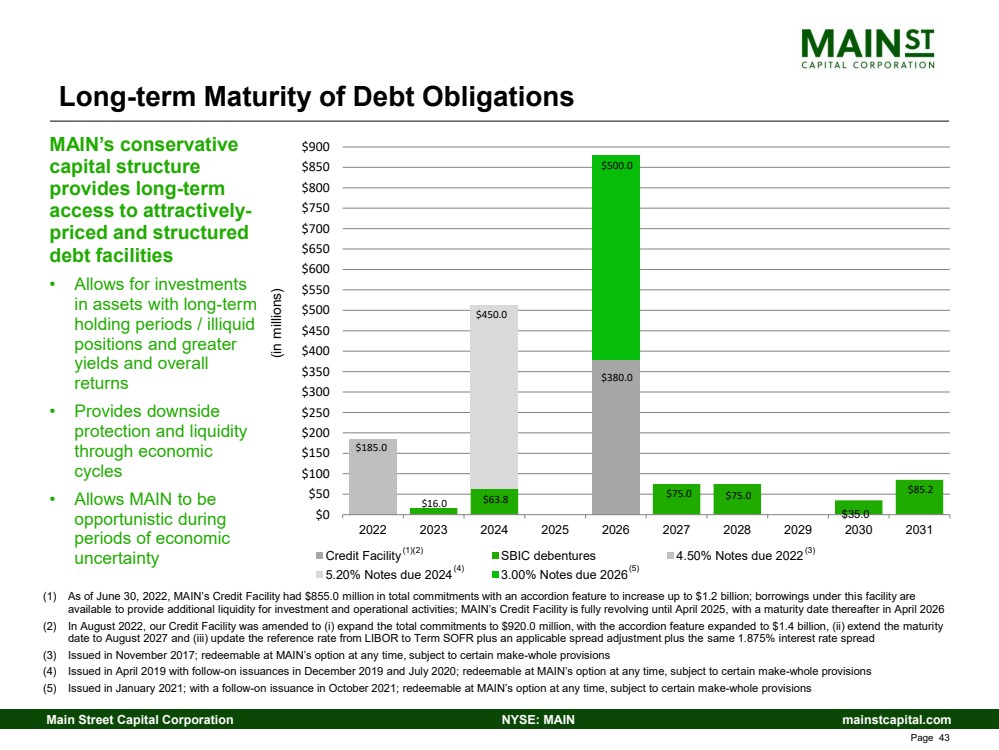
| mainstcapital.com NYSE: MAIN Main Street Capital Corporation Page 43 MAIN (2) Internally Managed BDC’s (3)(5) Externally Managed BDC’s (4)(5) Long - term Maturity of Debt Obligations MAIN’s conservative capital structure provides long - term access to attractively - priced and structured debt facilities • Allows for investments in assets with long - term holding periods / illiquid positions and greater yields and overall returns • Provides downside protection and liquidity through economic cycles • Allows MAIN to be opportunistic during periods of economic uncertainty $380.0 $63.8 $75.0 $85.2 $185.0 $450.0 $500.0 $0 $50 $100 $150 $200 $250 $300 $350 $400 $450 $500 $550 $600 $650 $700 $750 $800 $850 $900 2022 2023 2024 2025 2026 2027 2028 2029 2030 2031 (in millions) Credit Facility SBIC debentures 4.50% Notes due 2022 5.20% Notes due 2024 3.00% Notes due 2026 (5) $16.0 $75.0 (1)(2) ( 3 ) (1) As of June 30, 2022, MAIN’s Credit Fa cility had $855.0 million in total commitments with an accordion feature to increase up to $1.2 billion; borrowings under thi s f acility are available to provide additional liquidity for investment and operational activities; MAIN’s Credit Facility is fully revolving until April 2025, with a maturity date thereafter in April 2026 (2) In August 2022, our Credit Facility was amended to ( i ) expand the total commitments to $920.0 million, with the accordion feature expanded to $1.4 billion, (ii) extend the maturi ty date to August 2027 and (iii) update the reference rate from LIBOR to Term SOFR plus an applicable spread adjustment plus the sa me 1.875% interest rate spread (3) Issued in November 2017; redeemable at MAIN’s option at any time, subject to certain make - whole provisions (4) Issued in April 2019 with follow - on issuances in December 2019 and July 2020; redeemable at MAIN’s option at any time, subject to cert ain make - whole provisions (5) Issued in January 2021; with a follow - on issuance in October 2021; redeemable at MAIN’s option at any time, subject to certain m ake - whole provisions (4) $35.0 |
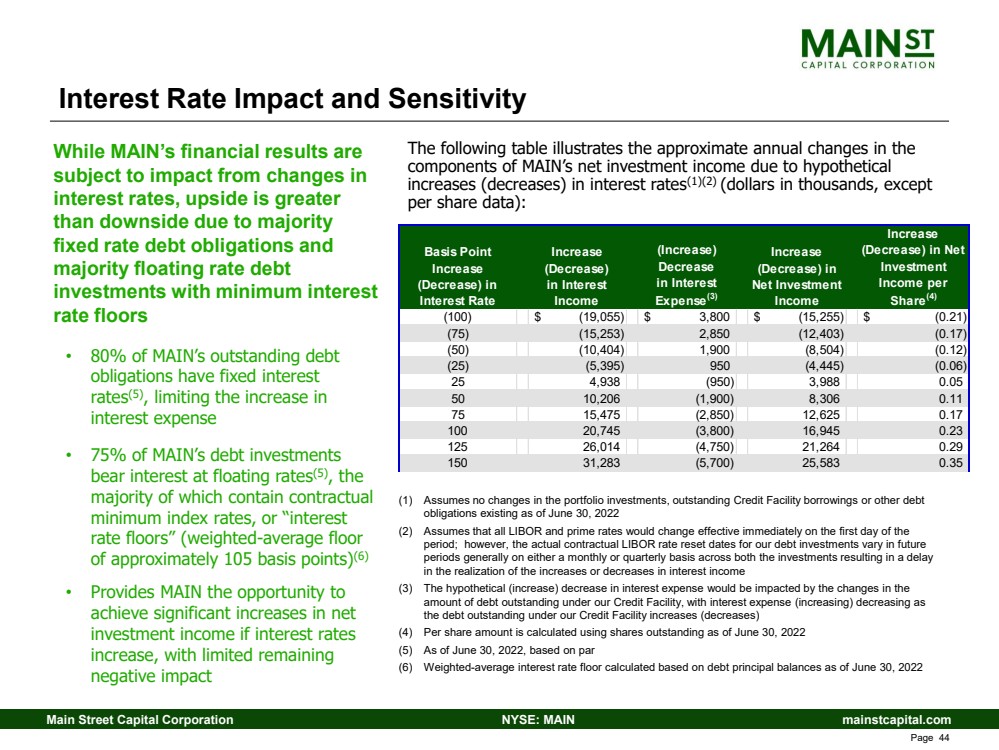
| mainstcapital.com NYSE: MAIN Main Street Capital Corporation Page 44 Interest Rate Impact and Sensitivity The following table illustrates the approximate annual changes in the components of MAIN’s net investment income due to hypothetical increases (decreases) in interest rates (1)(2) (dollars in thousands, except per share data): While MAIN’s financial results are subject to impact from changes in interest rates, upside is greater than downside due to majority fixed rate debt obligations and majority floating rate debt investments with minimum interest rate floors • 80% of MAIN’s outstanding debt obligations have fixed interest rates (5) , limiting the increase in interest expense • 75% of MAIN’s debt investments bear interest at floating rates (5) , the majority of which contain contractual minimum index rates, or “interest rate floors” (weighted - average floor of approximately 105 basis points) (6) • Provides MAIN the opportunity to achieve significant increases in net investment income if interest rates increase, with limited remaining negative impact (1) Assumes no changes in the portfolio investments, outstanding Credit Facility borrowings or other debt obligations existing as of June 30, 2022 (2) Assumes that all LIBOR and prime rates would change effective immediately on the first day of the period; however, the actual contractual LIBOR rate reset dates for our debt investments vary in future periods generally on either a monthly or quarterly basis across both the investments resulting in a delay in the realization of the increases or decreases in interest income (3) The hypothetical (increase) decrease in interest expense would be impacted by the changes in the amount of debt outstanding under our Credit Facility, with interest expense (increasing) decreasing as the debt outstanding under our Credit Facility increases (decreases) (4) Per share amount is calculated using shares outstanding as of June 30, 2022 (5) As of June 30, 2022, based on par (6) Weighted - average interest rate floor calculated based on debt principal balances as of June 30, 2022 Basis Point Increase (Decrease) in Interest Rate Increase (Decrease) in Interest Income (Increase) Decrease in Interest Expense (3) Increase (Decrease) in Net Investment Income Increase (Decrease) in Net Investment Income per Share (4) (100) (19,055) $ 3,800 $ (15,255) $ (0.21) $ (75) (15,253) 2,850 (12,403) (0.17) (50) (10,404) 1,900 (8,504) (0.12) (25) (5,395) 950 (4,445) (0.06) 25 4,938 (950) 3,988 0.05 50 10,206 (1,900) 8,306 0.11 75 15,475 (2,850) 12,625 0.17 100 20,745 (3,800) 16,945 0.23 125 26,014 (4,750) 21,264 0.29 150 31,283 (5,700) 25,583 0.35 |
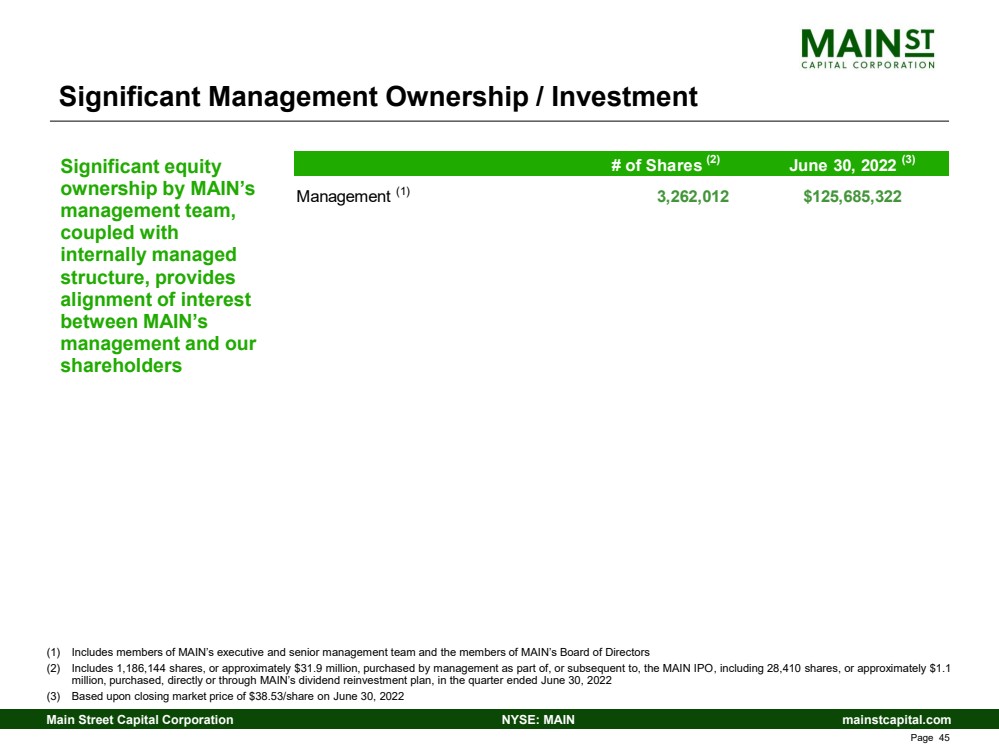
| mainstcapital.com NYSE: MAIN Main Street Capital Corporation Page 45 June 30, 2022 (3) Management (1) 3,262,012 $125,685,322 # of Shares (2) Significant Management Ownership / Investment Significant equity ownership by MAIN’s management team, coupled with internally managed structure, provides alignment of interest between MAIN’s management and our shareholders (1) Includes members of MAIN’s executive and senior management team and the members of MAIN’s Board of Directors (2) Includes 1,186,144 shares, or approximately $31.9 million, purchased by management as part of, or subsequent to, the MAIN IPO , i ncluding 28 ,410 shares, or approximately $1.1 million, purchased, directly or through MAIN’s dividend reinvestment plan, in the quarter ended June 30, 2022 (3) Based upon closing market price of $38.53/share on June 30, 2022 |
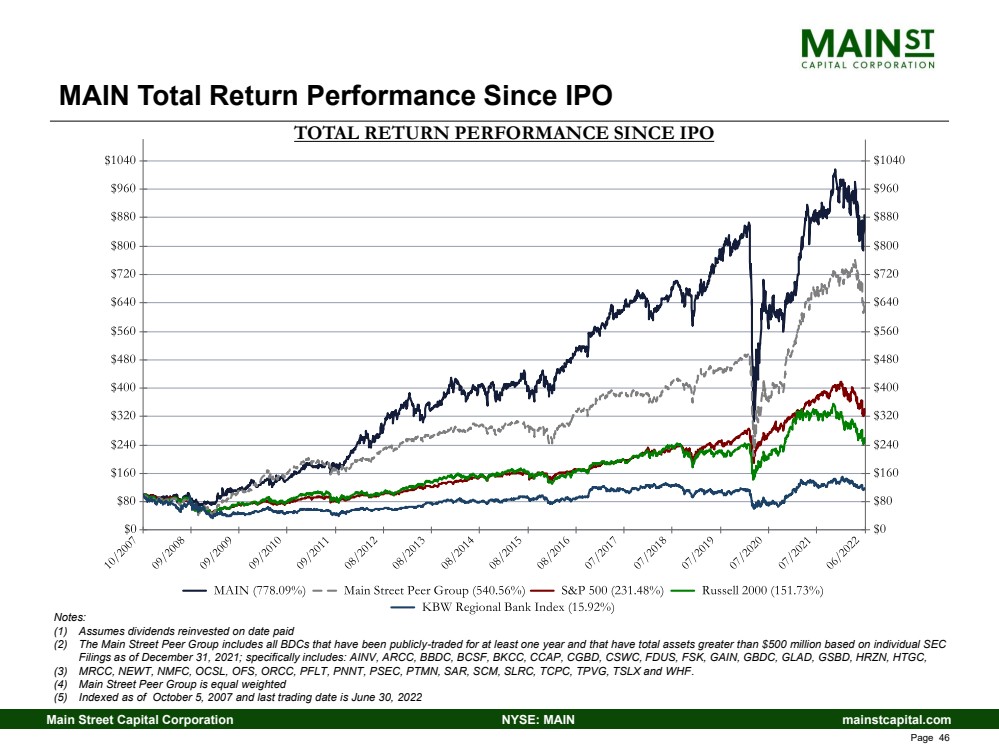
| mainstcapital.com NYSE: MAIN Main Street Capital Corporation Page 46 Notes: (1) Assumes dividends reinvested on date paid (2) The Main Street Peer Group includes all BDCs that have been publicly - traded for at least one year and that have total assets gre ater than $500 million based on individual SEC Filings as of December 31, 2021; specifically includes: AINV, ARCC, BBDC, BCSF, BKCC, CCAP, CGBD, CSWC, FDUS, FSK, GAIN, GBDC, GLAD, GSBD, HRZN, HTGC, (3) MRCC, NEWT, NMFC, OCSL, OFS, ORCC, PFLT, PNNT, PSEC, PTMN, SAR, SCM, SLRC, TCPC, TPVG, TSLX and WHF .. (4) Main Street Peer Group is equal weighted (5) Indexed as of October 5, 2007 and last trading date is June 30, 2022 MAIN Total Return Performance Since IPO TOTAL RETURN PERFORMANCE SINCE IPO |
| mainstcapital.com NYSE: MAIN Main Street Capital Corporation Page 47 Executive Summary Unique focus on under - served Lower Middle Market • Inefficient asset class with less competition • Unique market opportunity with attractive risk - adjusted returns • Generally first lien, senior secured debt investments plus meaningful equity participation Invest in complementary interest - bearing Private Loan and Middle Market debt investments • Lower risk / more liquid asset class • Opportunity for consistent investment activity • Generally first lien, senior secured debt investments Growing Asset Management Business drives additional investment income Efficient internally managed operating structure drives greater shareholder returns • Alignment of interests between management and our shareholders • Maintains an industry leading operating cost structure • Favorable operating cost comparison to other yield oriented investment options Attractive, recurring monthly dividend yield and historical net asset value per share growth • Periodic increases in monthly dividends • Increase in net asset value per share creates opportunity for stock price appreciation Strong liquidity and stable capitalization for sustainable growth Highly invested management team with successful track record Niche investment strategy with lower correlation to broader debt / equity markets |
| mainstcapital.com NYSE: MAIN Main Street Capital Corporation Page 48 Non - GAAP Information Distributable net investment income is net investment income, as determined in accordance with U .. S .. generally accepted accounting principles, or U .. S .. GAAP, excluding the impact of share - based compensation expense and deferred compensation expense or benefit (as defined below) which are non - cash in nature .. MAIN believes presenting distributable net investment income and the related per share amount is useful and appropriate supplemental disclosure of information for analyzing its financial performance since share - based compensation does not require settlement in cash and deferred compensation expense or benefit does not result in a net cash impact to Main Street upon settlement .. The unrealized appreciation in the fair value of deferred compensation plan assets results in a corresponding increase in deferred compensation obligations and results in an increase in compensation expense (“deferred compensation expense”) .. The unrealized depreciation of such assets results in a corresponding decrease in deferred compensation obligations and results in a decrease in compensation expense (“deferred compensation benefit”) .. However, distributable net investment income is a non - U .. S .. GAAP measure and should not be considered as a replacement for net investment income and other earnings measures presented in accordance with U .. S .. GAAP .. Instead, distributable net investment income should be reviewed only in connection with such U .. S .. GAAP measures in analyzing MAIN’s financial performance .. Net Debt to NAV Ratio is calculated as the Debt to NAV Ratio as determined in accordance with U .. S .. GAAP, except that total debt is reduced by cash and cash equivalents .. The Non - SBIC Debt to NAV Ratio is calculated in the same manner as the Debt to NAV Ratio, except that outstanding SBIC debentures are excluded from the debt pursuant to an exemptive order MAIN received from the Securities and Exchange Commission .. MAIN believes presenting the Net Debt to NAV Ratio is useful and appropriate supplemental disclosure for analyzing its financial position and leverage .. MAIN believes presenting the Non - SBIC Debt to NAV Ratio is useful and appropriate supplemental disclosure because Main Street, a business development company, is permitted to exclude such borrowings from its regulatory asset coverage ratio calculation pursuant to an exemptive order received from the Securities and Exchange Commission .. However, the Net Debt to NAV Ratio and the Non - SBIC Debt to NAV Ratio are non - U .. S .. GAAP measures and should not be considered as replacements for the Debt to NAV Ratio and other financial measures presented in accordance with U .. S .. GAAP .. Instead, the Net Debt to NAV Ratio and the Non - SBIC Debt to NAV Ratio should be reviewed only in connection with such U .. S .. GAAP measures in analyzing MAIN’s financial position .. |
| mainstcapital.com NYSE: MAIN Main Street Capital Corporation Page 49 MAIN Corporate Data Board of Directors Vincent D. Foster Chairman of the Board Main Street Capital Corporation J. Kevin Griffin Chief Strategy Officer MaineHealth Dwayne L. Hyzak CEO Main Street Capital Corporation John E. Jackson President & CEO CSI Compressco LP Brian E. Lane CEO & President Comfort Systems USA Kay Matthews Board of Directors SVB Financial Group (Chair) Dunia A. Shive Board of Directors DallasNews Corporation, Kimberly - Clark Corporation and Trinity Industries, Inc. Stephen B. Solcher Retired CFO BMC Software Executive Officers Dwayne L. Hyzak Chief Executive Officer David L. Magdol President & Chief Investment Officer Jesse E. Morris EVP, Chief Financial Officer & Chief Operating Officer Jason B. Beauvais EVP, General Counsel, Secretary & Chief Compliance Officer Nicholas T. Meserve Managing Director Lance A. Parker Vice President & Chief Accounting Officer Research Coverage Robert J. Dodd Raymond James (901) 579 - 4560 Kenneth S. Lee RBC Capital Markets (212) 905 - 5995 Mitchel Penn Oppenheimer & Co (212) 667 - 7136 Michael Ramirez Truist Securities (404) 926 - 5607 Erik Zwick Hovde Group (617) 510 - 1239 Corporate Headquarters 1300 Post Oak Blvd, 8 th Floor Houston, TX 77056 Tel: (713) 350 - 6000 Fax: (713) 350 - 6042 Independent Registered Public Accounting Firm Grant Thornton, LLP Houston, TX Corporate Counsel Dechert LLP Washington, D.C. Securities Listing Common Stock – NYSE: MAIN Transfer Agent American Stock Transfer & Trust Co. Tel: (800) 937 - 5449 www.astfinancial.com Investor Relation Contacts Dwayne L. Hyzak Chief Executive Officer Jesse E. Morris EVP, Chief Financial Officer & Chief Operating Officer Tel: (713) 350 - 6000 Ken Dennard Zach Vaughan Dennard Lascar Investor Relations Tel: (713) 529 - 6600 Management Executive Committee Dwayne L. Hyzak, Chief Executive Officer David L. Magdol, President & Chief Investment Officer Jesse E. Morris, EVP, Chief Financial Officer & Chief Operating Officer Jason B. Beauvais, EVP, General Counsel, Secretary & Chief Compliance Officer Investment Committee Dwayne L. Hyzak, Chief Executive Officer David L. Magdol, President & Chief Investment Officer Vincent D. Foster, Chairman of the Board Please visit our website at www.mainstcapital.com for additional information |
